

Investigations of Faraday Rotation Maps of Extended Radio Sources ...
Investigations of Faraday Rotation Maps of Extended Radio Sources ...
Investigations of Faraday Rotation Maps of Extended Radio Sources ...

Create successful ePaper yourself
Turn your PDF publications into a flip-book with our unique Google optimized e-Paper software.
112 CHAPTER 5. A BAYESIAN VIEW ON FARADAY ROTATION MAPS<br />
ε B (k)*k [erg cm -3 ]<br />
1e-11<br />
1e-12<br />
1e-13<br />
α B = 1.0<br />
α B = 0.67<br />
α B = 0.5<br />
α B = 0.3<br />
α B = 0.1<br />
k -2/3<br />
1e-14<br />
0.1 1 10 100<br />
k [kpc -1 ]<br />
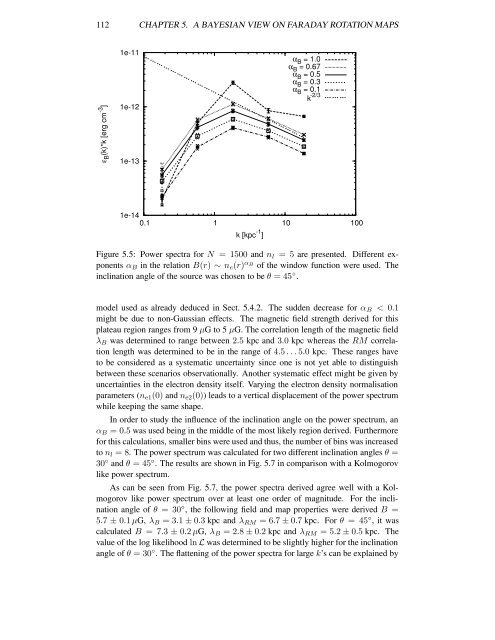
Figure 5.5: Power spectra for N = 1500 and n l = 5 are presented. Different exponents<br />
α B in the relation B(r) ∼ n e (r) α B<br />
<strong>of</strong> the window function were used. The<br />
inclination angle <strong>of</strong> the source was chosen to be θ = 45 ◦ .<br />
model used as already deduced in Sect. 5.4.2. The sudden decrease for α B < 0.1<br />
might be due to non-Gaussian effects. The magnetic field strength derived for this<br />
plateau region ranges from 9 µG to 5 µG. The correlation length <strong>of</strong> the magnetic field<br />
λ B was determined to range between 2.5 kpc and 3.0 kpc whereas the RM correlation<br />
length was determined to be in the range <strong>of</strong> 4.5 . . . 5.0 kpc. These ranges have<br />
to be considered as a systematic uncertainty since one is not yet able to distinguish<br />
between these scenarios observationally. Another systematic effect might be given by<br />
uncertainties in the electron density itself. Varying the electron density normalisation<br />
parameters (n e1 (0) and n e2 (0)) leads to a vertical displacement <strong>of</strong> the power spectrum<br />
while keeping the same shape.<br />
In order to study the influence <strong>of</strong> the inclination angle on the power spectrum, an<br />
α B = 0.5 was used being in the middle <strong>of</strong> the most likely region derived. Furthermore<br />
for this calculations, smaller bins were used and thus, the number <strong>of</strong> bins was increased<br />
to n l = 8. The power spectrum was calculated for two different inclination angles θ =<br />
30 ◦ and θ = 45 ◦ . The results are shown in Fig. 5.7 in comparison with a Kolmogorov<br />
like power spectrum.<br />
As can be seen from Fig. 5.7, the power spectra derived agree well with a Kolmogorov<br />
like power spectrum over at least one order <strong>of</strong> magnitude. For the inclination<br />
angle <strong>of</strong> θ = 30 ◦ , the following field and map properties were derived B =<br />
5.7 ± 0.1 µG, λ B = 3.1 ± 0.3 kpc and λ RM = 6.7 ± 0.7 kpc. For θ = 45 ◦ , it was<br />
calculated B = 7.3 ± 0.2 µG, λ B = 2.8 ± 0.2 kpc and λ RM = 5.2 ± 0.5 kpc. The<br />
value <strong>of</strong> the log likelihood ln L was determined to be slightly higher for the inclination<br />
angle <strong>of</strong> θ = 30 ◦ . The flattening <strong>of</strong> the power spectra for large k’s can be explained by


