Correlation and Causality between Stock Market and Macro ... - ipedr
Correlation and Causality between Stock Market and Macro ... - ipedr
Correlation and Causality between Stock Market and Macro ... - ipedr

You also want an ePaper? Increase the reach of your titles
YUMPU automatically turns print PDFs into web optimized ePapers that Google loves.
2010 International Conference on E-business, Management <strong>and</strong> Economics<br />
IPEDR vol.3 (2011) © (2011) IACSIT Press, Hong Kong<br />
<strong>Correlation</strong> <strong>and</strong> <strong>Causality</strong> <strong>between</strong> <strong>Stock</strong> <strong>Market</strong> <strong>and</strong> <strong>Macro</strong> Economic Variables in<br />
India: An Empirical Study<br />
Naresh Ch<strong>and</strong>ra Sahu<br />
Assistant Professor, Department of Humanities, Social<br />
Sciences & Management (HSSM), Indian Institute of<br />
Technology Bhubaneswar, SamantaPuri, Bhubaneswar-<br />
751013, Odisha ,India Email: ncs7676@gmail.com<br />
Deepinder H. Dhiman<br />
Research Scholar, School of Management <strong>and</strong> Social<br />
sciences, Thapar University, Patiala<br />
Email: deepinderlotey@gmail.com<br />
Abstract—: In this paper, an attempt has been made to explore<br />
the causal relationship <strong>between</strong> stock market indicators <strong>and</strong><br />
macro economic variables of India by using both correlation<br />
<strong>and</strong> Ganger <strong>Causality</strong> Regression techniques. Annual data has<br />
been used from 1981 to 2006 for all the above said variables to<br />
study the relationship. Augmented Dickey Fuller Unit Root<br />
Test has been done to check the stationary of the series. The<br />
findings of our study reveal that there is no causal relationship<br />
<strong>between</strong> stock market indicator i.e. sensex of Bombay stock<br />
exchange(BSE) <strong>and</strong> real gross domestic product of India<br />
despite they being highly co related. Therefore it is concluded<br />
in this paper that BSE SENSEX cannot yet be called as an<br />
“indicator” of India’s growth <strong>and</strong> development.<br />
Keywords- Bombay <strong>Stock</strong> Exchange( BSE), Stationary,<br />
Granger <strong>Causality</strong>, India<br />
I. INTRODUCTION<br />
India pursued its liberalization policy in the early 1990s<br />
to get rid of crisis emanated from its foreign exchange front.<br />
One of the important components of the liberalization policy<br />
measures was financial liberalization. This financial<br />
liberalization paved a new way of growth <strong>and</strong> development<br />
<strong>and</strong> volatile atmosphere to the Indian economy especially in<br />
terms of BSE SENSEX which is credited as one of the main<br />
indicators of India’s financial health as stock market is the<br />
prime most source for mobilizing household savings into<br />
upcoming productive ventures <strong>and</strong> hence lending a helping<br />
h<strong>and</strong> in the country’s development.<br />
The issue that has been focused upon in this paper is that<br />
does <strong>Stock</strong> <strong>Market</strong> really paving the way for country’s<br />
development or putting into economics terminology: does<br />
any causal relationship exists <strong>between</strong> the stock market <strong>and</strong><br />
real economy or is it just a myth.<br />
The variables that have been taken up in this study are<br />
Bombay stock exchange(BSE) sensitive index ( SENSEX),<br />
market capitalization(MCap) representing stock market, <strong>and</strong><br />
real gross domestic product(GDP) <strong>and</strong> foreign exchange<br />
reserves (Forex)depicting real economic growth. This issue<br />
has been taken up in this study because BSE SENSEX has<br />
witnessed a remarkable growth <strong>and</strong> then fall in the past two<br />
decades <strong>and</strong> attracted great media attention but lesser<br />
academic interest.<br />
II. REVIEW OF EXISTING LITERATURE<br />
Finance is the buzz word all around the world. It is the<br />
one which makes the business go around <strong>and</strong> all aspects of<br />
the economy start <strong>and</strong> end at it. In today’s competitive world<br />
the easiest way to raise capital for new upcoming <strong>and</strong><br />
promising ventures is to go public or turn towards masses<br />
through <strong>Stock</strong> <strong>Market</strong>s where small savings of these people<br />
can make miracles by investing wisely in reliable businesses<br />
<strong>and</strong> help management of these companies to make them<br />
biggest companies in the world. In India, only about 2% of<br />
the total population is involved in these markets but it is<br />
100% of the population which gets affected directly or<br />
indirectly if something happens in these markets, which in<br />
itself shows a strong correlation <strong>between</strong> <strong>Stock</strong> <strong>Market</strong>s <strong>and</strong><br />
Real Economy not just on the surface level but deep inside<br />
also they are interlinked. Many scholars have done research<br />
in this direction but results are usually ambiguous as many<br />
have found a strong bilateral relation <strong>between</strong> the two but on<br />
the other h<strong>and</strong> many studies have completely discarded this<br />
hypothesis that these markets are correlated from time to<br />
time. In this section, we have reviewed some existing<br />
literature pertaining to the above mentioned issues. The over<br />
all findings of different scholar s related to these issues are<br />
discussed briefly below. Shiller, R. (1990) had studied <strong>and</strong><br />
compared the St<strong>and</strong>ard & Poor Composite <strong>Stock</strong> Price Index<br />
from 1871 to January 2000 with the corresponding series of<br />
real S&P Composite earnings for the same years <strong>and</strong> found<br />
that stock price volatility is not matched by the earnings. In<br />
another study, Chowhan, P.K. et al. (2000) have tried to<br />
fetch reasons for turbulence in stock market in the short run<br />
in India taking into account SENSEX as the main index. The<br />
results of this study reveal that long run economic factors<br />
don’t support such a spike in stock prices. In another study,<br />
Nath, G.C., et al. (2004) in their paper examine the extent of<br />
integration <strong>between</strong> Foreign Exchange <strong>and</strong> <strong>Stock</strong> market in<br />
India during the liberalization era. The results that they have<br />
derived from these techniques differ a lot. As per the former<br />
test it reveals the sign mild-to-strong causal relationship<br />
<strong>between</strong> returns in foreign exchange <strong>and</strong> capital markets<br />
during the study period. Whereas as per the latter test, there<br />
is a high degree of integration <strong>between</strong> the two <strong>and</strong> there is<br />
even bi-directional as well as contemporaneous causal<br />
relationship <strong>between</strong> them.<br />
Brenner, M., et al. (2006) have concluded that the macro<br />
economic announcements have significant impact on the US<br />
281
financial markets, but also that this impact varies greatly<br />
across asset classes. In another study, Husain, F. (2006) has<br />
examined the causal relationship <strong>between</strong> stock price <strong>and</strong><br />
real sector variables of Pakistan economy. He has found<br />
unidirectional causality from real sector to stock prices. In<br />
case of India, Sarkar, P. et al. (2005) found that there is no<br />
positive relationship exists <strong>between</strong> real <strong>and</strong> stock market<br />
variables either in short run or long run during 1950-51 to<br />
2005.<br />
III. DATA AND METHODOLOGY<br />
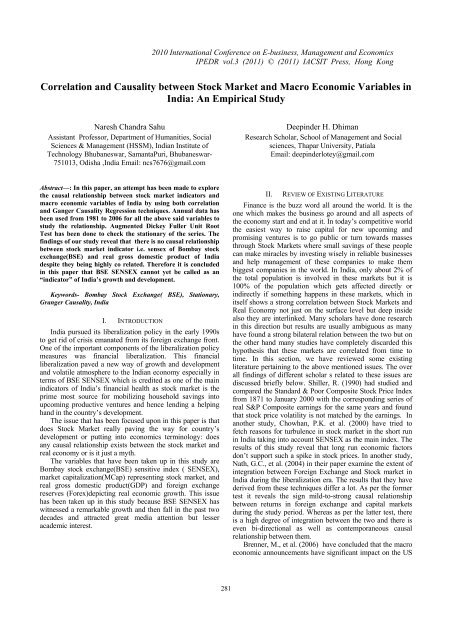
The annual data from 1979-80 to 2007-08 has been used<br />
in our study to investigate the correlation <strong>and</strong> causal<br />
relationship <strong>between</strong> stock market <strong>and</strong> macro economic<br />
variables of India. We have taken the macro economic<br />
variables such as GDP at factor cost <strong>and</strong> Forex Reserves<br />
from Major <strong>Macro</strong> Economic Variables <strong>and</strong> BSE SENSEX<br />
<strong>and</strong> <strong>Market</strong> Capitalization data from Financial Statistics<br />
maintained by Reserve Bank of India (RBI).<br />
In our study an easy <strong>and</strong> fast way to show the relation<br />
<strong>between</strong> the said variables is to calculate the correlations<br />
<strong>between</strong> the two. Hence we have calculated <strong>and</strong> found a high<br />
degree of correlation <strong>between</strong> the two types of variables. The<br />
formal investigation has started with examining the<br />
stochastic properties of the variables used in the analysis. So,<br />
we have performed the Augmented Dickey Fuller (ADF)<br />
Unit Root Test on the series to test the stationarity. Next, we<br />
have applied Engle-Granger Test to test the causality<br />
<strong>between</strong> them but no significant causal relations were found<br />
<strong>between</strong> SENSEX <strong>and</strong> GDP.<br />
In our study, we have used Granger (1969) causality<br />
model to test the causality <strong>between</strong> <strong>Stock</strong> market variables<br />
<strong>and</strong> <strong>Macro</strong> economic variables. The following is the model<br />
adopted in our model to empirically examine the above said<br />
hypothesis. Let’s start by defining Granger’s concept of<br />
causality. X is said to be Granger cause Y if Y can be<br />
predicted with greater accuracy by using past values of X.<br />
Consider the following equation:<br />
Y t = α 0 + α 1 Y t-1 + α 2 Y t-2 + β 1 X t-1 +β 2 X t-2 + u t<br />
If β 1 = β 2 = 0, X does not Granger cause Y. If, on the<br />
other h<strong>and</strong>, any of the β coefficients is non-zero, then X does<br />
Granger cause Y. The null hypothesis that β 1 = β 2 = 0 can be<br />
tested by using the st<strong>and</strong>ard F-test of joint significance. Note<br />
that it has been taken two period lags in the above equation.<br />
In practice, the choice of the lag is arbitrary. Varying the lag<br />
length may lead to different result. As a practical guide, one<br />
can include as many as are necessary to ensure non-auto<br />
correlated residuals.<br />
To estimate our Granger causality, we have made<br />
stationary test of the variables concerned by using<br />
Augmented Dickey-Fuller test. If the variables don’t have<br />
unit root problem then Granger can be estimated by method<br />
found mixed results about the causality <strong>between</strong> stock<br />
market <strong>and</strong> growth variables. In our paper the test of<br />
stationarity of the time series of the above mentioned<br />
variables are systematically done in order to rule out the<br />
likely spurious results. In order to estimate that we have used<br />
the popular Augmented Dickey-Fuller (1979) tests. Consider<br />
here two variables such as X <strong>and</strong> Y for methodological<br />
discussion relating to the study. If the calculated Augmented<br />
Dickey-Fuller (ADF) statistics is less than its critical value,<br />
then X is said to be stationary or integrated to order zero, i.e.,<br />
I (0). If this is not the case, then the ADF test is performed<br />
on the first difference of X (i.e., ΔX). If ΔX is found to<br />
stationary then X is integrated order one i.e., I (1). If two<br />
variables X <strong>and</strong> Y are both integrated to order one I (1), then<br />
the next step is to find out whether they are co integrated.<br />
This can be done by using Johansen’s co-integration<br />
approach. If the two variables are not co-integrated then the<br />
best approach is to find out the causality <strong>between</strong> them by<br />
using st<strong>and</strong>ard Granger test, which only establishes short run<br />
relationship. In practice, however, a number of econometrics<br />
packages can be used to perform these tests which also give<br />
the critical values of the ADF statistic. To discuss the ADF<br />
Test we have to estimate the equation:<br />
y t = γ + δ t + αy t-1 + ∑ θ f ∆y t-1 + e t<br />
here ε t is not white noise as in previous Dickey Fuller<br />
Tests. The purpose in adding the terms ∆y t-1 is to allow for<br />
ARMA error processes. But if the MA parameter is large, the<br />
AR approximation would be poor unless k is large.<br />
After estimating this augmented equation, the tests K(1),<br />
t(1), <strong>and</strong> F(0,1) are used.<br />
IV. ESTIMATION AND ANALYSIS<br />
One can very well point out the volatility in SENSEX by<br />
looking at the Figure1 which shows the trend of SENSEX<br />
growth over past three decades. One can easily make out<br />
from here that how SENSEX has grown tremendously<br />
especially after economic liberalization period. Even the<br />
market capitalization of SENSEX which is nothing but total<br />
market value of shares traded in the market also follows a<br />
similar trend as SENSEX over the period as it starts rising in<br />
early 1990s but have an exploded growth 2003-04 onwards .<br />
The trend is shown in Figure.2. Figure 3 indicates that real<br />
economic factors like GDP has grown steadily over the<br />
period of time with not much erratic movements in <strong>between</strong><br />
but an exponential growth is noticed after the economic<br />
reforms <strong>and</strong> more after 2000-2001. Figure 4 reveals that<br />
India’s foreign exchange reserves which were the ones which<br />
had fallen tremendously in 1990-91 <strong>and</strong> had pulled the final<br />
chain of problems had shown a great recovery after that <strong>and</strong><br />
now it is in ample reserves.<br />
In order to find out the relationship <strong>between</strong> stock<br />
exchange indicators <strong>and</strong> economic variables we have first<br />
estimated correlation matrices. The results are presented in<br />
the Table.1<br />
The correlation matrix result shows that all the variables<br />
undertaken in this study show a very high degree of<br />
correlation with each other, depicting that there is certainly<br />
some relation <strong>between</strong> stock market <strong>and</strong> real economy which<br />
needs to be studied in detail. The next step is to determine<br />
whether the series are stationary or not. The results of the<br />
unit root test is provided in the Table 2. Perusal of the Table<br />
2 reveals that GDP, <strong>Market</strong> Capitalization <strong>and</strong> Foreign<br />
exchange Reserves are stationary at 5% <strong>and</strong> 1% level of<br />
significance. The results of the granger casulity test have<br />
282
een provided in the Table.3. Results of the Grange<br />
<strong>Causality</strong> test reveals that there is not causal relationship<br />
<strong>between</strong> sensitive index number <strong>and</strong> real GDp of India<br />
during above said time period. In addition, the findings of<br />
the Grange <strong>Causality</strong> test reveals that <strong>Market</strong> Capitalization<br />
Granger causes GDP; <strong>and</strong> Foreign exchange reserves also<br />
Granger causes GDP. Hence in real economy <strong>Market</strong><br />
Capitalization <strong>and</strong> Foreign exchange reserves play an<br />
important role in growth of GDP of India. And also MCap<br />
Granger causes BSE sensex , thus indicating that MCap<br />
plays a very important role not just in <strong>Stock</strong> <strong>Market</strong><br />
development but also in real economy.<br />
V. CONCLUSION AND POLICY IMPLICATIONS<br />
The purpose of this study is to find out the causality, if<br />
any, <strong>between</strong> <strong>Stock</strong> market <strong>and</strong> real economic variables.<br />
Although there is a strong correlation <strong>between</strong> the two <strong>and</strong><br />
other descriptive statistics indicate a much higher expansion<br />
in stock market variables than real economic variables, i.e.,<br />
stock market boom is not much supported by real economy.<br />
Hence the basic conclusion that comes out is that<br />
although these variables are moving in the same direction but<br />
are not fundamentally caused by each other. There is not<br />
causality <strong>between</strong> stock exchange indicator i.e., sensex <strong>and</strong><br />
real GDP in India. In other words, it can be said that <strong>Stock</strong><br />
market in India has not yet become strong enough to<br />
influence the Real economy mainly because just 2% of<br />
Indian population is involved in <strong>Stock</strong> <strong>Market</strong> businesses or<br />
investments. But as they are moving in the same direction<br />
means that there is surely some other exogenous variable(s)<br />
which influence them together. As concluded that MCap<br />
causes GDP, hence when the valuation of shares of the<br />
companies traded in the stock market increases they have a<br />
positive impact on the GDP of the country. Similarly Forex<br />
reserves also causes GDP in a positive manner, <strong>and</strong> the point<br />
worth noticing is that major chunk of this Foreign exchange<br />
reserves comes from foreign institutional investments(FIIs)<br />
in form of FPIs <strong>and</strong> FDIs mainly into <strong>Stock</strong> <strong>Market</strong> only,<br />
thus again giving a further topic of research of structure of<br />
these Foreign exchange reserves.<br />
REFERENCES<br />
[1] Amadou, N.R.S. “Capital Account Convertibility <strong>and</strong> Risk<br />
Management in India”. IMF Working Paper 97. 4-12, 2007.<br />
[2] Beck, T.; Levine, R. “<strong>Stock</strong> <strong>Market</strong>s, Banks <strong>and</strong> Growth: <strong>Correlation</strong><br />
or <strong>Causality</strong>”. SSRN, 2001.<br />
[3] Black, A. et al. “US <strong>Stock</strong> Prices <strong>and</strong> <strong>Macro</strong> Economic<br />
Fundamentals”. Aberdeen Working Papers. Pp.1-3, 2001.<br />
[4] Chauvet. M. “<strong>Stock</strong> <strong>Market</strong> Fluctuations <strong>and</strong> Business Cycle”,<br />
SSRR,1999.<br />
[5] Demirguc-Kunt, A. “<strong>Stock</strong> <strong>Market</strong> Development <strong>and</strong> Financial<br />
Intermediaries”. Policy Research Working Paper 14. 1-64, 1995.<br />
[6] Figlewski, S. “Forecasting Volatility”. Financial <strong>Market</strong>s, Instruments<br />
<strong>and</strong> Institutions 6 .1-88, 2001.<br />
[7] Husain, F. “<strong>Stock</strong> Prices, Real Sector <strong>and</strong> the Causal Analysis:The<br />
Case of Pakitan”. Journal of Management <strong>and</strong> Social Sciences.2.179-<br />
185, 2006.<br />
[8] Jha, R. “Inflation Targeting in India: Issues <strong>and</strong> Prospects”. Research<br />
School of Pacific <strong>and</strong> Studies Journal 02. 28-68, 1996.<br />
[9] Kanakaraj, A.; Singh, B.K.; Alex, D. “<strong>Stock</strong> Prices, Micro Reasons<br />
<strong>and</strong> <strong>Macro</strong> Economy in India: What do data say <strong>between</strong> 1997-2007”.<br />
Fox Working Paper 3. 1-17, 2008.<br />
[10] Kakani, R.K.; Chatterjee, T. “An Alternate Perspective on the Bull<br />
Run in Indian <strong>Market</strong>s”. SPJ Centre of Management working paper 7.<br />
1-13, 2007.<br />
[11] Levine, R.; Loayza, N.; Beck, T.; “Financial Intermediation <strong>and</strong><br />
Growth: <strong>Causality</strong> <strong>and</strong> Causes”. SSRN., 1998.<br />
[12] Nath, G.C.; Samanta, G.P. “Integration <strong>between</strong> FOREX <strong>and</strong> Capital<br />
<strong>Market</strong>s in India: An Empirical Exploration”. Applied Financial<br />
Economics 7. 25-35., 2000.<br />
[13] Sarkar, S.; Sarkar, T. “Reforming Financial <strong>Market</strong>s in India: a<br />
Strategic Approach”. SSRN. 960532. 1-17, 2005.<br />
[14] Vatnick, S. 2008. “Financial Reforms <strong>and</strong> Emerging <strong>Market</strong>s”.<br />
Financial <strong>Market</strong>s, Instruments <strong>and</strong> Institutions 17. 109-120, 2008<br />
18000<br />
16000<br />
14000<br />
12000<br />
10000<br />
8000<br />
6000<br />
4000<br />
2000<br />
0<br />
SENSEX Value<br />
6000000<br />
5000000<br />
4000000<br />
3000000<br />
2000000<br />
1000000<br />
BSE SENSEX<br />
1979-80<br />
1981-82<br />
1983-84<br />
1985-86<br />
1987-88<br />
1989-90<br />
1991-92<br />
1993-94<br />
1995-96<br />
1997-98<br />
1999-00<br />
2001-02<br />
2003-04<br />
2005-06<br />
2007-08<br />
Years<br />
Figure 1. Growth of SENSEX ( 1979-80 to 2007-08)<br />
0<br />
Figure 2.<br />
BSE …<br />
MARKET CAPITALISATION OF SENSEX<br />
Growth of <strong>Market</strong> Capitalization of SENSEX<br />
MARKET<br />
CAPITALIS…<br />
283
TABLE II.<br />
ADF TEST<br />
GDP AT FACTOR COST(CONSTANT PRICE)<br />
Variables<br />
ADF<br />
3500000<br />
3000000<br />
GDP(-1)<br />
3.592278**<br />
2500000<br />
2000000<br />
1500000<br />
1000000<br />
500000<br />
0<br />
GDP AT FACTOR<br />
COST(CONSTANT …<br />
Forex(-1)<br />
BSE(-1)<br />
MCap(-1)<br />
4.732852*<br />
0.060694<br />
3.190342**<br />
Figure 3. Growth of GDP (1979-80 to 2006-2007)<br />
FOREX RESERVES<br />
1400000<br />
1200000<br />
1000000<br />
800000<br />
600000<br />
400000<br />
200000<br />
0<br />
1979-80<br />
1981-82<br />
1983-84<br />
1985-86<br />
1987-88<br />
1989-90<br />
1991-92<br />
1993-94<br />
1995-96<br />
1997-98<br />
1999-00<br />
2001-02<br />
2003-04<br />
2005-06<br />
2007-08<br />
Figure 4. Growth of Forex Reserves<br />
FOREX …<br />
Note: *, ** depicts significant at 1% <strong>and</strong> 5% levels<br />
respectively<br />
TABLE III.<br />
Direction of <strong>Causality</strong><br />
GRANGER CAUSALITY TEST<br />
F-Statistic<br />
GDP causes MCap 0.00230<br />
MCap causes GDP 4.70614**<br />
BSE causes GDP 0.84272<br />
GDP causes BSE 1.18311<br />
GDP causes Forex 1.67954<br />
Forex causes GDP 16.4609*<br />
BSE causes MCap 0.98580<br />
MCap causes BSE 4.83504**<br />
Note: *, ** represent significance at 1% <strong>and</strong> 5% level<br />
respectively.<br />
TABLE I.<br />
CORRELATION MATRIX<br />
Variables<br />
BSE FOREX GDP MCap<br />
BSE 1 0.897854 0.919391 0.961845<br />
FOREX 0.897854 1 0.921359 0.917111<br />
GDP 0.919391 0.921359 1 0.873695<br />
MCap 0.961845 0.917111 0.873695 1<br />
4<br />
284