Graphs in XKCD style
Graphs in XKCD style
Graphs in XKCD style

You also want an ePaper? Increase the reach of your titles
YUMPU automatically turns print PDFs into web optimized ePapers that Google loves.
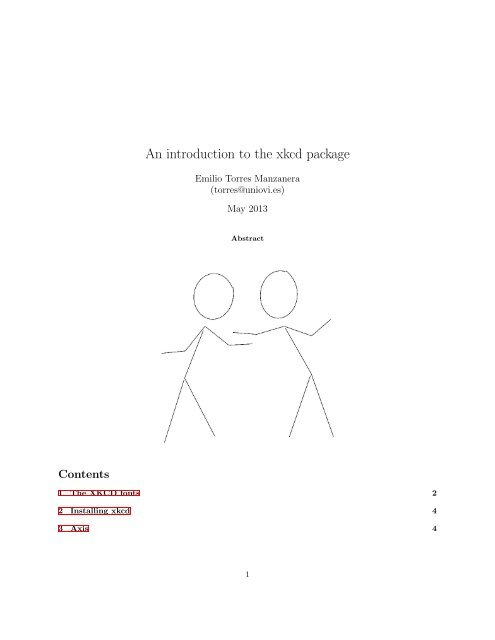
An <strong>in</strong>troduction to the xkcd package<br />
Emilio Torres Manzanera<br />
(torres@uniovi.es)<br />
May 2013<br />
Abstract<br />
Contents<br />
1 The <strong>XKCD</strong> fonts 2<br />
2 Install<strong>in</strong>g xkcd 4<br />
3 Axis 4<br />
1
4 Cartoon characters 5<br />
4.1 Facets . . . . . . . . . . . . . . . . . . . . . . . . . . . . . . . . . . . . . . . . . . . . . . . . . 6<br />
4.2 Angles of the xkcdman . . . . . . . . . . . . . . . . . . . . . . . . . . . . . . . . . . . . . . . . 8<br />
5 Mother’s day 8<br />
5.1 Bar chart . . . . . . . . . . . . . . . . . . . . . . . . . . . . . . . . . . . . . . . . . . . . . . . 8<br />
6 Volunteers at Cáritas Spa<strong>in</strong> 10<br />
6.1 Scatterplot . . . . . . . . . . . . . . . . . . . . . . . . . . . . . . . . . . . . . . . . . . . . . . 10<br />
6.2 Bar chart . . . . . . . . . . . . . . . . . . . . . . . . . . . . . . . . . . . . . . . . . . . . . . . 12<br />
6.3 Bar chart . . . . . . . . . . . . . . . . . . . . . . . . . . . . . . . . . . . . . . . . . . . . . . . 13<br />
7 Sav<strong>in</strong>g the graphs 15<br />
7.1 png . . . . . . . . . . . . . . . . . . . . . . . . . . . . . . . . . . . . . . . . . . . . . . . . . . . 15<br />
7.2 pdf . . . . . . . . . . . . . . . . . . . . . . . . . . . . . . . . . . . . . . . . . . . . . . . . . . . 15<br />
8 References 15<br />
1 The <strong>XKCD</strong> fonts<br />
The package xkcd uses the <strong>XKCD</strong> fonts. Therefore, an easy way to check whether this fonts are <strong>in</strong>stalled <strong>in</strong><br />
the computer is typ<strong>in</strong>g the follow<strong>in</strong>g code and compar<strong>in</strong>g the graphs:<br />
> library(extrafont)<br />
> library(ggplot2)<br />
> if( "xkcd" %<strong>in</strong>% fonts()) {<br />
p
Install<strong>in</strong>g fonts <strong>in</strong> R<br />
If the <strong>XKCD</strong> fonts, or other fonts, are not <strong>in</strong>stalled <strong>in</strong> the system, you may follow the tutorial Change fonts<br />
<strong>in</strong> ggplot2, and create xkcd <strong>style</strong> graphs to <strong>in</strong>stall them.<br />
Or read the documentation of the package extrafont, with detailed <strong>in</strong>structions <strong>in</strong> https://github.<br />
com/wch/extrafont:<br />
❼ Option I:<br />
> ## Borrowed from<br />
> ## fibosworld 2013. Change fonts <strong>in</strong> ggplot2, and create xkcd <strong>style</strong> graphs<br />
> library(extrafont)<br />
> if(! "xkcd" %<strong>in</strong>% fonts()) {<br />
xkcdFontURL library(extrafont)<br />
> download.file("http://simonsoftware.se/other/xkcd.ttf", dest="xkcd.ttf")<br />
> system("mkdir ~/.fonts")<br />
> system("cp xkcd.tff -t ~/.fonts")<br />
3
library(extrafont)<br />
> font_import()<br />
> loadfonts()<br />
If you want to un<strong>in</strong>stall the fonts, you may remove the follow<strong>in</strong>g packages:<br />
> remove.packages(c("extrafonts","extrafontdb"))<br />
2 Install<strong>in</strong>g xkcd<br />
The xkcd homepage is located at http://xkcd.r-forge.r-project.org. From with<strong>in</strong> R, you can <strong>in</strong>stall<br />
the latest version of xkcd by typ<strong>in</strong>g<br />
> <strong>in</strong>stall.packages("xkcd",dependencies = TRUE)<br />
Then, you may want to see the vignette and check the code:<br />
> help(package="xkcd")<br />
> vignette("xkcd-<strong>in</strong>tro") # it opens the pdf<br />
> browseVignettes(package = "xkcd") # To browse the pdf, R and Rnw<br />
Once the package has been <strong>in</strong>stalled, it can be loaded by typ<strong>in</strong>g:<br />
> library(xkcd)<br />
3 Axis<br />
Man: No, I just th<strong>in</strong>k I can do better than someone who doesn’t label her axes. Title text: And if you<br />
labeled your axes, I could tell you exactly how MUCH better. http://xkcd.com/833/ http://imgs.xkcd.com/comics/conv<strong>in</strong>c<strong>in</strong>g.png<br />
> xrange yrange set.seed(123) # for reproducibility<br />
> p p<br />
4
4 Cartoon characters<br />
To <strong>in</strong>clude cartoon characters <strong>in</strong> the graph, use the xkcdman function.<br />
> ratioxy mapp<strong>in</strong>g dataman
angleleftradius = c(pi/3, -pi/3),<br />
anglerightleg = 3*pi/2 - pi / 12,<br />
angleleftleg = 3*pi/2 + pi / 12 ,<br />
angleofneck = runif(1, 3*pi/2-pi/10, 3*pi/2+pi/10),<br />
city=c("Liliput","Brobd<strong>in</strong>gnag"))<br />
> q q<br />
4.1 Facets<br />
> ggplot() + geom_po<strong>in</strong>t(aes(mpg, wt), data=mtcars) +<br />
xkcdaxis(xrange,yrange) + xkcdman(mapp<strong>in</strong>g, dataman) +<br />
facet_grid(.~vs)<br />
6
ggplot() + geom_po<strong>in</strong>t(aes(mpg, wt), data=mtcars) +<br />
xkcdaxis(xrange,yrange) + xkcdman(mapp<strong>in</strong>g, dataman) +<br />
facet_grid(.~city)<br />
7
4.2 Angles of the xkcdman<br />
5 Mother’s day<br />
5.1 Bar chart<br />
> mommy names(mommy)
data data$xm<strong>in</strong> data$xmax data$ym<strong>in</strong> data$ymax xrange yrange ratioxy timelabel
size=sizer,alpha=0.3) +<br />
xkcdaxis(xrange,yrange) +<br />
annotate("text", x=16, y = 650,<br />
label="Happy Mother✬s day", size = 16) +<br />
xlab("daily schedule") +<br />
ylab("Number of times mothers are called on by their children") +<br />
timelabel("Wake up", 9, 125) + timelabel("School", 12.5, 90) +<br />
timelabel("Lunch", 15, 130) +<br />
timelabel("Homework", 18, 525) +<br />
timelabel("Bath", 21, 110) +<br />
timelabel("zzz", 23.5, 60)}<br />
> p<br />
><br />
6 Volunteers at Cáritas Spa<strong>in</strong><br />
6.1 Scatterplot<br />
> volunteers xrange yrange ratioxy mapp<strong>in</strong>g
atioxy,<br />
angleofsp<strong>in</strong>e ,<br />
anglerighthumerus,<br />
anglelefthumerus,<br />
anglerightradius,<br />
angleleftradius,<br />
anglerightleg,<br />
angleleftleg,<br />
angleofneck)<br />
> dataman datal<strong>in</strong>es p if( "xkcd" %<strong>in</strong>% fonts()) {<br />
p + xkcdaxis(xrange,yrange) +<br />
ylab("Volunteers at Caritas Spa<strong>in</strong>") +<br />
xkcdman(mapp<strong>in</strong>g, dataman) +<br />
annotate("text", x=2008.7, y = 63700, label = "We Need\nVolunteers!", family="xkcd" ) +<br />
annotate("text", x=2010.5, y = 60000, label = "Sure\nI can!", family="xkcd" ) +<br />
xkcdl<strong>in</strong>e(aes(xbeg<strong>in</strong>=xbeg<strong>in</strong>,ybeg<strong>in</strong>=ybeg<strong>in</strong>,xend=xend,yend=yend),datal<strong>in</strong>es, xjitteramount = 0.12)<br />
} else {<br />
p + xkcdaxis(xrange,yrange) +<br />
ylab("Volunteers at Caritas Spa<strong>in</strong>") +<br />
xkcdman(mapp<strong>in</strong>g, dataman) +<br />
annotate("text", x=2008.7, y = 63700, label = "We Need\nVolunteers!") +<br />
annotate("text", x=2010.5, y = 60000, label = "Sure\nI can!") +<br />
xkcdl<strong>in</strong>e(aes(xbeg<strong>in</strong>=xbeg<strong>in</strong>,ybeg<strong>in</strong>=ybeg<strong>in</strong>,xend=xend,yend=yend),datal<strong>in</strong>es, xjitteramount = 0.12)<br />
}<br />
11
6.2 Bar chart<br />
> data data$xm<strong>in</strong> data$xmax data$ym<strong>in</strong> data$ymax xrange yrange mapp<strong>in</strong>g p p<br />
12
6.3 Bar chart<br />
> data data$xm<strong>in</strong> data$xmax data$ym<strong>in</strong> data$ymax xrange yrange ratioxy plotmen
y=y,<br />
scale = scale,<br />
ratioxy = ratioxy,<br />
angleofsp<strong>in</strong>e = runif(n, - pi/2 - pi/3, -pi/2 + pi/3),<br />
anglerighthumerus = runif(n, -pi/6- pi/10, - pi/6 + pi/10),<br />
anglelefthumerus = runif(n, pi + pi/6 -pi/10, pi + pi/6 + pi/10),<br />
anglerightradius = runif(n, -pi/4, pi/4),<br />
angleleftradius = runif(n, pi -pi/4, pi + pi/4),<br />
anglerightleg = runif(n, 3* pi/2 + pi/12 , 3* pi/2 + pi/12 + pi/10),<br />
angleleftleg = runif(n, 3* pi/2 - pi/12 - pi/10, 3* pi/2 - pi/12 ),<br />
angleofneck = runif(n, -pi/2-pi/10, -pi/2 + pi/10))<br />
xkcdman(mapp<strong>in</strong>g,data,...)<br />
}<br />
> volun positionx set.seed(123)<br />
> positionx positiony a b if( "xkcd" %<strong>in</strong>% fonts()) {<br />
c
7 Sav<strong>in</strong>g the graphs<br />
7.1 png<br />
> png("myfigure.png")<br />
> pr<strong>in</strong>t(p)<br />
> dev.off()<br />
7.2 pdf<br />
Remember to embed the fonts!<br />
> ## Borrowed from<br />
> ## fibosworld 2013. Change fonts <strong>in</strong> ggplot2, and create xkcd <strong>style</strong> graphs<br />
> ## \url{http://fibosworld.wordpress.com/2013/02/17/change-fonts-<strong>in</strong>-ggplot2-and-create-xkcd-<strong>style</strong>-graph<br />
><br />
> ggsave("font_ggplot.pdf", plot=p, width=12, height=4)<br />
> ## needed for W<strong>in</strong>dows - make sure YOU have the correct path for your mach<strong>in</strong>e:<br />
> ## Sys.setenv(R_GSCMD = "C:\\Program Files (x86)\\gs\\gs9.06\\b<strong>in</strong>\\gsw<strong>in</strong>32c.exe")<br />
> embed_fonts("font_ggplot.pdf")<br />
8 References<br />
Hadley Wickham 2012. ggplot2 http://ggplot2.org/<br />
15
Randall Munroe. A webcomic of romance, sarcasm, math, and language http://xkcd.com/<br />
VariousAuthors2012. Howcanwemakexkcd<strong>style</strong>graphs<strong>in</strong>R?http://stackoverflow.com/questions/<br />
12675147/how-can-we-make-xkcd-<strong>style</strong>-graphs-<strong>in</strong>-r<br />
fibosworld 2013. Change fonts <strong>in</strong> ggplot2, and create xkcd <strong>style</strong> graphs http://fibosworld.wordpress.<br />
com/2013/02/17/change-fonts-<strong>in</strong>-ggplot2-and-create-xkcd-<strong>style</strong>-graphs/<br />
W<strong>in</strong>ston Chang. extrafont https://github.com/wch/extrafont<br />
16