Download File (6.3M) - Fraser - Federal Reserve Bank of St. Louis
Download File (6.3M) - Fraser - Federal Reserve Bank of St. Louis
Download File (6.3M) - Fraser - Federal Reserve Bank of St. Louis

You also want an ePaper? Increase the reach of your titles
YUMPU automatically turns print PDFs into web optimized ePapers that Google loves.
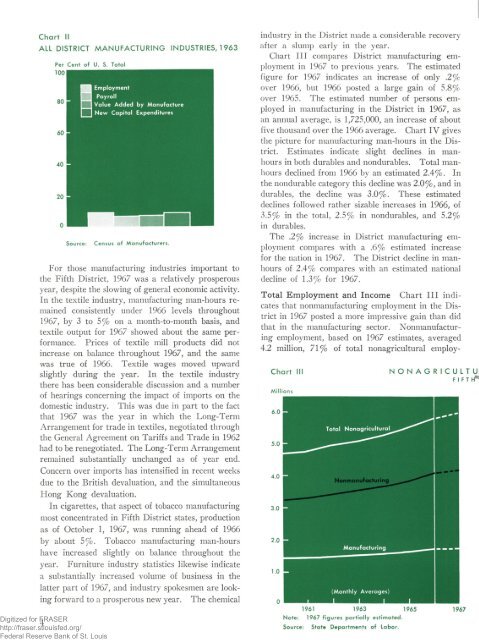
Chart II<br />
ALL DISTRICT MANUFACTURING INDUSTRIES, 1963<br />
Per Cent <strong>of</strong> U. S. Total<br />
Source:<br />
Census <strong>of</strong> Manufacturers.<br />
For those manufacturing industries important to<br />
the Fifth District, 1967 was a relatively prosperous<br />
year, despite the slowing <strong>of</strong> general economic activity.<br />
In the textile industry, manufacturing man-hours remained<br />
consistently under 1966 levels throughout<br />
1967, by 3 to 5% on a month-to-month basis, and<br />
textile output for 1967 showed about the same performance.<br />
Prices <strong>of</strong> textile mill products did not<br />
increase on balance throughout 1967, and the same<br />
was true <strong>of</strong> 1966. Textile wages moved upward<br />
slightly during the year. In the textile industry<br />
there has been considerable discussion and a number<br />
<strong>of</strong> hearings concerning the impact <strong>of</strong> imports on the<br />
domestic industry. This was due in part to the fact<br />
that 1967 was the year in which the Long-Term<br />
Arrangement for trade in textiles, negotiated through<br />
the General Agreement on Tariffs and Trade in 1962<br />
had to be renegotiated. The Long-Term Arrangement<br />
remained substantially unchanged as <strong>of</strong> year end.<br />
Concern over imports has intensified in recent weeks<br />
due to the British devaluation, and the simultaneous<br />
Hong Kong devaluation.<br />
In cigarettes, that aspect <strong>of</strong> tobacco manufacturing<br />
most concentrated in Fifth District states, production<br />
as <strong>of</strong> October 1, 1967, was running ahead <strong>of</strong> 1966<br />
by about 5% .<br />
Tobacco manufacturing man-hours<br />
have increased slightly on balance throughout the<br />
year.<br />
Furniture industry statistics likewise indicate<br />
a substantially increased volume <strong>of</strong> business in the<br />
latter part <strong>of</strong> 1967, and industry spokesmen are looking<br />
forward to a prosperous new year.<br />
Digitized for FRASER<br />
http://fraser.stlouisfed.org/<br />
<strong>Federal</strong> <strong>Reserve</strong> <strong>Bank</strong> <strong>of</strong> <strong>St</strong>. <strong>Louis</strong><br />
The chemical<br />
industry in the District made a considerable recovery<br />
after a slump early in the year.<br />
Chart III compares District manufacturing employment<br />
in 1967 to previous years. The estimated<br />
figure for 1967 indicates an increase <strong>of</strong> only .2%<br />
over 1966, but 1966 posted a large gain <strong>of</strong> 5.8%<br />
over 1965. The estimated number <strong>of</strong> persons employed<br />
in manufacturing in the District in 1967, as<br />
an annual average, is 1,725,000, an increase <strong>of</strong> about<br />
five thousand over the 1966 average. Chart IV gives<br />
the picture for manufacturing man-hours in the District.<br />
Estimates indicate slight declines in manhours<br />
in both durables and nondurables. Total manhours<br />
declined from 1966 by an estimated 2.4% . In<br />
the nondurable category this decline was 2.0% , and in<br />
durables, the decline was 3.0% . These estimated<br />
declines followed rather sizable increases in 1966, <strong>of</strong><br />
3.5% in the total, 2.5% in nondurables, and 5.2%<br />
in durables.<br />
The .2% increase in District manufacturing employment<br />
compares with a .6% estimated increase<br />
for the nation in 1967. The District decline in manhours<br />
<strong>of</strong> 2.4% compares with an estimated national<br />
decline <strong>of</strong> 1.3% for 1967.<br />
Total Employment and Income Chart III indicates<br />
that nonmanufacturing employment in the District<br />
in 1967 posted a more impressive gain than did<br />
that in the manufacturing sector. Nonmanufacturing<br />
employment, based on 1967 estimates, averaged<br />
4.2 million, 71% <strong>of</strong> total nonagricultural employ<br />
Chart III<br />
Millions<br />
NONAGRICULTU<br />
F I F T hP<br />
1961 1963 1965 1967<br />
Note: 1967 figures partially estimated.<br />
Source:<br />
<strong>St</strong>ate Departments <strong>of</strong> Labor.