

Water Quality in the Connecticut, Housatonic, and Thames ... - USGS
Water Quality in the Connecticut, Housatonic, and Thames ... - USGS
Water Quality in the Connecticut, Housatonic, and Thames ... - USGS

Create successful ePaper yourself
Turn your PDF publications into a flip-book with our unique Google optimized e-Paper software.
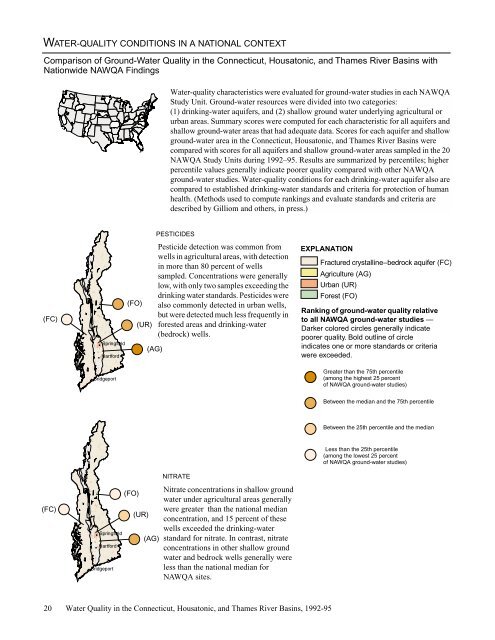
WATER-QUALITY CONDITIONS IN A NATIONAL CONTEXT<br />
Comparison of Ground-<strong>Water</strong> <strong>Quality</strong> <strong>in</strong> <strong>the</strong> <strong>Connecticut</strong>, <strong>Housatonic</strong>, <strong>and</strong> <strong>Thames</strong> River Bas<strong>in</strong>s with<br />
Nationwide NAWQA F<strong>in</strong>d<strong>in</strong>gs<br />
<strong>Water</strong>-quality characteristics were evaluated for ground-water studies <strong>in</strong> each NAWQA<br />
Study Unit. Ground-water resources were divided <strong>in</strong>to two categories:<br />
(1) dr<strong>in</strong>k<strong>in</strong>g-water aquifers, <strong>and</strong> (2) shallow ground water underly<strong>in</strong>g agricultural or<br />
urban areas. Summary scores were computed for each characteristic for all aquifers <strong>and</strong><br />
shallow ground-water areas that had adequate data. Scores for each aquifer <strong>and</strong> shallow<br />
ground-water area <strong>in</strong> <strong>the</strong> <strong>Connecticut</strong>, <strong>Housatonic</strong>, <strong>and</strong> <strong>Thames</strong> River Bas<strong>in</strong>s were<br />
compared with scores for all aquifers <strong>and</strong> shallow ground-water areas sampled <strong>in</strong> <strong>the</strong> 20<br />
NAWQA Study Units dur<strong>in</strong>g 1992–95. Results are summarized by percentiles; higher<br />
percentile values generally <strong>in</strong>dicate poorer quality compared with o<strong>the</strong>r NAWQA<br />
ground-water studies. <strong>Water</strong>-quality conditions for each dr<strong>in</strong>k<strong>in</strong>g-water aquifer also are<br />
compared to established dr<strong>in</strong>k<strong>in</strong>g-water st<strong>and</strong>ards <strong>and</strong> criteria for protection of human<br />
health. (Methods used to compute rank<strong>in</strong>gs <strong>and</strong> evaluate st<strong>and</strong>ards <strong>and</strong> criteria are<br />
described by Gilliom <strong>and</strong> o<strong>the</strong>rs, <strong>in</strong> press.)<br />
(FC)<br />
(FO)<br />
(UR)<br />
PESTICIDES<br />
(AG)<br />
Pesticide detection was common from<br />
wells <strong>in</strong> agricultural areas, with detection<br />
<strong>in</strong> more than 80 percent of wells<br />
sampled. Concentrations were generally<br />
low, with only two samples exceed<strong>in</strong>g <strong>the</strong><br />
dr<strong>in</strong>k<strong>in</strong>g water st<strong>and</strong>ards. Pesticides were<br />
also commonly detected <strong>in</strong> urban wells,<br />
but were detected much less frequently <strong>in</strong><br />
forested areas <strong>and</strong> dr<strong>in</strong>k<strong>in</strong>g-water<br />
(bedrock) wells.<br />
EXPLANATION<br />
Fractured crystall<strong>in</strong>e–bedrock aquifer (FC)<br />
Agriculture (AG)<br />
Urban (UR)<br />
Forest (FO)<br />
Rank<strong>in</strong>g of ground-water quality relative<br />
to all NAWQA ground-water studies —<br />
Darker colored circles generally <strong>in</strong>dicate<br />
poorer quality. Bold outl<strong>in</strong>e of circle<br />
<strong>in</strong>dicates one or more st<strong>and</strong>ards or criteria<br />
were exceeded.<br />
Greater than <strong>the</strong> 75th percentile<br />
(among <strong>the</strong> highest 25 percent<br />
of NAWQA ground-water studies)<br />
Between <strong>the</strong> median <strong>and</strong> <strong>the</strong> 75th percentile<br />
Between <strong>the</strong> 25th percentile <strong>and</strong> <strong>the</strong> median<br />
(FC)<br />
(FO)<br />
(UR)<br />
(AG)<br />
NITRATE<br />
Nitrate concentrations <strong>in</strong> shallow ground<br />
water under agricultural areas generally<br />
were greater than <strong>the</strong> national median<br />
concentration, <strong>and</strong> 15 percent of <strong>the</strong>se<br />
wells exceeded <strong>the</strong> dr<strong>in</strong>k<strong>in</strong>g-water<br />
st<strong>and</strong>ard for nitrate. In contrast, nitrate<br />
concentrations <strong>in</strong> o<strong>the</strong>r shallow ground<br />
water <strong>and</strong> bedrock wells generally were<br />
less than <strong>the</strong> national median for<br />
NAWQA sites.<br />
Less than <strong>the</strong> 25th percentile<br />
(among <strong>the</strong> lowest 25 percent<br />
of NAWQA ground-water studies)<br />
20 <strong>Water</strong> <strong>Quality</strong> <strong>in</strong> <strong>the</strong> <strong>Connecticut</strong>, <strong>Housatonic</strong>, <strong>and</strong> <strong>Thames</strong> River Bas<strong>in</strong>s, 1992-95


