slac-pub-8949 - SLAC - Stanford University
slac-pub-8949 - SLAC - Stanford University
slac-pub-8949 - SLAC - Stanford University

Create successful ePaper yourself
Turn your PDF publications into a flip-book with our unique Google optimized e-Paper software.
p 0<br />
[MeV/c]<br />
∆p rms<br />
[MeV/c]<br />
σ l<br />
[mm]<br />
44<br />
42<br />
40<br />
38<br />
3<br />
2<br />
1<br />
1.5<br />
1<br />
0.5<br />
q bunch<br />
= 5 nC<br />
Exp CTF II<br />
TraFiC 4<br />
q bunch<br />
= 10 nC<br />
Exp CTF II<br />
TraFiC 4<br />
20 40 60<br />
20 40 60<br />
R 56<br />
[mm]<br />
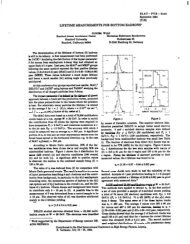
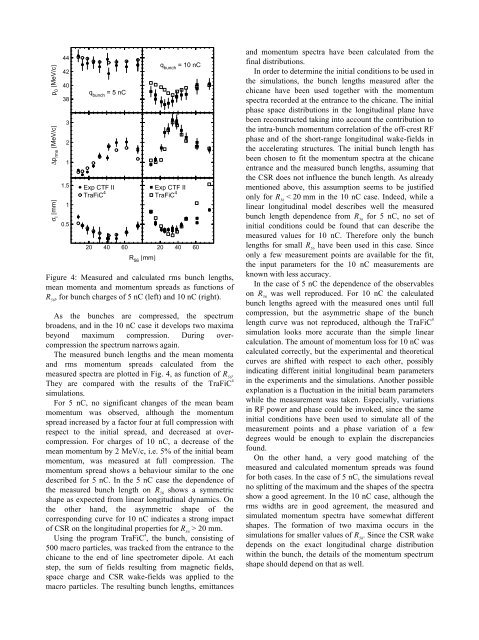
Figure 4: Measured and calculated rms bunch lengths,<br />
mean momenta and momentum spreads as functions of<br />
R 56<br />
, for bunch charges of 5 nC (left) and 10 nC (right).<br />
As the bunches are compressed, the spectrum<br />
broadens, and in the 10 nC case it develops two maxima<br />
beyond maximum compression. During overcompression<br />
the spectrum narrows again.<br />
The measured bunch lengths and the mean momenta<br />
and rms momentum spreads calculated from the<br />
measured spectra are plotted in Fig. 4, as function of R 56<br />
.<br />
They are compared with the results of the TraFiC 4<br />
simulations.<br />
For 5 nC, no significant changes of the mean beam<br />
momentum was observed, although the momentum<br />
spread increased by a factor four at full compression with<br />
respect to the initial spread, and decreased at overcompression.<br />
For charges of 10 nC, a decrease of the<br />
mean momentum by 2 MeV/c, i.e. 5% of the initial beam<br />
momentum, was measured at full compression. The<br />
momentum spread shows a behaviour similar to the one<br />
described for 5 nC. In the 5 nC case the dependence of<br />
the measured bunch length on R 56<br />
shows a symmetric<br />
shape as expected from linear longitudinal dynamics. On<br />
the other hand, the asymmetric shape of the<br />
corresponding curve for 10 nC indicates a strong impact<br />
of CSR on the longitudinal properties for R 56<br />
> 20 mm.<br />
Using the program TraFiC 4 , the bunch, consisting of<br />
500 macro particles, was tracked from the entrance to the<br />
chicane to the end of line spectrometer dipole. At each<br />
step, the sum of fields resulting from magnetic fields,<br />
space charge and CSR wake-fields was applied to the<br />
macro particles. The resulting bunch lengths, emittances<br />
and momentum spectra have been calculated from the<br />
final distributions.<br />
In order to determine the initial conditions to be used in<br />
the simulations, the bunch lengths measured after the<br />
chicane have been used together with the momentum<br />
spectra recorded at the entrance to the chicane. The initial<br />
phase space distributions in the longitudinal plane have<br />
been reconstructed taking into account the contribution to<br />
the intra-bunch momentum correlation of the off-crest RF<br />
phase and of the short-range longitudinal wake-fields in<br />
the accelerating structures. The initial bunch length has<br />
been chosen to fit the momentum spectra at the chicane<br />
entrance and the measured bunch lengths, assuming that<br />
the CSR does not influence the bunch length. As already<br />
mentioned above, this assumption seems to be justified<br />
only for R 56<br />
< 20 mm in the 10 nC case. Indeed, while a<br />
linear longitudinal model describes well the measured<br />
bunch length dependence from R 56<br />
for 5 nC, no set of<br />
initial conditions could be found that can describe the<br />
measured values for 10 nC. Therefore only the bunch<br />
lengths for small R 56<br />
have been used in this case. Since<br />
only a few measurement points are available for the fit,<br />
the input parameters for the 10 nC measurements are<br />
known with less accuracy.<br />
In the case of 5 nC the dependence of the observables<br />
on R 56<br />
was well reproduced. For 10 nC the calculated<br />
bunch lengths agreed with the measured ones until full<br />
compression, but the asymmetric shape of the bunch<br />
length curve was not reproduced, although the TraFiC 4<br />
simulation looks more accurate than the simple linear<br />
calculation. The amount of momentum loss for 10 nC was<br />
calculated correctly, but the experimental and theoretical<br />
curves are shifted with respect to each other, possibly<br />
indicating different initial longitudinal beam parameters<br />
in the experiments and the simulations. Another possible<br />
explanation is a fluctuation in the initial beam parameters<br />
while the measurement was taken. Especially, variations<br />
in RF power and phase could be invoked, since the same<br />
initial conditions have been used to simulate all of the<br />
measurement points and a phase variation of a few<br />
degrees would be enough to explain the discrepancies<br />
found.<br />
On the other hand, a very good matching of the<br />
measured and calculated momentum spreads was found<br />
for both cases. In the case of 5 nC, the simulations reveal<br />
no splitting of the maximum and the shapes of the spectra<br />
show a good agreement. In the 10 nC case, although the<br />
rms widths are in good agreement, the measured and<br />
simulated momentum spectra have somewhat different<br />
shapes. The formation of two maxima occurs in the<br />
simulations for smaller values of R 56<br />
. Since the CSR wake<br />
depends on the exact longitudinal charge distribution<br />
within the bunch, the details of the momentum spectrum<br />
shape should depend on that as well.