A Critical Comparison of Two Procedures for Antiperspirant Evaluation
A Critical Comparison of Two Procedures for Antiperspirant Evaluation
A Critical Comparison of Two Procedures for Antiperspirant Evaluation

Create successful ePaper yourself
Turn your PDF publications into a flip-book with our unique Google optimized e-Paper software.
9.60 JOURNAL OF THE SOCIETY OF COSMETIC CHEMISTS<br />
A 1<br />
A 2<br />
S 1 S 2 S 3 S 4<br />
Sn- 1 S n<br />
T1 T2 T1 T2 t t T1 T2<br />
T 2 T 1 T 2 T 1 T 2 T 1<br />
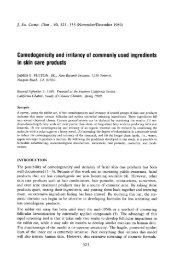
Figure 1. SSEM design represented as a crossover: As represents left axillae; Aa represents<br />
right axillae; Sa, Sa . . . S,• represent subjects; T• represents antiperspirant; Ta represents<br />
control. (Appropriate randomization not shown.)<br />
tions begin in order to provide con<strong>for</strong>mance to the assumptions <strong>of</strong> normality<br />
and homogeneity <strong>of</strong> variance. (The work reported in the earlier paper (5)<br />
showed this to be necessary, and has been confirmed by a large number <strong>of</strong><br />
subsequent experiments. ) A second important feature is the type <strong>of</strong> randomization<br />
procedure used, which is appropriate to the crossover design.<br />
RM Analysis<br />
The SSEM analysis, coupled with correct experimental design and randomization,<br />
can be shown to produce statistically unbiased estimates <strong>of</strong> per cent<br />
reduction and experimental error. The RM uses a similar design, but the<br />
analysis normally used assumes that sides effects are removed by the adjustment<br />
procedure. For the RM to remove side effects fully, however, it would<br />
be necessary that the pretest ratios be constants.<br />
It is easy to observe by examination <strong>of</strong> any set <strong>of</strong> pretest ratios done repeatedly<br />
on the same subjects (see Table I) that the ratios are not constants. The<br />
[act that they are more uni<strong>for</strong>m than milligram values <strong>of</strong> sweat produced is<br />
irrelevant, since ratios, not milligrams, are used in the adjustment procedure.<br />
As an indicator <strong>of</strong> the degree <strong>of</strong> variability <strong>of</strong> pretest ratios w/th time, a correlation<br />
coefficient is a suitable statistic, although certain kinds <strong>of</strong> bias will remain<br />
undetected thereby. We carried out such tests on a number <strong>of</strong> pretest<br />
ratios determined 1, 3, and 21 days apart with the same subjects, using a rank<br />
correlation procedure to avoid violation <strong>of</strong> the statistical requirements <strong>of</strong> normality<br />
and homogeneity <strong>of</strong> variance. We obtained values ranging from less<br />
than 0.50 to 0.87 (a value <strong>of</strong> 1.00 would have indicated perfect correlation between<br />
successive measurements on the same subjects).<br />
In addition to the above, we noted that the variance <strong>of</strong> adjusted mean posttest<br />
ratios is a function <strong>of</strong> the number <strong>of</strong> pretest measurements made and averaged,<br />
which are then used in the adjustment procedure. It is possible, with<br />
the use <strong>of</strong>_ a_ sufficient number <strong>of</strong> pretest measurements, to exercise considerable<br />
control <strong>of</strong> the experimental error <strong>of</strong> the final mean ratios. In one case, <strong>for</strong><br />
example, the width <strong>of</strong> the confidence limits about the mean per cent reduction