A Critical Comparison of Two Procedures for Antiperspirant Evaluation
A Critical Comparison of Two Procedures for Antiperspirant Evaluation
A Critical Comparison of Two Procedures for Antiperspirant Evaluation

You also want an ePaper? Increase the reach of your titles
YUMPU automatically turns print PDFs into web optimized ePapers that Google loves.
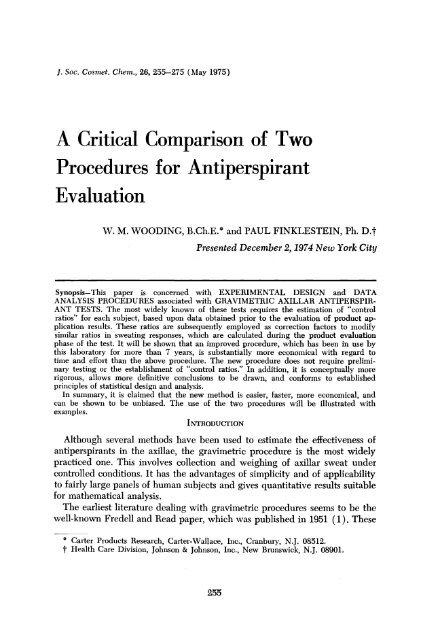
J. Soc. Cosmet. Chem., 26, 255-275 (May 1975)<br />
A <strong>Critical</strong> <strong>Comparison</strong> <strong>of</strong> <strong>Two</strong><br />
<strong>Procedures</strong> <strong>for</strong> <strong>Antiperspirant</strong><br />
<strong>Evaluation</strong><br />
W. M. WOODING, B.Ch.E.* and PAUL FINKLESTEIN, Ph. D.t<br />
Presented December 2, 1974 New York City<br />
Synopsis-This paper is concerned with EXPERIMENTAL DESIGN and DATA<br />
ANALYSIS PROCEDURES associated with GRAVIMETRIC AXILLAR ANTIPERSPIR-<br />
ANT TESTS. The most widely known <strong>of</strong> these tests requires the estimation <strong>of</strong> "control<br />
ratios" <strong>for</strong> each subject, based upon data obtained prior to the evaluation <strong>of</strong> product application<br />
results. These ratios are subsequently employed as correction factors to modify<br />
similar ratios in sweating responses, which are calculated during the product evaluation<br />
phase <strong>of</strong> the test. It will be shown that an improved procedure, which has been in use by<br />
this laboratory <strong>for</strong> more than 7 years, is substantially more economical with regard to<br />
time and ef<strong>for</strong>t than the above procedure. The new procedure does not require preliminary<br />
testing or the establishment <strong>of</strong> "control ratios." In addition, it is conceptually more<br />
rigorous, allows more definitive conclusions to be drawn, and con<strong>for</strong>ms to established<br />
principles <strong>of</strong> statistical design and analysis.<br />
In summary, it is claimed that the new method is easier, faster, more economical, and<br />
can be shown to be unbiased. The use <strong>of</strong> the two procedures will be illustrated with<br />
examples.<br />
INTRODUCTION<br />
Although several methods have been used to estimate the effectiveness <strong>of</strong><br />
antiperspirants in the axillae, the gravimetric procedure is the most widely<br />
practiced one. This involves collection and weighing <strong>of</strong> axillar sweat under<br />
controlled conditions. It has the advantages <strong>of</strong> simplicity and <strong>of</strong> applicability<br />
to fairly large panels <strong>of</strong> human subjects and gives quantitative resultsuitable<br />
<strong>for</strong> mathematical analysis.<br />
The earliest literature dealing with gravimetric procedureseems to be the<br />
well-known Fredell and Read paper, which was published in 1951 (1). These<br />
* Carter Products Research, Carter-Wallace, Inc., Cranbury, N.J. 08512.<br />
•' Health Care Division, Johnson & Johnson, Inc., New Brunswick, N.J. 08901.<br />
255
256 JOURNAL OF THE SOCIETY OF COSMETIC CHEMISTS<br />
workers appear to have been the first to introduce the concept <strong>of</strong> using a test<br />
material in one axilla <strong>of</strong> each subject while leaving the other untreated as a<br />
control. For a period <strong>of</strong> time be<strong>for</strong>e the initial use <strong>of</strong> the actual test materials,<br />
they made daily sweat collections from both axillae <strong>of</strong> each subjectaking part<br />
in the test. They• then calculated pretest ratios (i.e., milligrams <strong>of</strong> sweat from<br />
"•: J 'V•' .<br />
the right axillae'2m•lhgrams <strong>of</strong> sweat from the left axillae) <strong>for</strong> each subject.<br />
These pretest or control ratios were subsequently compared with posttest<br />
right/left ratios, the magnitude <strong>of</strong> the differences being taken as indicative <strong>of</strong><br />
the degree <strong>of</strong> efficacy <strong>of</strong> the antiperspirant material under test. Fredell and<br />
Longfellow in 1958 (2) suggested standardization <strong>of</strong> some <strong>of</strong> the test conditions,<br />
but continued to use right/left ratios in the same way. However, methods<br />
<strong>of</strong> calculation were not clearly defined, and although several pretest determinations<br />
were recommended, the number was not made explicit. Also in<br />
1958, Daly (3) described a ratio method <strong>of</strong> calculation, but his procedur e was<br />
not clear.<br />
Laboratory protocols used by most workers today are similar to those described<br />
by thesearly workers, but the ratio which now appears to be universal<br />
is that <strong>of</strong> milligrams <strong>of</strong> sweat from treated axilla per milligrams from<br />
control axilla, regardless <strong>of</strong> the side treated. The pretest ratio in this case, <strong>of</strong><br />
course, would be that <strong>of</strong> milligrams yielded by the axilla destined to be<br />
treated per milligrams yielded in the opposite axilla. The method <strong>of</strong> adjusting<br />
posttest ratios with the pretest ratios has been described by Majors and<br />
Wi'id (4). The methods used by the older workers employing right/left ratios<br />
were not entirely clear.<br />
In the literature, we have been unable to find a description <strong>of</strong> the evolution<br />
<strong>of</strong> the modern axillar evaluation procedure using ratios, but protocols <strong>for</strong> tests<br />
<strong>of</strong> antiperspirant with contiol, as well as the computation and use <strong>of</strong> treated<br />
side/control side ratios, are discussed in the Majors and Wild paper (4).<br />
One <strong>of</strong> the authors (5) has described the analysis <strong>of</strong> gravimetric data collected<br />
in experiments resembling those discussed by Majors and Wild, but<br />
withouthe use <strong>of</strong> pretest ratios. In that paper, certain aspects <strong>of</strong> the population<br />
distributions <strong>of</strong> axillar milligram data were discussed, and a statistical<br />
model was proposed. Although the differences between that procedure and<br />
the ratio method do not seem to have artraced much attention, we believe it<br />
possible to show conclusively that that method is superior to the ratio method<br />
on the bases <strong>of</strong> statistical rigor, ease <strong>of</strong> correct computation, simplicity, and<br />
economy.<br />
The purposes <strong>of</strong> this paper are as follows:<br />
1. to propose a standard method <strong>for</strong> comparing an antiperspirant with a<br />
control, which does not require the use <strong>of</strong> pretest ratios, and which will give<br />
statistically correct and unbiased estimates <strong>of</strong> per cent reduction and confidence<br />
intervals;<br />
2. to show that commonly used data analys•s methods, involving the deter-
ANTIPERSPIRANT EVALUATION PROCEDURES 257<br />
mination <strong>of</strong> pretest ratios and the adjustment <strong>of</strong> posttest ratios thereby, are incorrect<br />
and produce incorrect results;<br />
3. to demonstrate a statistically correct method <strong>of</strong> analyzing ratio data;<br />
4. to show that point estimates <strong>of</strong> per cent reduction obtained with the ratio<br />
model disagree with those <strong>of</strong> the standard method, even when correct calculations<br />
are used; and<br />
5. tc briefly describe experimental designs <strong>for</strong> comparing more than one<br />
antiperspirant with control, using tests requiring 5 days, without the use <strong>of</strong><br />
pretest ratios.<br />
EXPERIMENTAL<br />
•ROCEDURE<br />
For purposes <strong>of</strong> identification we will call our method the Sides Subiects<br />
Effects Model (SSEM) and the ratio method the Ratio Model (RM). As far<br />
as we can determine, we are the only workers consistently using the SSEM.<br />
Minor variations in the clinical procedures employed exist among users <strong>of</strong> the<br />
RM, and our description below is typical <strong>of</strong>, but not necessarily identical with,<br />
those used by a given investigator.<br />
Both methods are concerned with the same problem: the comparison <strong>of</strong> an<br />
antiperspirant material with a control in order to assess efficacy; and obtaining<br />
this in<strong>for</strong>mation as precisely as possible, without interference or distortion due<br />
to known "natural" differences between sides or among subiects (Maiors and<br />
Wild have produced numerical evidence <strong>of</strong> a commonly hypothesizedisparity<br />
between quantities <strong>of</strong> sweat produced in right and left axillae, which may<br />
be related to whether a subject is right or left handed (4)). •,<br />
For simplicity, we will confine all <strong>of</strong> our detailed comparisons <strong>of</strong> the methods<br />
to "two-sample" tests in which one antiperspirant material is compared<br />
with control, although there is no theoretical reason why more than one antiperspirar•l;•!vay<br />
not be used, and designs <strong>of</strong> this kind will be described briefly<br />
in a later, section.<br />
The two methods are essentially identical in the clincal procedures used,<br />
with the exception <strong>of</strong> the use <strong>of</strong> pretest control runs in the RM; they may vary<br />
in some details, however. The .object <strong>of</strong> both methods is to produce a point<br />
estimate <strong>of</strong> per cent reduction <strong>for</strong> antiperspirant relative to control, with confidence<br />
limits as a measure <strong>of</strong> its precision.<br />
The SSEM procedure is done as follows. First 36 subjects are usually<br />
used. They are required to abstain from the use <strong>of</strong> any antiperspirant product<br />
<strong>for</strong> at least 4 weeks be<strong>for</strong>e the test begins, although they may use deodorants.<br />
The subjects are arbitrarily numbered be<strong>for</strong>e the t,qst begins; then, using a table<br />
<strong>of</strong> random numbers (or a set <strong>of</strong> random numbers generated by a computer),<br />
18 are randomly assigned to receive antiperspirant in the left axilla<br />
and control in the right, leaving the other 18 assigned to the opposite configuration.<br />
"Control" usually implies no treatment rather than a placebo. Applications<br />
<strong>of</strong> product are made daily <strong>for</strong> 4 days. Methods <strong>of</strong> application are stan-
258 JOURNAL OF THE SOCIETY OF COSMETIC CHEMISTS<br />
dardized in detail, but depend upon the physical <strong>for</strong>m <strong>of</strong> the antiperspirant<br />
material used. When both "ambient" and "hot-room" tests are to be run, the<br />
ambient test is done on the fourth day, beginning i hour after the fourth application<br />
<strong>of</strong> the product. A preweighed "ambient" pad <strong>of</strong> non-woven fabric is<br />
placed in each axilla <strong>of</strong> each subject using a harness device or tape to hold it<br />
in position. The subjects go about their normal business <strong>for</strong> 3 hours, then return<br />
to the clinic, where the pad is removed, reweighed, and the weight inincrease<br />
recorded. The subjects return to the clinic on the fifth day, receive a<br />
fifth application <strong>of</strong> the product and i hour later enter a hot room maintained<br />
at 105øF and 50% RH. They are seated in a random spatial order around the<br />
hot room, with a nonwoven fabric pad inserted in each axilla. They are asked<br />
to sit quietly with their hands in their laps and both feet on the floor throughout<br />
the hot-room period. After 40 min., the pads are removed and discarded<br />
(pad A). A second pad, this time preweighed, is then inserted (pad B), left in<br />
place <strong>for</strong> 20 min., then removed, reweighed, and the weight gain recorded.<br />
Finally, a third pad (pad C) is inserted and handled in the same manner as<br />
pad B. This completes the test, and the subjects are dismissed.<br />
A number <strong>of</strong> details are not included in the above account, such as exact<br />
timing, randomization <strong>of</strong> the order <strong>of</strong> treating axillae, etc.<br />
In the RM method, the procedures are similar, but one, two, or more days <strong>of</strong><br />
pretest control data are obtained be<strong>for</strong>e treatments with antiperspirant begin.<br />
Confining the discussion to hot-room tests only <strong>for</strong> simplicity, these pretest<br />
runs are made both with pad B and pad C. It should be remembered that<br />
there are many variations <strong>of</strong> the RM test. Some conduct a test very similar to<br />
the SSEM just described. Others treat all subiects on one side, wait 2 weeks,<br />
then treat all on the other side. These variations, however, are variations in the<br />
experimental design and are unrelated to the central question to which we<br />
address ourselves. There<strong>for</strong>e, to demonstrate differences between the two<br />
models on an equal basis, we will assume that both protocols are identical<br />
except, in the case <strong>of</strong> the RM, <strong>for</strong> the provision <strong>for</strong> the use <strong>of</strong> pretest ratios.<br />
Statistical<br />
Considerations<br />
General<br />
The correct computational procedures <strong>for</strong> either model are dictated within<br />
rather narrow limits by the nature <strong>of</strong> the experimental design (including type<br />
<strong>of</strong> randomization) and the procedure <strong>of</strong> the protocol. Unless these particular<br />
computations are done, incorrect values <strong>of</strong> per cent reduction and/or confidence<br />
limits will be obtained. The computational procedures are there<strong>for</strong>e as<br />
important as the clinical ones and must follow valid statistical principles, take<br />
careful account <strong>of</strong> all underlying assumptions, and be compatible with the<br />
nature <strong>of</strong> the randomizations used in the experiments. These requirements
ANTIPERSPIRANT EVALUATION PROCEDURES 259<br />
should be noted, as the use <strong>of</strong> incorrect randomization procedures, and computations<br />
are very common.<br />
The procedures to be described must be applied separately to data from B<br />
and C pads. Because <strong>of</strong> the probable lack <strong>of</strong> independence <strong>of</strong> the errors <strong>of</strong> the<br />
two sets <strong>of</strong> data, it is not correcto regard them as replicates. Of course, averages<br />
may be used, if desired, or a slope analysis done. We prefer to analyze<br />
them separately. Actually, it is not necessary to use two pads, as we have<br />
found very close agreement between them in hundreds <strong>of</strong> tests.<br />
SSEM Analysis (Crossover)<br />
There is more than one possible model that could be adopted <strong>for</strong> the SSEM.<br />
The one we use at present, as reflected by the randomization procedures employed<br />
in assigning treatments to subjects and the subsequent handling <strong>of</strong> the<br />
subjects, is a crossover design (unlike many crossovers, however, the rows <strong>of</strong><br />
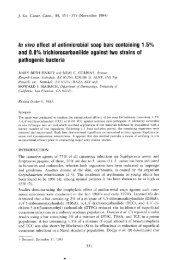
the design represent sides rather than time periods). This design is illustrated<br />
in Figure 1. The columns represent subjects, the two rows sides, and the<br />
letters T• and T2 the antiperspirant and control treatments. The statistical<br />
population model describing this design and its analysis is<br />
where<br />
y• • In mg o• swea• •or axilla i, sub•ec• ], and •rea•en• k<br />
• • genera] mean<br />
a• = axilla i i = 1, 2<br />
a• = subject j j = 1, 2 .... n<br />
• = trea•ent k k = 1, 2<br />
•l• = error <strong>for</strong> axilla i, subject j, and treatment k<br />
a fixed; Za• = 0<br />
a random; •N(O, a•), independent<br />
• fixed; • • 0<br />
As shown in the above model, the usual statistical assumptions underlying<br />
the design and analysis are implied: the errors are independent, randomly<br />
and normally distributed and homogeneous; treatments and sides represent<br />
fixed populations. The data analysis equates certain interactions with error<br />
under the assumption that they do not represent "real" effects in the population,<br />
as is done in Latin square designs. The analysis <strong>of</strong> data under this<br />
model follows that outlined briefly in a previous paper (5). It is assumed that<br />
the data are tabulated to show milligram values identified by subject, side,<br />
and treatment. The purpose <strong>of</strong> the analysis is to obtain estimates <strong>of</strong> the "treatments<br />
effect" and associated error uncontaminated by the influence <strong>of</strong> either<br />
the sides or subjects effects. Details <strong>of</strong> the analysis will be given later in the<br />
<strong>for</strong>m <strong>of</strong> an example. Its major feature is that it requires trans<strong>for</strong>mation <strong>of</strong> the<br />
original milligram values to their logarithms be<strong>for</strong>e the statistical computa-
9.60 JOURNAL OF THE SOCIETY OF COSMETIC CHEMISTS<br />
A 1<br />
A 2<br />
S 1 S 2 S 3 S 4<br />
Sn- 1 S n<br />
T1 T2 T1 T2 t t T1 T2<br />
T 2 T 1 T 2 T 1 T 2 T 1<br />
Figure 1. SSEM design represented as a crossover: As represents left axillae; Aa represents<br />
right axillae; Sa, Sa . . . S,• represent subjects; T• represents antiperspirant; Ta represents<br />
control. (Appropriate randomization not shown.)<br />
tions begin in order to provide con<strong>for</strong>mance to the assumptions <strong>of</strong> normality<br />
and homogeneity <strong>of</strong> variance. (The work reported in the earlier paper (5)<br />
showed this to be necessary, and has been confirmed by a large number <strong>of</strong><br />
subsequent experiments. ) A second important feature is the type <strong>of</strong> randomization<br />
procedure used, which is appropriate to the crossover design.<br />
RM Analysis<br />
The SSEM analysis, coupled with correct experimental design and randomization,<br />
can be shown to produce statistically unbiased estimates <strong>of</strong> per cent<br />
reduction and experimental error. The RM uses a similar design, but the<br />
analysis normally used assumes that sides effects are removed by the adjustment<br />
procedure. For the RM to remove side effects fully, however, it would<br />
be necessary that the pretest ratios be constants.<br />
It is easy to observe by examination <strong>of</strong> any set <strong>of</strong> pretest ratios done repeatedly<br />
on the same subjects (see Table I) that the ratios are not constants. The<br />
[act that they are more uni<strong>for</strong>m than milligram values <strong>of</strong> sweat produced is<br />
irrelevant, since ratios, not milligrams, are used in the adjustment procedure.<br />
As an indicator <strong>of</strong> the degree <strong>of</strong> variability <strong>of</strong> pretest ratios w/th time, a correlation<br />
coefficient is a suitable statistic, although certain kinds <strong>of</strong> bias will remain<br />
undetected thereby. We carried out such tests on a number <strong>of</strong> pretest<br />
ratios determined 1, 3, and 21 days apart with the same subjects, using a rank<br />
correlation procedure to avoid violation <strong>of</strong> the statistical requirements <strong>of</strong> normality<br />
and homogeneity <strong>of</strong> variance. We obtained values ranging from less<br />
than 0.50 to 0.87 (a value <strong>of</strong> 1.00 would have indicated perfect correlation between<br />
successive measurements on the same subjects).<br />
In addition to the above, we noted that the variance <strong>of</strong> adjusted mean posttest<br />
ratios is a function <strong>of</strong> the number <strong>of</strong> pretest measurements made and averaged,<br />
which are then used in the adjustment procedure. It is possible, with<br />
the use <strong>of</strong>_ a_ sufficient number <strong>of</strong> pretest measurements, to exercise considerable<br />
control <strong>of</strong> the experimental error <strong>of</strong> the final mean ratios. In one case, <strong>for</strong><br />
example, the width <strong>of</strong> the confidence limits about the mean per cent reduction
ANTIPERSPIRANT EVALUATION PROCEDURES 261<br />
Table I<br />
Typical Set <strong>of</strong> Txvo-Sample Test Data: Pad B Only, Four Applications be<strong>for</strong>e Posttest<br />
Readings (Milligrams and Ratios)<br />
Subject Number Treatment On (side)<br />
PRETEST DATA POSTTEST DATA<br />
Day 1 Day 2 (after 4 applications)<br />
Ri'ght Left Right Left<br />
Right Left<br />
13 R (mg) 606 599 690 704 263 630<br />
(ratio) 1.012 0.980 0.417<br />
14 R (mg) 657 606 776 695 445 670<br />
(ratio) 1.084 1.117 0.664<br />
15 R (mg) 630 555 646 593 304 380<br />
(ratio) 1.135 1.089 0.800<br />
16 R (mg) 356 262 415 310 217 420<br />
(ratio) 1.359 1.339 0.517<br />
17 R (mg) 400 409 489 546 336 497<br />
(ratio) 0.978 0.896 0.676<br />
18 R (mg) 210 350 394 556 288 557<br />
(ratio) 0.600 0.709 0.517<br />
19 L (mg) 789 332 1060 809 850 365<br />
20<br />
(ratio) 0.421 0.763 0.429<br />
L (mg) 710 589 750 568 400 257<br />
(ratio) 0.830 0.757 0.643<br />
21 L (mg) 725 607 825 684 460 261<br />
(ratio) 0.837 0.829 0.567<br />
22 L (mg) 809 663 312 243 430 200<br />
(ratio) 0.820 0.779 0.465<br />
23 L (mg) 587 612 745 860 788 325<br />
(ratio) 1.043 1.154 0.412<br />
24 L (mg) 618 461 547 523 555 283<br />
(ratio) 0.746 0.956 0.510<br />
varied, as the number <strong>of</strong> pretest measurements used to compute a geometric<br />
mean pretest ratio was increased, as follows:<br />
Number<br />
<strong>of</strong> Pretest Measurements<br />
Width <strong>of</strong> 95% CL about Per Cent Reduction<br />
Computed From Adjusted Posttest Ratios<br />
26.4 (% reduction units)<br />
22.6 (% reduction units)<br />
17.2 (% reduction units)<br />
This reduction <strong>of</strong> the confidence limits about the PR is sufficient so that,<br />
even with geometric means <strong>of</strong> only two pretest ratios, it is <strong>of</strong>ten possible to<br />
equal or exceed the prec;sion obtained with the SSEM when a single posttest<br />
determination is used with the latter. This was the case in examples 2, 3, 4, and<br />
5 <strong>of</strong> Table VII (as will be shown later). Of course, the precision <strong>of</strong> the SSEM
262 JOURNAL OF THE SOCIETY OF COSMETIC CHEMISTS<br />
can likewise be controlled by additional replication (<strong>for</strong> example, by averaging<br />
data obtained on successive days or by the use <strong>of</strong> additional test subiects*<br />
).<br />
Aside from the above, the RM consistentlyields different point estimates<br />
<strong>of</strong> per cent reduction than those obtained with the SSEM, using the same<br />
posttest data. Since the latter can be shown to be correct due to the balance <strong>of</strong><br />
the experimental design, the question arises as to the source <strong>of</strong> the disagreement.<br />
Either both estimates are correct, or the use <strong>of</strong> the RM introduces a bias<br />
into the estimates. Since the confidence intervals obtained by either method<br />
(with correct calculations ) generally include both point estimates, this question<br />
cannot be answered with certainty without further investigation. It seems<br />
clear, however, that the safe procedure is to use the SSEM, in view <strong>of</strong> its<br />
known validity (in addition to its practical advantage <strong>of</strong> requiring less time<br />
and ef<strong>for</strong>t).<br />
The above remarks apply to the comparison when statistically correct methods<br />
are used in analyzing RM data. However, there appear to be as many<br />
methods <strong>of</strong> data analysis as there are practitioners, and all <strong>of</strong> those we have<br />
examined are incorrect and produce incorrect results. There are three common<br />
errors, which are (1) lack <strong>of</strong> recognition <strong>of</strong> the nonnormal character <strong>of</strong><br />
the milligram-weight ratios and per cent reduction values; (2) lack <strong>of</strong> correct<br />
randomization prior to and during the clinical work; and (3) the use <strong>of</strong> a design<br />
implying a model not reflected by the analysis. The first <strong>of</strong> these errors<br />
can be remedied by an appropriate trans<strong>for</strong>mation <strong>of</strong> the ratios. Since it has<br />
been shown that the milligram weights used to <strong>for</strong>m the ratios are log normally<br />
distributed (5), it follows that the adiusted ratios are also log normally distributed.<br />
Thus the proper trans<strong>for</strong>mation <strong>of</strong> the ratios is logarithmic. The<br />
problem <strong>of</strong> finding an appropriate trans<strong>for</strong>mation in order to validate the assumptions<br />
underlying the ordinary statistical procedures is a very common<br />
one and has been treated extensively in the literature <strong>of</strong> applied statistics<br />
(6-•2).<br />
The second error can be corrected by the use <strong>of</strong> the appropriate randomization<br />
procedures and the third by the per<strong>for</strong>mance <strong>of</strong> a suitable analysis.<br />
Summary<br />
Since the removal <strong>of</strong> the sides effect from error is a property <strong>of</strong> the analysis<br />
used with the SSEM and since the balance in the design guarantees an unbiased<br />
estimate <strong>of</strong> the per cent reduction, questions inherent in the use <strong>of</strong> the<br />
*If this is attempted, however, care must be taken to do the analysis correctly, as<br />
measurements on the same subiects on successive days are likely to be correlated.
ANTIPERSPIRANT EVALUATION PROCEDURES 263<br />
RM are easily avoided by using the SSEM. We will now present examples to<br />
illustrate the calculations <strong>for</strong> the SSEM in detail and to compare these with<br />
RM calculations.<br />
Examples<br />
General<br />
Using data from several sources, we have analyzed 5 sets <strong>of</strong> two-sample<br />
data in three different ways. None <strong>of</strong> these methods will efficiently detect<br />
interactions among sides, treatments, and subiects, although a new design,<br />
discussed briefly later on and now being studied in this laboratory, has this<br />
capability. The most interesting <strong>of</strong> these interactions would be those involving<br />
treatments, <strong>of</strong> course, but it is not known at present whether they<br />
exist and, if so, whether their magnitudes are important.<br />
We will illustrate the following procedures in this section.<br />
A. SSEM procedure: This is the recommended analysis and gives unbiased<br />
estimates <strong>of</strong> per cent reduction. In this analysis, the effects <strong>of</strong> sides, subiects,<br />
and treatments are removed from the error estimates used to compute confidence<br />
intervals. The method does not require pretest ratios.<br />
B. RM procedure (incorrect numerical analysis): This illustration will use<br />
one <strong>of</strong> the several incorrect procedures commonly employed to obtain per<br />
cent reduction estimates and confidence intervals, using adjusted ratios. The<br />
procedure is included to illustrate the distortion <strong>of</strong> results brought about by its<br />
vi_olation <strong>of</strong> the statistical assumptions <strong>of</strong> normality and homogeneity <strong>of</strong> variance,<br />
as well as its failure to take residual sides effects into account.<br />
C. RM procedure (correct analysis): This illustration will show the analysis<br />
<strong>of</strong> adiusted ratios when the above assumptions and a possible residual<br />
treatments times sides effect are accounted <strong>for</strong>. Its disagreement with the correct<br />
results yielded by the SSEM analysis (see(A) above) will be shown.<br />
We shall describe the computations <strong>for</strong> each <strong>of</strong> the above procedures in<br />
some detail, using a single small set <strong>of</strong> data to allow the reader to compare the<br />
arithmetic involved in each case. We shall then summarize the results we obtained<br />
in applying the same procedures to each <strong>of</strong> the four other sets <strong>of</strong> similar<br />
two-sample data.<br />
Table ! gives a set <strong>of</strong> milligram data from 12 subiects, using the design <strong>of</strong><br />
Fig. 1, with both pretest and posttest weights, <strong>for</strong> an antiperspirant known to<br />
be effective. For simplicity, we present data from only i pad and i hot-room<br />
collection posttest, the latter done after 4 antiperspirant applications. Note<br />
that, as was explained earlier, SSEM tests done <strong>for</strong> this laboratory normally<br />
use only i day <strong>of</strong> hot-room testing, done after 5 daily antiperspirant applications,<br />
and our test is completed in 5 days.
264 JOURNAL OF THE SOCIETY OF COSMETIC CHEMISTS<br />
The data <strong>of</strong> the example represent a portion <strong>of</strong> a larger study, which included<br />
more than i active product. As was indicated earlier, the recommended<br />
minimum number <strong>of</strong> subjects <strong>for</strong> the SSEM procedure is about 36.<br />
A. SSEM Calculations<br />
1. For the SSEM calculations, the milligram posttest data are first trans<strong>for</strong>med<br />
to their natural logarithms, which are shown in Table II.<br />
2. An analysis <strong>of</strong> variance (ANOVA), mixed model (treatments and sides<br />
fixed), is done on the trans<strong>for</strong>medata <strong>of</strong> Table II, using the crossover model.<br />
The ANOVA is shown in Table III, with back-trans<strong>for</strong>med mean milligrams<br />
<strong>for</strong> treatment<br />
and control.<br />
Table II<br />
Natural Logs t <strong>of</strong> Posttest Data <strong>of</strong> Table I<br />
Subject Number Treated On Right Left<br />
13 R 5.572 6.446<br />
14 R 6.098 6.507<br />
15 R 5.717 5.940<br />
16 R 5.380 6.040<br />
17 R 5.817 6.209<br />
18 R 5.663 6.323<br />
19 L 6.745 5.900<br />
20 L 5.991 5.549<br />
21 L 6.131 5.565<br />
22 L 6.064 5.298<br />
23 L 6.669 5.784<br />
24 L 6.319 5.645<br />
•*Rounded to neares three decimals <strong>for</strong> convenience; the actual analysis by computer used<br />
ten. It is generally sufficient to use t•vo or three places if hand calculations are done.<br />
Table<br />
III<br />
ANOVA <strong>of</strong> Data <strong>of</strong> Table II<br />
SOURCE OF VARIATION DF SS MS F P<br />
Treatments(Product versus controD 1 2.2795 2.2795 107.477
ANTIPERSPIRANT EVALUATION PROCEDURES 265<br />
or<br />
3. The mean per cent reduction is computed as follows:<br />
PR -- T2 - T• 100 = 534.9 -- 288.8 100 = 46.01<br />
52534.9<br />
pR=(1 - •1) •2 100= (1288'8•100=46.01<br />
534.9<br />
where T2represents control mean in milligrams, and T• represents the treatment<br />
mean in milligrams.<br />
Note that the ANOVA F tests indicate a strong antiperspirant effect and a<br />
small sides effect, if any, in this ease.<br />
4. Confidence limits about the population mean per cent reduction* are<br />
estimated<br />
as follows:<br />
(a) Using the error mean squa.re (emr) from the original ANOVA (done on<br />
logs <strong>of</strong> the data), compute the standard error <strong>of</strong> the difference between<br />
the treatment and control means<br />
SED =S7 • S•2 nl S2• n•<br />
where S12 represents the variance <strong>for</strong> antiperspirant data; S22 represents the<br />
variance <strong>for</strong> control data; nl represents the number <strong>of</strong> data in the antiperspirant<br />
mean; and n2 represents the number <strong>of</strong> data in the control mean<br />
(under the assumption <strong>of</strong> homoscedasticity, which was satisfied by the log<br />
trans<strong>for</strong>mation S12• S21). Because <strong>of</strong> the experimental design, equal numbers<br />
<strong>of</strong> axillae were used <strong>for</strong> antiperspirant and control; there<strong>for</strong>e ns = n2.<br />
The above expression there<strong>for</strong>e reduces to<br />
where S 2is the emr in the ANOVA.<br />
There<strong>for</strong>e<br />
./2(0.0212)<br />
S• = • ]• - 0.0594<br />
*95% confidence limits used in this way are indicators <strong>of</strong> the precision <strong>of</strong> the test but<br />
a posterJori, do not imply a probability that the population mean is included in the interval.<br />
This interpretation can only be used a priori, when one can say that (if (l-a)-----<br />
0.95) the population mean will be included in 19 out <strong>of</strong> 20 identical experiments. A<br />
posteriori, the mean e.'fiaer is or is not included (12), and a probability estimate is in-<br />
appropriate.
__<br />
__<br />
266 JOURNAL OF THE SOCIETY OF COSMETIC CHEMISTS<br />
(b) Compute the difference between the antiperspirant and control means<br />
(in terms <strong>of</strong> logs)<br />
Tx ---- 5.6656: T2 '- 6.2820<br />
D •- 5.6656 - 6.2820 = --0.6164<br />
note that the difference used is antiperspirant minus control, not the re-<br />
verse.<br />
(c) Compute the 95% confidence interval abouthe population difference<br />
CL0.95 =• +- S• t0.0.•<br />
where i5 represents the above difference; S• represents the standard error <strong>of</strong><br />
the difference; and t0.05 represents Student's t at ot = 0.05.<br />
In the example<br />
so that<br />
or<br />
__<br />
D = -0.6164<br />
S•= 0.0504<br />
t.05 = 2.228*<br />
CL0.9, = -0.6164 -+ (0.0594)(2.228)<br />
= -0.6164 - (0.1323)<br />
-0.4841 to -0.7487<br />
(d) A difference between the logarithms <strong>of</strong> two numbers is the ratio <strong>of</strong> the<br />
two numbers when antilogs are taken. Thus<br />
antilog • - •<br />
T2<br />
where T• and T,are in milligrams. If we take antilogs <strong>of</strong> the two confidence<br />
limits, we obtain a maximum and minimum ratio <strong>of</strong> antiperspirant<br />
to control milligrams, representing 95% confidence limits abouthe popula-<br />
tion mean ratio:<br />
antilog -0.4841 = 0.6163<br />
antilog -0.7487 = 0.4730<br />
PR• = (1-0.6163) 100 = 38.37<br />
PR (from step 3) = 46.01<br />
PR2 = (1-0.4730) 100 = 52.70<br />
*At 10 df (the error df in fl•e ANOVA).
--,<br />
--<br />
--<br />
ANTIPERSPIRANT EVALUATION PROCEDURES 267<br />
B. RM Calculations (Without Trans<strong>for</strong>mations)<br />
The method to be illustrated manipulates individual adiusted ratios and is<br />
commonly used. Another, not illustrated here, uses individual per cent reduction<br />
values computed from single adiusted ratios as the basic statistics. Both<br />
methods are incorrect due to the fact that they use statistics (arithmetic<br />
means, estimates <strong>of</strong> standard deviations, and standard errors), which yield<br />
biased results because <strong>of</strong> the nonnormal character <strong>of</strong> the ratios and per cent<br />
reduction values. An additional source <strong>of</strong> bias in the error estimates is lack <strong>of</strong><br />
provision <strong>for</strong> the influence <strong>of</strong> residual sides effects, since it is unlikely, as discussed<br />
above, that the adiustment procedure removes them completely. Procedure<br />
B is illustrated, there<strong>for</strong>e, solely to show the departure from the correct<br />
values given by method A. For simplicity, in our examples <strong>of</strong> the RM we use<br />
mean pretest ratios derived from two successive days <strong>of</strong> pad B runs, and a<br />
single hot-room test using pad B only is illustrated.<br />
This procedure is commonly done as follows:<br />
1. Individual pretest and posttest ratios are computed from the milligram<br />
data. For the data <strong>of</strong> the example, these were given in Table I.<br />
2. Arithmetic means <strong>of</strong> the pretest ratios are calculated, and the adjusted<br />
ratios are computed by dividing the posttest ratios by these mean pretest<br />
ratios. For example, <strong>for</strong> subject 19 in Table I (chosen because <strong>of</strong> the fairly<br />
large disagreement between the two pretest ratios)<br />
Pretest ratio, day I = Rv• = 0.421<br />
Pretest ratio, day 2 = Rv.2 = 0.763<br />
Mean pretest ratio = Rv = 0.592<br />
Posttest ratio = P•t = 0.429<br />
Adiusted ratio = R' = Rt/R v = 0.725<br />
In a similar way, R' values <strong>for</strong> each <strong>of</strong> the 12 subjects <strong>of</strong> Table I are computed.<br />
These are shown in Table IV (last column).<br />
The overall mean posttest ratio R' is obtained by averaging the adjusted<br />
ratios R' in Table IV (R'= 0.6173).<br />
The variance, standard deviation, and standard error <strong>of</strong> the mean are computed<br />
from the adjusted ratios R'<br />
Estimated variance = S 2 = 0.0235<br />
Estimated standard deviation = Sxi = 0.1533<br />
Estimated standard error = S• = 0.0442<br />
95% confidence limits about -7 R are computed using S• and Student's t at<br />
p = 0.05 and 11 degrees <strong>of</strong> freedom<br />
__ --<br />
CL9• = R' +-- Sx to.oh<br />
= 0.6173 +-- (0.0442)(2.201)<br />
= 0.7146 to 0.5200
,<br />
ß<br />
--<br />
268 JOURNAL OF THE SOCIETY OF COSMETIC CHEMISTS<br />
Table IV<br />
Summary <strong>of</strong> Ratios <strong>for</strong> Method B<br />
Subject Number Rp• Rpo. tl•, lit<br />
13 1.012 0.980 0.996 0.417 0.419<br />
14 1.084 1.117 1.101 0.664 0.603<br />
15 1.135 1.089 1.112 0.800 0.719<br />
16 1.359 1.339 1.349 0.517 0.383<br />
17 0.978 0.896 0.937 0.676 0.72I<br />
18 0.600 0.709 0.655 0.517 0.790<br />
19 0.421 0.763 0.592 0.429 0.725<br />
20 0.830 0.757 0.794 0.643 0.810<br />
21 0.837 0.829 0.833 0.567 0.681<br />
22 0.820 0.779 0.800 0.465 0.582<br />
23 1.043 1.154 1.099 0.412 0.375<br />
24 0.746 0.956 0.851 0.510 0.599<br />
The upper and lower confidence limits about the mean per cent reduction<br />
(PR1, PR•,) are computed from these, and the mean per cent reduction PR is<br />
computed from R'<br />
--<br />
UCL <strong>for</strong> R' = 0.7146<br />
mean ratio, R' = 0.6173<br />
LCL <strong>for</strong> R' = 0'.5200<br />
PR1 = (1-0.5200) 100 = 48.00<br />
'•: PR = (1-0.6173)100 = 38.27<br />
PRa = (1-0.7146)100 = 28.54<br />
C. BM Calculations With Trans<strong>for</strong>mation<br />
This method takes into account the fact that correct estimates <strong>of</strong> the mean<br />
ratios and other statistics cannot be obtained by method B because neither the<br />
ratios nor the milligram values from which they are derived are normally distributed.<br />
In addition, despite the adjustment procedure, some sides effects<br />
may remain in the data, and there<strong>for</strong>e the error estimate must be obtained<br />
from the data after accounting <strong>for</strong> these. Since method C also uses adjusted<br />
ratios, however, it cannot compensate <strong>for</strong> any distortion in the per cent reduction<br />
estimates , which may be introduced by the adjustment procedure. There<strong>for</strong>e,<br />
although the method is more nearly Correct than B, it still may not give<br />
correct results. Note also that, quite aside frbm these considerations, the error<br />
estimate yielded by method C has a different composition than that <strong>of</strong> method<br />
A, although it is not necessarily incorrect.<br />
The normality problem is handled by trans<strong>for</strong>ming the ratios to their logarithms<br />
be<strong>for</strong>e manipulating them, then back-trans<strong>for</strong>ming them. Since the
ANTIPERSPIRANT EVALUATION PROCEDURES<br />
269<br />
Subject Number<br />
Treatment on<br />
Table V<br />
Summary <strong>of</strong> Ratios <strong>for</strong> Method C<br />
13 R 1.019. 0.980 0.996 0.417 0.419 --0.870<br />
14 R 1.084 1.117 1.100 0.664 0.604 --0.504<br />
15 R 1.135 1.089 1.112 0.800 0.719 --0.330<br />
16 R 1.359 1.339 1.349 0.517 0.383 --0.960<br />
17 R 0.978 0.896 0.936 0.676 0.722 --0.326<br />
18 R 0.600 0.709 0.652 0.517 0.793 --0.232<br />
19 L 0.421 0.763 0.567 0.429 0.757 --0.278<br />
20 L 0.830 0.757 0.793 0.643 0.811 --0.209<br />
21 L 0.837 0.829 0.833 0.567 0.681 --0.384<br />
22 L 0.820 0.779 0.799 0.465 0.582 --0.541<br />
23 L 1.043 1.154 1.097 0.419. 0.376 --0.978<br />
24 L 0.746 0.956 0.844 0.510 0.604 --0.504<br />
original milligram data are log normally distributed, it can be shown that their<br />
ratios, as well as the adjusted ratios (which are ratios <strong>of</strong> ratios) are also log<br />
normal. Interestingly, if the milligram data had been normal, the resulting ratios<br />
would not have been log normal, and a much more complex trans<strong>for</strong>mation<br />
would then have been required.<br />
Referring to Table I, and again using the data fr'om subject 19, we gethe<br />
following:<br />
1. For each subject, obtain the geometric mean <strong>of</strong> the pretest ratios<br />
Day 1 pretest ratio = 0.421; In 0.421 =-0.865<br />
Day 2 pretest ratio = 0.763; In 0.763 ----0.270<br />
Arithmetic mean <strong>of</strong> logs = (-0.865 -0.270)/2 = -0.568<br />
Antilog <strong>of</strong> mean = geometric mean -- 0.567<br />
(The close agreement between the mean <strong>of</strong> the logs and its antilog is a result<br />
<strong>of</strong> the particular value <strong>of</strong> the mean.)<br />
2. Adjust the posttest ratios in the ordinary way, using these geometric<br />
mean pretest ratios<br />
0.429<br />
R-• =0.•= 0.757<br />
3. Take natural logarithms <strong>of</strong> all adjusted posttest ratios. Table V lists<br />
these <strong>for</strong> the example data <strong>of</strong> Table I. In Table V, Rp•, and Rp2 are the pretest<br />
__<br />
ratios; RG is the geometric means <strong>of</strong> the pretest ratios <strong>for</strong> each subject; Rt is<br />
the posttest ratio; R' is the adjusted ratio; and R'•, is the natural logarithm <strong>of</strong><br />
R'. Note the differences between the R' values in Table IV and those in Table<br />
V. These are due to the different method <strong>of</strong> computing the mean pretest ratio.
270 JOURNAL OF THE SOCIETY OF COSMETIC CHEMISTS<br />
ANOVA<br />
Table VI<br />
<strong>of</strong> R'L Data <strong>of</strong> Table V<br />
(Method C)<br />
Source <strong>of</strong> Variation DF SS MS F<br />
Due to side treated i 0.0090 0.0090 0.106<br />
Error 10 0.8470 0.0847<br />
Total 11 0.'8560<br />
Most are very similar, but as can be seen, the difference increases<br />
a function<br />
<strong>of</strong> the disagreement between the two pretest ratios. In experiments in which<br />
more than two pretest ratios are used, or with larger sets <strong>of</strong> subjects, such substantial<br />
disagreements will be more numerous.<br />
4. Using the log-trans<strong>for</strong>med adjusted ratios R'L, carry out the ANOVA <strong>of</strong><br />
Table VI (separating "side treated" and error). This procedure is equivalent<br />
to doing a t-test <strong>for</strong> side treated (the square root <strong>of</strong> F is t in this case), but is<br />
done as a convenient method <strong>for</strong> obtaining an error estimate free <strong>of</strong> any sides<br />
effect.<br />
5. The standard error <strong>of</strong> the mean <strong>of</strong> the logs <strong>of</strong> the adjusted ratios is obtained<br />
from the ems in Table VI. Confidence limit are then calculated about<br />
the mean value <strong>of</strong> RL, antilogs taken, and the per cent reduction and its 95%<br />
confidence limits obtained.<br />
Sum•ry<br />
Mean <strong>of</strong> logs <strong>of</strong> adjusted ratios = R'L = --0.5097<br />
Standard error <strong>of</strong> mean = - 0.0840<br />
CLo.,• = R'•n --- S• to.o•<br />
= -0.507 _+(0.0840)(2.228)<br />
= -0.3226 to -0.6969<br />
to.o• at 10 df = 2.228<br />
antilog (-0.6969) = 0.498 (lower 95% CL <strong>for</strong> ratio)<br />
antilog (-0.5•7) = 0.601 (mean ratio)<br />
antilog (-0.3226) = 0.724 (upper 95% CL <strong>for</strong> ratio)<br />
PR• = (1-0.724)1• = 27.60 (lower 95% CL <strong>for</strong> PR)<br />
PR = (1-0.601)100 = 39.90 (mean per cent reduction)<br />
PRa= (1-0.498)100 = 50.20 (upper 95% CL <strong>for</strong> PR)<br />
Methods A, B, and C were applied to 5 sets <strong>of</strong> •o-sample antiperspirant<br />
data involving varying numbers <strong>of</strong> subjects, following the procedures just illustrated.<br />
The results are summarized in Table VII.
ANTIPERSPIRANT EVALUATION PROCEDURES 9.71<br />
Table VII<br />
<strong>Comparison</strong> <strong>of</strong> Results <strong>of</strong> Analysis <strong>of</strong> Txvo-Sample Data Sets Using Methods A, B, and C<br />
Method<br />
Data Set Number Statistic A B C<br />
(SSEM) (RM) (RM)<br />
(used in<br />
1. examples)<br />
Number <strong>of</strong> subjects 12 12 12<br />
Mean PR 46.01 38.27 39.90<br />
CL9.• about PR 38.4 to 52.7 28.5 to 48.0 9.7.6 to 50.2<br />
Width <strong>of</strong> CL.•,• 14.3 19.5 22.6<br />
Number <strong>of</strong> subjects 36 36 36<br />
Mean PR 20.51 15.03 16.61<br />
CLg• about PR 13.6 to 26.• 9.3 to 20.8 11.0 to 21.9<br />
Width <strong>of</strong> CL.•., 13.2 11.5 10.9<br />
3. a<br />
Number <strong>of</strong> subjects 36 36 36<br />
Mean PR 44.14 39.91 43.10<br />
CL,,• about ?R 36.1 tt• 51.2 33.6 to 46.3 35.7 to 49.6<br />
Width <strong>of</strong> CL.•.• 15.1 12.7 13.9<br />
Number <strong>of</strong> subjects 8 8 8<br />
Mean PR 19.61 21.60 24.56<br />
CL• about PR --11.7 to 42.1 1.6 to 41.6 3.7 to 40.9<br />
Width <strong>of</strong> CL9.• 53.8 40.0 37.2<br />
Number <strong>of</strong> subjects 12 12 12<br />
Mean PR 14.07 14.19 15.45<br />
CL•.• about PR 1.3 to 25.2 3.2 to 25.2 3.8 to 25.7<br />
Width <strong>of</strong> CL•,• 23.9 28.4 21.9<br />
•This set showed a moderate sides effect in methods A and C. The sides effects in the other<br />
sets, be<strong>for</strong>e correction with ratios, appeared to be quite small.<br />
MISCELLANEOUS lqELATED TOPICS<br />
Sympathetic Effect<br />
An hypothesis, which has been advanced occassionally, suggests that an effective<br />
antiperspirant applied to one axilla might stimulate additional sweating<br />
in the opposite (control) axilla. An argument in favor <strong>of</strong> the use <strong>of</strong> the RM,<br />
in spite <strong>of</strong> the disadvantagesuggested in the <strong>for</strong>egoing discussion, might be<br />
the assumption that it will correct <strong>for</strong> this "cork effect" because it uses pretest<br />
control values, which are obviously unaffected by the antiperspirantreatment.<br />
We made calculations from the 5 sets <strong>of</strong> data summarized in Table VII,<br />
using the SSEM method, but with pretreatment instead <strong>of</strong> concurrent controls.<br />
Of course, this procedure introduces substantial additional variation,
272 JOURNAL OF THE SOCIETY OF COSMETIC CHEMISTS<br />
but with these data we have found no evidence <strong>for</strong> the effect. If it existed, the<br />
expectation would be that the point estimates <strong>of</strong> per cent reduction obtained<br />
with the regular SSEM method (concurrent controls) would be biased in an<br />
upward direction (inflated), while the use <strong>of</strong> pretest controlshould give lower<br />
PR values. If the cork effect were small or nonexistent, on the other<br />
hand, the two methods should vary in their outcomes in a random manner<br />
with, <strong>of</strong> course, larger errors when a priori controls are used. Our results on<br />
these sets <strong>of</strong> data do not show any consistency which could be considered<br />
significant; there were 4 eases in which the a priori controls yielded higher<br />
per cent reductions than those obtained with concurrent controls and one in<br />
which they were lower. We there<strong>for</strong>e believe that any cork effect in the dataif<br />
it exists at all-must be small.<br />
Other Models<br />
The discussion and examples in this paper have been confincd to experiments<br />
in which only two "treatments" were considered: antiperspirant and<br />
control. However, it is possiblc to use three or even a greater number <strong>of</strong><br />
treatments. In fact, at this laboratory the usual evaluation is a three-sample<br />
procedure in which a control and two different antiperspirants are tested. The<br />
orclinary SSEM procedure is used, but the design, instead <strong>of</strong> being a crossover,<br />
is a <strong>for</strong>m <strong>of</strong> balanced incomplete blocks structure known as a Youden<br />
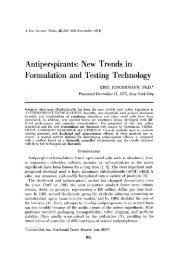
square. A schematic picture <strong>of</strong> such a design is shown in Fig. 2. The analysis<br />
substantially more complex than that <strong>of</strong> the crossover, but is easily and quickly<br />
done with even small computer facilities and can be done in a few hours<br />
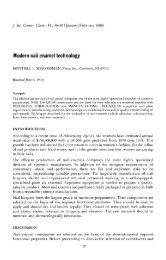
with a desk calculator. A similar design can be used <strong>for</strong> 5 samples. This is<br />
illustrated in Fig. 3.<br />
Finally, there is a model <strong>for</strong> thc two-sample test which may be superior in<br />
some ways to the crossover we have recommended. We are just beginning to<br />
S• Sa S• S• S• S• S•S•7S•e<br />
A 1<br />
A2<br />
T 1 T2 T 3<br />
T 2 T 3 T1<br />
A 1<br />
A 2<br />
T 1 T2 T3<br />
T2 T 3 T 1<br />
A 1<br />
A 2<br />
T1 T 2 T 3<br />
T 2 T 3 T 1<br />
(Type I<br />
Squares)<br />
A 1<br />
A2<br />
$19520S21 $22S2352• S3•S35S36<br />
T2 T3 T1<br />
A1 I T2 T3 T1<br />
T1 T2 T3 A2 I T1 T2 T3<br />
A 1<br />
A 2<br />
T2 T 3 T 1<br />
T1 T 2 T 3<br />
(Type II<br />
Squares )<br />
Figure 2. Three-sample test design (9, x 3 Youden squares) (illustrated <strong>for</strong> 36 subjects): Ai<br />
represents axillae, where i equals 1 or 2; Tj represents treatments (including control),<br />
where j----1, 2, or 3; and Sk representsubjects, where k = 1, 2 . . . 36. (Appropriate<br />
randomization not shown.)
ANTIPERSPIRANT EVALUATION PROCEDURES 273<br />
S1S2 Sa St S5 S6 S? Ss So<br />
(Type I Squares)<br />
AllT1 T2<br />
3<br />
4<br />
5<br />
1<br />
2<br />
3 T 4 T5 AllT1 T2 T 3 T4<br />
5<br />
1<br />
2<br />
3<br />
4 T 5<br />
A 2 T2 T 5 T4 T 1 T 3 T 3 T 4 T 2 T 5 T 1<br />
S11S12S13S1•S15S16S17S18S19S2o<br />
A 2 T 2 T 5 T4-T 1 T 3 T 3 T 4 T2'T 5 T 1<br />
(Type II<br />
Squares)<br />
S21S22S2aS2•S25S26S2?SasS29Smo<br />
AiIT2<br />
A21T1<br />
T 3 T 4 T<br />
T5<br />
4<br />
1<br />
3<br />
4 5 T 1 T 2 T<br />
•72<br />
5<br />
3 T 4 T<br />
SmlSm2SmaSm•SmsSm6Sm?SasSm9S•o<br />
1 11 T2 5 A 2 T 1 T 2 T<br />
T5<br />
1<br />
3 T 4 T 5 T<br />
X 3<br />
4<br />
2<br />
1 1 T 2 T 3 T 4 T 5<br />
Figure 8. Five-sample test design (2 x 10 Youden squares) (illustrated <strong>for</strong> 40 Subjects). A,<br />
represents axillae, where i equals 1 or 2; Ti represents treatments (including control),<br />
where j= 1, 2, . . . 5; and S• represents subjects, where k = 1, 2 . . . 40. (Appropriate<br />
randomization not shown.)<br />
experiment with it, although it represents a well-known statistical design. It<br />
can be characterized as a 22factorial design in which one degree <strong>of</strong> freedom<br />
is confounded with pairs <strong>of</strong> subjects. The laboratory protocol (it is a twosample<br />
design) would be almosthe same as the regular crossover <strong>of</strong> Fig. 1,<br />
but the error structure is more explicit and it will be possible to use it not<br />
only <strong>for</strong> the usual evaluations but also as a means <strong>of</strong> detecting treatments x<br />
sides interactions.<br />
CONCLUSIONS AND DISCUSSION<br />
General<br />
In evaluating either the SSEM or the RM, the central questions are these:<br />
(1) does the method give an undistorted estimate <strong>of</strong> the true (population)<br />
per cent reduction; (2) if so, is it satisfactorily precise; and (3) how easy<br />
is it to use?<br />
The SSEM analysis removes the average sides and subjects effects from<br />
error. The width <strong>of</strong> the confidence limits it produces is a function <strong>of</strong> the number<br />
<strong>of</strong> subjects used in the experiment, as well as the basic error associated<br />
with the protocol. The per cent reduction estimate can be shown to be unbiased,<br />
and the precision <strong>of</strong> the estimate is as good as can be obtained with a<br />
given number <strong>of</strong> subjects, using the crossover model.
9.74 JOURNAL OF THE SOCIETY OF COSMETIC CHEMISTS<br />
The RM gives estimates <strong>of</strong> per cent reduction which have been modified<br />
by the a priori mean ratio obtained at the time <strong>of</strong> the pretest measurements.<br />
If this mean ratio were constant, it would not alter the per cent reduction<br />
obtained relative to that <strong>of</strong> the SSEM. To the extent that this is not true, the<br />
per cent reduction will be differenthan that given by the SSEM. Since it has<br />
been shown that the ratios can be quite variable, it follows that the per cent<br />
reduction estimates obtained may be substantially altered. This difference in<br />
the estimates is obviously a function <strong>of</strong> the degree <strong>of</strong> variability <strong>of</strong> the pretest<br />
ratios. Under these circumstances, the precision <strong>of</strong> the estimate becomes irrelevant<br />
even though it is a function <strong>of</strong> the number <strong>of</strong> pretest determinations<br />
as well as the factors operating in the SSEM. A questionablestimate is not<br />
improved by reducing its variability.<br />
It is possible, however, to utilize pretest data in a statistically valid manner<br />
to adjust posttest results by the use <strong>of</strong> an analysis <strong>of</strong> covariance, and this<br />
procedure might be shown to give more accurate, and precis estimates <strong>of</strong> p;'r<br />
cent reduction than those given by the SSEM, if the pretest data are sufficiently<br />
well-correlated with the posttest ratio. The mathematics <strong>of</strong> such an<br />
analysis, however, differ from those <strong>of</strong> the ratio adjustment procedure, and it<br />
is impossible to predict results without experimentation. When time permits,<br />
we plan to investigate this matter. Meanwhile we recommend the SSEM over<br />
the RM as the scientifically valid method, as well as the one <strong>of</strong> choice on the<br />
bases <strong>of</strong> simplicity and low costr<br />
ACKNOWLEDGMENTS<br />
We wish to thank Dr. John Mandel <strong>for</strong> statistical advice xvhich has been helpful in<br />
clarifying our thinking regarding a number <strong>of</strong> points. In addition, Mr. Giles Crane has<br />
contributed statistical assistance, and Miss Linda Timberlake per<strong>for</strong>med a large nmnber cf<br />
statistical analyses in preparing the experiments. Finally, we would like to express our<br />
gratitude to the Editor and reviewers <strong>of</strong> this Journal <strong>for</strong> their careful, complete, and very<br />
comtructive comments.<br />
(Received November 12, 1974)<br />
REFERENCES<br />
(1) W. G. Fredell and R. R. Read, <strong>Antiperspirant</strong>-axillary method <strong>of</strong> determining effectiveness,<br />
Proc. Sci. Sect. Toilet Goods Ass., 23-7 (1951).<br />
(2) W. G. Fredell and J. Longfellow, Report on evaluating antiperspirant and deodorant<br />
products, ]. Soc. Cosmet. Chem., 9, 108-11 (1958).<br />
(3) E. W. Daley, Antispliant testing: A comparison <strong>of</strong> two methods, Proc. Sci. Sect.<br />
Toilet Goods Ass., 1-6 (1958).<br />
(4) P. A. Majors and John E. Wild, The evaluation <strong>of</strong> antiperspirant e•cacy-infi'tence <strong>of</strong><br />
certain variables, ]. Soc. Cosmet. Chem., 25, 139 -2 (1974).<br />
(5) W. M. Woocling, The interpretation <strong>of</strong> gravimetric axillar antlperspirant d._•tx, P:oc.<br />
Joint Con[. Cosmet. Sci, 91-105 (1968).<br />
((") N. R. Draper and H. Smith, Applied Begres•ion Analysis, John Wiley & Sons, Inc.,<br />
New York, 1966, chap. 3.<br />
(7) F. J. Anscombe and J. W. Tukey, The examination and analysis <strong>of</strong> residuals, Technomet,•ics,<br />
5, 141--60 (May 1963).
ANTIPERSPIRANT EVALUATION PROCEDURES 275<br />
(8) M. S. Bartlett, The use <strong>of</strong> trans<strong>for</strong>mations, Biometrics, 3, 39-52 (March 1947).<br />
(9) C. Eisenhart, The assumptions underlying the analysis <strong>of</strong> variance, Biometrics, 3, 1-4<br />
(March 1947).<br />
(10) L. S. Nelson, Analysis <strong>of</strong> Residuals, Nat. Convention Trans., Amer. Soc. Quality Control,<br />
111-8 (1959).<br />
(11) W. M. Wooding, The computation and use <strong>of</strong> residuals in the analysis <strong>of</strong> experimental<br />
data, I. Qual. Technol., 1, 175-88 (July 1969).<br />
(12) G. W. Snedecor and W. G. Cochran, Statistical Methods, 6th ed., Iowa State University<br />
Press, Ames, Iowa, 1967, p. 8-9.