(SEPO) At A Glance - Senate
(SEPO) At A Glance - Senate
(SEPO) At A Glance - Senate

You also want an ePaper? Increase the reach of your titles
YUMPU automatically turns print PDFs into web optimized ePapers that Google loves.
November 2013<br />
Cities in the Philippines<br />
<strong>At</strong> A <strong>Glance</strong><br />
AG-13-06<br />
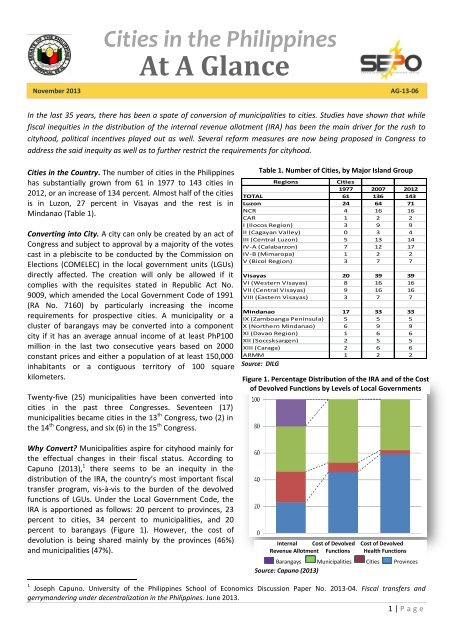
In the last 35 years, there has been a spate of conversion of municipalities to cities. Studies have shown that while<br />
fiscal inequities in the distribution of the internal revenue allotment (IRA) has been the main driver for the rush to<br />
cityhood, political incentives played out as well. Several reform measures are now being proposed in Congress to<br />
address the said inequity as well as to further restrict the requirements for cityhood.<br />
Cities in the Country. The number of cities in the Philippines<br />
has substantially grown from 61 in 1977 to 143 cities in<br />
2012, or an increase of 134 percent. Almost half of the cities<br />
is in Luzon, 27 percent in Visayas and the rest is in<br />
Mindanao (Table 1).<br />
Converting into City. A city can only be created by an act of<br />
Congress and subject to approval by a majority of the votes<br />
cast in a plebiscite to be conducted by the Commission on<br />
Elections (COMELEC) in the local government units (LGUs)<br />
directly affected. The creation will only be allowed if it<br />
complies with the requisites stated in Republic Act No.<br />
9009, which amended the Local Government Code of 1991<br />
(RA No. 7160) by particularly increasing the income<br />
requirements for prospective cities. A municipality or a<br />
cluster of barangays may be converted into a component<br />
city if it has an average annual income of at least PhP100<br />
million in the last two consecutive years based on 2000<br />
constant prices and either a population of at least 150,000<br />
inhabitants or a contiguous territory of 100 square<br />
kilometers.<br />
Twenty-five (25) municipalities have been converted into<br />
cities in the past three Congresses. Seventeen (17)<br />
municipalities became cities in the 13 th Congress, two (2) in<br />
the 14 th Congress, and six (6) in the 15 th Congress.<br />
Why Convert? Municipalities aspire for cityhood mainly for<br />
the effectual changes in their fiscal status. According to<br />
Capuno (2013), 1 there seems to be an inequity in the<br />
distribution of the IRA, the country’s most important fiscal<br />
transfer program, vis-à-vis to the burden of the devolved<br />
functions of LGUs. Under the Local Government Code, the<br />
IRA is apportioned as follows: 20 percent to provinces, 23<br />
percent to cities, 34 percent to municipalities, and 20<br />
percent to barangays (Figure 1). However, the cost of<br />
devolution is being shared mainly by the provinces (46%)<br />
and municipalities (47%).<br />
Table 1. Number of Cities, by Major Island Group<br />
Regions<br />
Cities<br />
1977 2007 2012<br />
TOTAL 61 136 143<br />
Luzon 24 64 71<br />
NCR 4 16 16<br />
CAR 1 2 2<br />
I (Ilocos Region) 3 9 9<br />
II (Cagayan Valley) 0 3 4<br />
III (Central Luzon) 5 13 14<br />
IV-A (Calabarzon) 7 12 17<br />
IV-B (Mimaropa) 1 2 2<br />
V (Bicol Region) 3 7 7<br />
Visayas 20 39 39<br />
VI (Western Visayas) 8 16 16<br />
VII (Central Visayas) 9 16 16<br />
VIII (Eastern Visayas) 3 7 7<br />
Mindanao 17 33 33<br />
IX (Zamboanga Peninsula) 5 5 5<br />
X (Northern Mindanao) 6 9 9<br />
XI (Davao Region) 1 6 6<br />
XII (Soccsksargen) 2 5 5<br />
XIII (Caraga) 2 6 6<br />
ARMM 1 2 2<br />
Source: DILG<br />
Figure 1. Percentage Distribution of the IRA and of the Cost<br />
of Devolved Functions by Levels of Local Governments<br />
Internal Cost of Devolved Cost of Devolved<br />
Revenue Allotment Functions Health Functions<br />
Barangays Municipalities Cities Provinces<br />
Source: Capuno (2013)<br />
1 Joseph Capuno. University of the Philippines School of Economics Discussion Paper No. 2013-04. Fiscal transfers and<br />
gerrymandering under decentralization in the Philippines. June 2013.<br />
1 | P a g e
The study furthered that there are far fewer cities sharing in their 23-percent IRA share than the 1,500-odd<br />
municipalities sharing in their 34-percent IRA share. As such, cities have much bigger revenues than municipalities,<br />
and in turn, can spend more on essential services compared to municipalities (Table 2). It is observed that health and<br />
education which are vital indicators of development are overlooked and not prioritized as much at the municipal<br />
level. Cities, on the other hand, are able to fully operationalize their functions given their resources.<br />
Aside from the fiscal factor, political payoffs have also motivated the creation of new cities. Because recent court<br />
decisions have defined a city that converted from a municipality to be essentially a different LGU from the latter,<br />
municipalities with mayors facing term limit appear to be more likely to convert to cities. Moreover, mayors who<br />
oversaw the city conversion are likely to be succeeded by another member of the same political clan, which is why<br />
they spend their time, effort and political capital to advocate for cityhood (Capuno, 2013).<br />
City Classification. Cities are classified into three<br />
categories: 1) Highly Urbanized Cities (HUCs) 2<br />
with a minimum population of 200,000 and latest<br />
annual income of PhP50 million; 3 2) Independent<br />
Component Cities (ICCs) which are those whose<br />
charters prohibit their voters from voting for<br />
provincial elective officials; and 3) Component<br />
Cities which do not meet the requirements for<br />
HUCs and ICCs.<br />
Out of the 143 cities in the country in 2012, 33<br />
are HUCs with 16 cities belonging to the National<br />
Capital Region (NCR). Five are ICCs and the rest<br />
are still under the jurisdiction of their respective<br />
provinces (105 component cities).<br />
Table 2. Expenditure by Function, CY 2010 (in PhP Million)<br />
Source: LGPMS<br />
Function City Average Municipal Average<br />
General Public Services 376.05 40.62<br />
Education, Culture & Sports/<br />
Manpower Development<br />
94.85 1.81<br />
Health, Nutrition & Population<br />
Control<br />
60.79 5.94<br />
Labor and Employment 0.48 0.09<br />
Housing and Community<br />
Development<br />
46.11 1.17<br />
Social Security/Social Services<br />
& Welfare<br />
24.05 3.56<br />
Economic Services 111.75 11.22<br />
Debt Service (Interest Expense<br />
& Other Charges)<br />
13.97 0.71<br />
Performance of Cities. The Department of the Interior and Local Government (DILG) has created the Local<br />
Governance Performance Management System (LGPMS) as a self-assessment, management and development tool<br />
that will enable LGUs to determine their capabilities and limitations in the delivery of essential public services. In<br />
2012, the Department of Budget and Management (DBM) also designed the Public Financial Management<br />
Assessment Tool (PFMAT) to assist the LGUs particularly in the area of Public Financial Management (PFM). The<br />
PFMAT will allow an LGU to measure aspects of its PFM that require attention, benchmark against other LGUs’<br />
performance, adopt new best practices through the development of an improvement plan, and facilitate<br />
accreditation for future donor support. 4<br />
Based on the 2011 LGPMS-generated data, the top five performing HUCs are San Juan, Puerto Princesa, Iloilo,<br />
Valenzuela and Makati. As for the other city classifications, Laoag, Naga, Vigan, Ligao and Tagaytay are the best<br />
performing. The ranking of said cities were based on the following indicators:<br />
1. Administrative Governance (local legislation, development planning, revenue generation, resource allocation<br />
and utilization, customer service-civil applications, and human resource management and development);<br />
2. Social Governance (health services, support to education services, housing and basic utilities, and peace,<br />
security and disaster risk management);<br />
3. Economic Governance (support to agriculture and fishery sectors, entrepreneurship, business, and industry<br />
promotion);<br />
4. Environmental Governance (forest, freshwater, coastal marine, and urban ecosystems management); and<br />
5. Fundamentals of Good Governance (participation, transparency, and financial accountability).<br />
2 Section 452 of the Local Government Code of 1991.<br />
3 A Component City’s annual income requirement is PhP100 million. Ironically, a city needs only PhP50 miilion to be considered<br />
an HUC. This inconsistency prompted legislators to file bills increasing the income requirement for HUCs. In the <strong>Senate</strong>, SB No.<br />
407 seeks to increase the annual income requirement to PhP150 million based on 2010 constant prices.<br />
4 DBM-PFMAT for LGUs, 2012.<br />
2 | P a g e
Income and Revenue. According to the Bureau of Local Government Finance (BLGF), the top five cities with the<br />
highest income in 2011 belong to the NCR except for Davao. Table 3 also shows the cities with the highest IRA,<br />
highest and lowest tax collection.<br />
Table 3. Cities Based on Income and Revenue, 2011<br />
HIGHEST INCOME HIGHEST IRA HIGHEST TAX COLLECTION LOWEST TAX COLLECTION<br />
Quezon Quezon Makati Dapitan<br />
Makati Davao Quezon Isabela<br />
Manila Manila Pasig Marawi<br />
Pasig Zamboanga Pasay Canlaon<br />
Davao Caloocan Taguig Sipalay<br />
Source: BLGF<br />
Spending and Saving. Table 4 presents the top and least borrowers among the cities, cities with the highest and<br />
lowest expenditure, and cities with the biggest and least savings. Incidentally, cities that spend more are also the<br />
biggest savers such as Pasig, Quezon and Makati. Cities that borrow, spend and save more are all HUCs except for<br />
Biñan.<br />
Table 4. City Performance Based on Spending and Savings, 2011<br />
TOP<br />
BORROWERS<br />
LEAST<br />
BORROWERS<br />
HIGHEST<br />
EXPENDITURE<br />
LOWEST<br />
EXPENDITURE<br />
BIGGEST<br />
SAVINGS<br />
LEAST<br />
SAVINGS<br />
Parañaque Isabela Quezon Danao Pasig Meycauayan<br />
Caloocan Candon Makati Vigan Quezon Balanga<br />
Biñan Kidapawan Davao Bislig Zamboanga Isabela<br />
Iloilo Bayawan Pasig Candon Makati Marawi<br />
Cabanatuan Mandaue Taguig Tacurong Baguio Sipalay<br />
Source: BLGF<br />
Resource Mobilization. The top city spenders for education, health and economic services are listed in Table 5. In<br />
terms of resource mobilization, the NCR dominates the top spenders.<br />
Table 5. Resource Mobilization of Cities, 2011<br />
EDUCATION HEALTH ECONOMIC SERVICES<br />
Makati Makati Pasig<br />
Quezon Quezon Makati<br />
Mandaluyong Mandaluyong Quezon<br />
Pasay Pasay Iloilo<br />
Parañaque Parañaque Mandaluyong<br />
Source: BLGF<br />
Issues and Proposals. Concerns have been raised that with the continuous increase in the number of city<br />
conversions, the country will eventually be full of cities and without municipalities. This will make the delivery of<br />
essential services less efficient given the number of functions devolved to municipalities that will be left to the care<br />
of only the barangays. There is also an apprehension that if the conversion was politically-motivated, it is likely<br />
entrenched with vested interests and will encourage more rent-seeking.<br />
<strong>At</strong> present, three (3) <strong>Senate</strong> Bills (SB Nos. 1185, 1390 and 1491) are filed in the 16 th Congress proposing leniency in<br />
terms of the required land area measure and number of inhabitants mandated in the Local Government Code as<br />
long as the annual average locally-generated income is way more than the minimum requirement of PhP100 million<br />
(proposals range from PhP220 million to PhP500 million).<br />
There are also proposals (SB Nos. 986, 1591 and 1903) to amend the Local Government Code by either increasing the<br />
IRA share of LGUs in the internal revenue taxes, reallocating IRA shares according to the cost of devolved functions,<br />
and/or reevaluating the IRA formula to address the inequity of its distribution.<br />
3 | P a g e