Day 7 - UH Department of Mathematics
Day 7 - UH Department of Mathematics
Day 7 - UH Department of Mathematics

Create successful ePaper yourself
Turn your PDF publications into a flip-book with our unique Google optimized e-Paper software.
Logistic curves are used to model various types <strong>of</strong> phenomena and other physical situations such<br />
as population management. Suppose a number <strong>of</strong> animals are introduced into a protected game<br />
reserve, with the expectation that the population will grow. Various factors will work together to<br />
keep the population from growing exponentially (in an uninhibited manner). The natural<br />
resources (food, water, protection) may not exist to support a population that gets larger without<br />
bound. Often such populations grow according to a logistic model.<br />
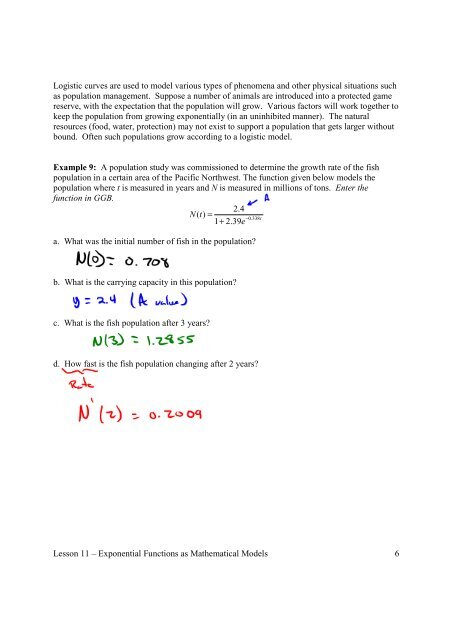
Example 9: A population study was commissioned to determine the growth rate <strong>of</strong> the fish<br />
population in a certain area <strong>of</strong> the Pacific Northwest. The function given below models the<br />
population where t is measured in years and N is measured in millions <strong>of</strong> tons. Enter the<br />
function in GGB.<br />
2.4<br />
N( t)<br />
=<br />
0.338t<br />
1 + 2.39e −<br />
a. What was the initial number <strong>of</strong> fish in the population?<br />
b. What is the carrying capacity in this population?<br />
c. What is the fish population after 3 years?<br />
d. How fast is the fish population changing after 2 years?<br />
Lesson 11 – Exponential Functions as Mathematical Models 6