Internal Migration and Regional Australia - University of Adelaide
Internal Migration and Regional Australia - University of Adelaide
Internal Migration and Regional Australia - University of Adelaide

Create successful ePaper yourself
Turn your PDF publications into a flip-book with our unique Google optimized e-Paper software.
- 1 -<br />
<strong>Australia</strong>n Population & <strong>Migration</strong> Research Centre<br />
Policy Brief<br />
Vol. 1, No. 6 June, 2013<br />
INTERNAL MIGRATION AND REGIONAL AUSTRALIA, 2006-11<br />
By Graeme Hugo, Helen Feist <strong>and</strong> George Tan<br />
<strong>Internal</strong> migration is the major reason for differences in the population growth or decline between<br />
regional areas. It also has important impacts on the composition <strong>of</strong> the population in those areas.<br />
Accordingly it is a major influence on the social <strong>and</strong> economic potential <strong>of</strong> regional areas. This policy<br />
brief examines the role <strong>of</strong> internal migration in the population dynamics <strong>of</strong> regional <strong>Australia</strong>, analyses<br />
its impacts on those communities <strong>and</strong> discuses some policy implications.<br />
INTRODUCTION<br />
<strong>Australia</strong>ns are among the most residentially mobile<br />
populations in the world. Between the 2006 <strong>and</strong> 2011<br />
population censuses, 37.7 percent <strong>of</strong> <strong>Australia</strong>ns<br />
changed their place <strong>of</strong> permanent residence while this<br />
was the case for 14.5 percent in the years 2010-11.<br />
However, much <strong>of</strong> this mobility occurs over a short<br />
distance <strong>and</strong> doesn’t involve movers necessarily<br />
changing their job or social <strong>and</strong> economic fields <strong>of</strong><br />
activity. Moreover there is a high degree <strong>of</strong><br />
compensating reciprocal movement. Between 2006 <strong>and</strong><br />
2011, for example, 20.8 percent <strong>of</strong> all internal<br />
movement in <strong>Australia</strong> occurred within the same<br />
Statistical Area Level 2 (SA2). Hence the impact on that<br />
internal migration has had in bringing about a major<br />
change in the overall structure <strong>of</strong> the national<br />
distribution <strong>of</strong> population has been limited.<br />
Nevertheless, at the local <strong>and</strong> regional level it can<br />
produce substantial changes, not only in population size<br />
but also, importantly, on its composition.<br />
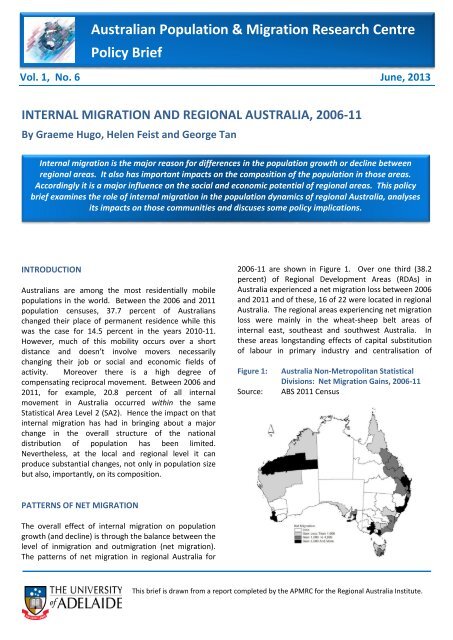
2006-11 are shown in Figure 1. Over one third (38.2<br />
percent) <strong>of</strong> <strong>Regional</strong> Development Areas (RDAs) in<br />
<strong>Australia</strong> experienced a net migration loss between 2006<br />
<strong>and</strong> 2011 <strong>and</strong> <strong>of</strong> these, 16 <strong>of</strong> 22 were located in regional<br />
<strong>Australia</strong>. The regional areas experiencing net migration<br />
loss were mainly in the wheat-sheep belt areas <strong>of</strong><br />
internal east, southeast <strong>and</strong> southwest <strong>Australia</strong>. In<br />
these areas longst<strong>and</strong>ing effects <strong>of</strong> capital substitution<br />
<strong>of</strong> labour in primary industry <strong>and</strong> centralisation <strong>of</strong><br />
Figure 1:<br />
Source:<br />
<strong>Australia</strong> Non-Metropolitan Statistical<br />
Divisions: Net <strong>Migration</strong> Gains, 2006-11<br />
ABS 2011 Census<br />
PATTERNS OF NET MIGRATION<br />
The overall effect <strong>of</strong> internal migration on population<br />
growth (<strong>and</strong> decline) is through the balance between the<br />
level <strong>of</strong> inmigration <strong>and</strong> outmigration (net migration).<br />
The patterns <strong>of</strong> net migration in regional <strong>Australia</strong> for<br />
This brief is drawn from a report completed by the APMRC for the <strong>Regional</strong> <strong>Australia</strong> Institute.
- 2 -<br />
services were exacerbated by the impact <strong>of</strong> <strong>Australia</strong>’s<br />
prolonged millennium drought. It is notable that several<br />
areas in the Murray-Darling Basin where there were<br />
substantial restrictions on water which effected the<br />
migration areas (e.g. Riverina, Murray, Murrayl<strong>and</strong>s <strong>and</strong><br />
Riverl<strong>and</strong>) which had net migration losses.<br />
It is interesting, however, to focus on the nonmetropolitan<br />
areas which recorded an excess <strong>of</strong><br />
inmigration over outmigration. Table 1 lists the <strong>Regional</strong><br />
Statistical Divisions in each state which recorded net<br />
migration gains over the last two intercensal periods.<br />
The first point to be noted is that there were more<br />
growth areas in 2006-11 than in the preceding five years.<br />
The main additions were remote mining areas in<br />
Western <strong>Australia</strong> <strong>and</strong>, to a lesser extent, South<br />
<strong>Australia</strong>. The growth areas in Table 1 <strong>and</strong> Figure 1,<br />
however, over both periods have been coastal areas <strong>and</strong><br />
those adjoining capital cities. The coastal/internal<br />
dichotomy is clearly in evidence.<br />
Table 1:<br />
Source:<br />
Non-Metropolitan Statistical Divisions<br />
Experiencing Net <strong>Migration</strong> Gains in 2001-<br />
06 <strong>and</strong> 2006-11<br />
ABS 2006 <strong>and</strong> 2011 Censuses<br />
2001-06 2006-11<br />
State Statistical Division In Out Net Statistical Division In Out Net<br />
NSW Hunter 56227 46571 9656 Hunter 51153 40702 10451<br />
Illawarra 38907 38018 889 Illawarra 37082 32143 4939<br />
Richmond-Tweed 33463 27320 6143 Richmond-Tweed 28203 25987 2216<br />
Mid-North Coast 44656 34402 10254 Mid-North Coast 38234 31586 6648<br />
Central West 19920 19715 206<br />
South Eastern 34138 27637 6501 South Eastern 30318 26943 3375<br />
Murray 17419 17211 208<br />
VIC Barwon 25594 20929 4665 Barwon 28498 20182 8316<br />
Central Highl<strong>and</strong>s 18792 16384 2408 Central Highl<strong>and</strong>s 21120 15288 5832<br />
Loddon 23066 19457 3609 Loddon 23137 17999 5138<br />
Goulburn 26683 25207 1476 Goulburn 24275 24216 59<br />
Ovens-Murray 13378 12913 465 Ovens-Murray 12686 11974 712<br />
East Gippsl<strong>and</strong> 10724 9923 801 East Gippsl<strong>and</strong> 10584 8725 1859<br />
Gippsl<strong>and</strong> 18564 16992 1572 Gippsl<strong>and</strong> 21731 14847 6884<br />
QLD Gold Coast 80925 51613 29312 Gold Coast 65098 49410 15688<br />
Sunshine Coast 54049 33488 20561 Sunshine Coast 47586 34781 12805<br />
West Moreton 15916 13811 2105 West Moreton 20097 15187 4910<br />
Wide Bay-Burnett 49735 33937 15798 Wide Bay-Burnett 43130 32305 10825<br />
Darling Downs 33136 29960 3176 Darling Downs 30264 27406 2858<br />
Fitzroy 28229 26347 1882 Fitzroy 26827 25229 1598<br />
Mackay 25784 20638 5146 Mackay 24581 22670 1911<br />
Northern 32276 27372 4904 Northern 30555 26049 4506<br />
Far North 29403 26932 2471 Far North 26495 26296 199<br />
SA Outer <strong>Adelaide</strong> 24584 17109 7475 Outer <strong>Adelaide</strong> 26794 18938 7856<br />
Yorke <strong>and</strong> L North 7435 6858 577 Yorke <strong>and</strong> L North 7950 6207 1743<br />
Eyre 4242 4104 138<br />
WA South West 34235 23430 10805 South West 35486 22846 12639<br />
Central 9765 8912 853<br />
Pilbara 19171 14157 5014<br />
Kimberley 6602 6355 247<br />
TAS Southern 6821 6290 531 Southern 7823 6691 1132<br />
Northern 13325 11789 1536 Northern 11569 10941 628<br />
Mersey-Lyell 10267 10026 241 Mersey-Lyell 9420 8893 527<br />
ACT ACT - Bal 1017 133 884<br />
The coastal-internal factor can be well demonstrated in<br />
the New South Wales pattern <strong>of</strong> net migration which<br />
Table 2 shows has a quite distinctive spatial pattern<br />
which is present also in other states. The table shows<br />
net migration data for metropolitan Sydney <strong>and</strong> three<br />
non-metropolitan zones parallel with the coast <strong>and</strong> each<br />
being more inl<strong>and</strong>. A gradation in net migration trends<br />
is in evidence. Firstly, considering net international<br />
migration is apparent that it plays a much lesser role in<br />
the growth <strong>of</strong> population in non-metropolitan areas,<br />
even in those that are experiencing significant<br />
expansion. Nevertheless, despite the very small net<br />
international gains in non-metropolitan New South<br />
Wales compared with Sydney there was a significant<br />
increase in the number <strong>of</strong> immigrants who arrived<br />
between 2006 <strong>and</strong> 2011 compared with 2001 <strong>and</strong> 2006.<br />
This increased significance <strong>of</strong> international migration in<br />
regional areas is examined in detail in Policy Brief,<br />
Volume 1, Number 4. It is interesting that in coastal<br />
areas net international migration gain was similar to<br />
internal migration gain in 2006-11 but only half as big in<br />
2001-06. Nevertheless, the patterns <strong>of</strong> net internal<br />
migration are interesting with the coastal areas<br />
experiencing a gain <strong>and</strong> the two inl<strong>and</strong> zones a net loss.<br />
Table 2:<br />
Source:<br />
NSW<br />
Region<br />
New South Wales: Regions, <strong>Internal</strong><br />
<strong>Migration</strong> 2001-2011 <strong>and</strong> Immigrants Who<br />
Arrived in <strong>Australia</strong> Between 2001 <strong>and</strong><br />
2011<br />
ABS 2006 <strong>and</strong> 2011 Censuses<br />
2001-06 2006-11 Immigrants Arrived<br />
In Out Net In Out Net 2001-06 2007-11<br />
Sydney 122,179 243,191 -121,012 102,614 206,527 -103,913 196,212 254,029<br />
Coastal 207,391 173,948 33,443 184,989 157,361 27,628 16,897 25,112<br />
Central 71,833 86,971 -15,138 66,150 74,098 -7,948 4,409 7,746<br />
Western 19,733 20,612 -879 17,305 19,189 -1,884 771 1,837<br />
INTERNAL MIGRATION BETWEEN CAPITAL CITIES<br />
AND REGIONAL AREAS<br />
Despite the popular narrative <strong>of</strong> population growth in<br />
<strong>Australia</strong>n capital cities being driven by rural-urban<br />
migration, it is evident that the cities have varied in the<br />
extent to which internal migration has contributed to<br />
their growth. In Table 2, for example, Sydney<br />
experienced significant net migration loss by internal<br />
migration in the last decade. Table 3 shows the<br />
estimated components <strong>of</strong> growth in the most recent<br />
intercensal periods for <strong>Australia</strong>’s five largest cities.<br />
During the first two postwar decades, net migration<br />
gains from elsewhere in <strong>Australia</strong> were only minor<br />
elements in the massive growth experienced by the<br />
nation’s two largest cities, dwarfed by the net gain <strong>of</strong><br />
immigrants from overseas, which accounted for more<br />
than half <strong>of</strong> this expansion. During the 1976-96 period,<br />
however, a quite different pattern was in evidence, with
- 3 -<br />
a substantial net internal migration loss being recorded<br />
in both large cities, although international migration<br />
remained an important source <strong>of</strong> growth, especially in<br />
Sydney.<br />
Some differences are evident in the more recent years.<br />
In 1996-2001 there was a reduced net loss in Sydney,<br />
perhaps associated with the growth created by the 2000<br />
Olympic Games. Since then, however, the massive net<br />
interstate migration losses have resumed with a net loss<br />
<strong>of</strong> 121,000 in 2001-06 <strong>and</strong> 103,913 in 2006-11. In<br />
Melbourne there were small net interstate migration<br />
gains in 1996-2001 but a net outmigration <strong>of</strong> 18,000 in<br />
2001-06 <strong>and</strong> 13,410 in 2006-11. Hence Sydney, <strong>and</strong> to a<br />
much lesser extent Melbourne, rather than being a<br />
magnet attracting large numbers from elsewhere in<br />
<strong>Australia</strong>, have been important sources <strong>of</strong> internal<br />
migrants to the rest <strong>of</strong> <strong>Australia</strong> while the fact that<br />
international migrants have disproportionately settled in<br />
<strong>Australia</strong>’s two largest cities has been the major<br />
migration driver <strong>of</strong> their growth.<br />
Table 3:<br />
Source:<br />
Sydney, Melbourne, Brisbane, Perth <strong>and</strong><br />
<strong>Adelaide</strong>: Estimated Components <strong>of</strong><br />
Population Change, 2001-06 <strong>and</strong> 2006-11<br />
ABS unpublished data<br />
Natural<br />
Increase<br />
Net<br />
International<br />
<strong>Migration</strong><br />
Net<br />
<strong>Internal</strong><br />
<strong>Migration</strong><br />
2001-06<br />
Total<br />
<strong>Migration</strong><br />
Total<br />
Population<br />
Increase<br />
Sydney 000s 159 84 -121 -37 122<br />
% 130.3 68.9 -99.2 -30.3 100<br />
Melbourne 000s 121 124 -19 105 226<br />
% 53.5 54.9 -8.4 46.5 100<br />
Brisbane 000s 66 27 43 70 136<br />
% 48.5 19.9 31.6 51.5 100<br />
Perth 000s 49 53 3 56 105<br />
% 46.7 50.5 2.9 53.3 100<br />
<strong>Adelaide</strong> 000s 21 22 -10 12 33<br />
% 63.6 66.7 -30.3 36.4 100<br />
2006-11<br />
Sydney 000s 200 352 -128 224 324<br />
% 47.1 83 -30.6 52.4 100<br />
Melbourne 000s 154 313 -22 291 370<br />
% 34.6 70.3 -5 65.3 100<br />
Brisbane 000s 94 149 11 160 232<br />
% 37 58.8 4.2 63 100<br />
Perth 000s 69 165 18 183 242<br />
% 27.4 65.6 7 72.6 100<br />
<strong>Adelaide</strong> 000s 29 69 -18 51 63<br />
% 36.7 86.3 -23 63.3 100<br />
Note: Preliminary data for 2006-11. Sum <strong>of</strong> components won't add to population change<br />
due to different methodology used to estimate annual population change<br />
Unlike Sydney <strong>and</strong> Melbourne, the three other mainl<strong>and</strong><br />
state capitals recorded significant net internal migration<br />
gains in the first two postwar decades, especially in the<br />
case <strong>of</strong> Brisbane. International migration gains were<br />
substantially larger than internal gains in <strong>Adelaide</strong> <strong>and</strong><br />
Perth but equivalent in size in Brisbane. In the 1976-86<br />
period, however, the impact <strong>of</strong> structural change in the<br />
economy on manufacturing saw <strong>Adelaide</strong>’s rate <strong>of</strong><br />
growth fall from being much higher than that in Brisbane<br />
<strong>and</strong> Perth in 1947-66 to being less than half <strong>of</strong> the rate in<br />
the other two cities. During the 1986-91 intercensal<br />
period, however, Brisbane was the most rapidly growing<br />
city <strong>and</strong> the major element in this growth was net<br />
internal migration gains. Perth, on the other h<strong>and</strong>, grew<br />
less quickly <strong>and</strong> recorded a small net loss <strong>of</strong> migrants to<br />
other parts <strong>of</strong> <strong>Australia</strong> but had a major net gain <strong>of</strong><br />
overseas-born migrants – a gain two <strong>and</strong> a half times<br />
larger than that <strong>of</strong> Brisbane. There was thus a distinctive<br />
difference in the net migration gains being recorded by<br />
<strong>Australia</strong>’s fastest growing capitals, with internal<br />
migrants being prominent in Brisbane <strong>and</strong> overseas-born<br />
being overwhelmingly dominant in Perth. In <strong>Adelaide</strong><br />
there was a small internal migration gain between 1986<br />
<strong>and</strong> 1991 <strong>and</strong> a more substantial net gain <strong>of</strong> overseas<br />
migrants which accounted for a quarter <strong>of</strong> the modest<br />
growth recorded by the southern capital.<br />
In the most recent intercensal period it will be noticed<br />
that Perth <strong>and</strong> Brisbane have continued to experience<br />
growth from internal migration, especially Brisbane,<br />
which is a major sink <strong>of</strong> internal migration in <strong>Australia</strong>.<br />
Perth has become a more important destination in<br />
recent years. <strong>Adelaide</strong>, however, like all <strong>of</strong> South<br />
<strong>Australia</strong> has had a significant net loss due to internal<br />
migration. International migration has increased in<br />
significance in Brisbane <strong>and</strong> retained its importance in<br />
Perth.<br />
Although there were net internal migration losses in the<br />
largest metropolitan centres it is important to note that<br />
there were some important differences according to<br />
age. Figure 2 shows the net migration <strong>of</strong> the <strong>Australia</strong>born<br />
for <strong>Australia</strong>n capital city statistical divisions in<br />
2001-06. It will be noted that there were net losses for<br />
all age groups except the young adult ages. Clearly, for<br />
young <strong>Australia</strong>ns leaving school, getting their first job<br />
<strong>and</strong> entering higher education <strong>of</strong>ten means moving from<br />
non-metropolitan areas to capital cities.<br />
It is interesting, however, to look at the pattern for<br />
2006-11. At the outset it must be stressed that for 2011<br />
the ABS adopted a new geographical category <strong>of</strong> Capital<br />
City. In earlier censuses capitals cities were spatially<br />
defined by Statistical Division boundaries which more or
Net <strong>Migration</strong><br />
Net <strong>Migration</strong><br />
- 4 -<br />
less accorded with the built-up urban fabric <strong>of</strong> capitals.<br />
However, in 2011 a new category was introduced as part<br />
<strong>of</strong> the <strong>Australia</strong>n Statistical Geographical Classification<br />
(ASGC) being replaced by a new system (ASGS –<br />
<strong>Australia</strong>n St<strong>and</strong>ard Geographical System). This category<br />
<strong>of</strong> Capital Cities involved substantially extending the<br />
boundaries <strong>of</strong> the capitals to include their commuting<br />
zones. Hence they include the peri-urban areas which in<br />
the past have been the most rapidly growing part <strong>of</strong><br />
non-metropolitan <strong>Australia</strong>. As a result when we<br />
calculate the net migration pr<strong>of</strong>ile for the <strong>Australia</strong>-born<br />
a somewhat different pattern is evident compared with<br />
Figure 2. Figure 3 shows that the net gain <strong>of</strong> young<br />
Figure 2:<br />
Source:<br />
25000<br />
<strong>Australia</strong>-Born <strong>Internal</strong> Net <strong>Migration</strong><br />
Capital Cities from Non-Metropolitan<br />
Statistical Divisions by Age <strong>and</strong> Sex, 2001-<br />
06<br />
ABS 2006 Census<br />
adults is evident but there is also a net gain <strong>of</strong> younger<br />
families. These are the groups who especially move into<br />
the peri-urban areas surrounding capitals. It is<br />
interesting, however, to note that there are significant<br />
net losses <strong>of</strong> the <strong>Australia</strong>-born in the late 50s <strong>and</strong> 60s<br />
suggesting a strong pattern <strong>of</strong> net outward retirement<br />
migration from the capitals.<br />
The obverse pattern <strong>of</strong> net migration is apparent for<br />
regional <strong>Australia</strong> as is evident in Figure 4. This shows a<br />
major net loss <strong>of</strong> young adults as young people move to<br />
the capital cities in search <strong>of</strong> higher education, a greater<br />
number <strong>and</strong> variety <strong>of</strong> job opportunities <strong>and</strong> the ‘bright<br />
lights’ <strong>of</strong> large city life. On the other h<strong>and</strong> there is a net<br />
gain <strong>of</strong>:<br />
Young families<br />
Retirees<br />
The net gain <strong>of</strong> these groups is, <strong>of</strong> course, concentrated<br />
in particular parts <strong>of</strong> regional <strong>Australia</strong> but are a crucial<br />
element in the development <strong>of</strong> these areas.<br />
20000<br />
15000<br />
Male<br />
Female<br />
Figure 4:<br />
Source:<br />
<strong>Australia</strong> Rest <strong>of</strong> States: Age-Sex Specific<br />
Net <strong>Migration</strong> Estimates, 2006-11<br />
ABS 2011 Census<br />
10000<br />
Net <strong>Migration</strong> 5000<br />
40000<br />
Males<br />
Females<br />
0<br />
30000<br />
20000<br />
-5000<br />
10000<br />
-10000<br />
0<br />
-15000<br />
-10000<br />
Age<br />
-20000<br />
-30000<br />
Figure 3:<br />
Source:<br />
<strong>Australia</strong>: Capital Cities <strong>Migration</strong> Pr<strong>of</strong>ile<br />
<strong>of</strong> <strong>Australia</strong>-Born, 2006 <strong>and</strong> 2011<br />
ABS 2006 <strong>and</strong> 2011 Censuses<br />
-40000<br />
Age<br />
8000<br />
MIGRATION AND REGIONAL DEVELOPMENT<br />
6000<br />
4000<br />
2000<br />
0<br />
-2000<br />
-4000<br />
-6000<br />
-8000<br />
Age<br />
Males<br />
Females<br />
Regardless <strong>of</strong> the approach or strategy adopted in<br />
regional development it will always involve attraction<br />
<strong>and</strong>/or retention <strong>of</strong> people to regional areas.<br />
Accordingly an important first step must be to obtain a<br />
clear underst<strong>and</strong>ing <strong>of</strong> the existing population dynamics.<br />
However, in the past migration has not been seen as a<br />
fundamental ingredient <strong>of</strong> regional development. There<br />
have been some exceptions <strong>and</strong> the introduction <strong>of</strong> the<br />
State Specific <strong>and</strong> <strong>Regional</strong> <strong>Migration</strong> program after<br />
1996 (Hugo, 1999) is one <strong>of</strong> these. However, migration
- 5 -<br />
issues at a regional level have received little attention.<br />
Yet, as Stockdale (2006, 354) points out:<br />
‘… in contrast to the urgency to address the<br />
national trend these same long term … problems<br />
have not been met with similar pro-active<br />
policies’.<br />
The additional complexity at the regional level is injected<br />
by the ubiquitous net outmigration <strong>of</strong> young adults from<br />
even the fastest developing regional areas <strong>and</strong> the<br />
higher level <strong>of</strong> ageing than in metropolitan areas.<br />
This outflow <strong>of</strong> young adults is sometimes seen as fatal<br />
to the future viability <strong>of</strong> regional areas (Muilu <strong>and</strong><br />
Rusanen, 2003, 296):<br />
‘… young people are in a key position as far as<br />
the future <strong>of</strong> the remote rural areas, in<br />
particular, is concerned, for without renewal <strong>of</strong><br />
their population from within these areas cannot<br />
remain viable or maintain their economic<br />
functions in the long term’.<br />
Such attitudes have led to unrealistic policy suggestions<br />
<strong>of</strong> stemming the outflow <strong>of</strong> young people at the stage <strong>of</strong><br />
the lifecycle when they are entering the labour force or<br />
higher education <strong>and</strong> leaving home. The argument here<br />
is that policies which seek to stop or significantly reduce<br />
such flows are doomed to fail. Experience all over the<br />
world is that many young people at this stage <strong>of</strong> the<br />
lifecycle will leave peripheral areas for large<br />
metropolitan centres in large numbers. This is partly<br />
associated with seeking further education or competing<br />
in a more diverse labour market with greater<br />
opportunity. However, it is also associated with lifestyle<br />
preference, bright lights, seeking adventure <strong>and</strong> a desire<br />
to enhance one’s experience. This should not be<br />
suppressed among young <strong>Australia</strong>ns living in regional<br />
<strong>and</strong> peripheral areas. They shall not just be allowed, but<br />
indeed, be encouraged to compete in national <strong>and</strong><br />
global labour markets.<br />
What <strong>of</strong> the vacuum left by young, skilled, educated<br />
young people with significant social <strong>and</strong> human capital?<br />
If we should not be seeking to stop this outflow, how can<br />
it be filled? The answer here also lies in migration but in<br />
taking steps to encourage inmigration. In saying this,<br />
however, we must be mindful <strong>of</strong> the findings <strong>of</strong> the<br />
Grattan Institute study (Daley <strong>and</strong> Lancy, 2011) that<br />
regional areas very considerably in their potential for<br />
sustained economic growth. Any intervention policy to<br />
facilitate inmigration must be limited to areas <strong>of</strong> real<br />
economic potential in which newcomers can be readily<br />
absorbed in jobs which make use <strong>of</strong> their particular skills<br />
<strong>and</strong> abilities. As Daley <strong>and</strong> Lancy (2011, 3) have<br />
conclusively demonstrated, ‘regional equity’ approaches<br />
have failed:<br />
‘Local job attraction schemes, regional<br />
universities, small scale roads <strong>and</strong> major<br />
infrastructure are all expensive but they do not<br />
materially accelerate slow growing regions. By<br />
not investing in regions where we can get the<br />
best return for our taxpayer dollars we sacrifice<br />
higher overall productivity <strong>and</strong> economic<br />
growth’.<br />
As they also point out, this does not mean ignoring areas<br />
with little or no real potential for economic growth. As<br />
they point out (Daley <strong>and</strong> Lancy, 2011, 3):<br />
‘Smaller <strong>and</strong> slower growing parts <strong>of</strong> rural <strong>and</strong><br />
regional <strong>Australia</strong> remain great places to live <strong>and</strong><br />
should not be left without services that increase<br />
wellbeing – such as schools, hospitals, transport<br />
<strong>and</strong> other community facilities. In many cases<br />
these services are what regional development<br />
policies are really funding. However, these<br />
should be clearly recognised as subsidies to be<br />
justified on equity or social grounds, rather than<br />
hoping that they will generate self-sustaining<br />
economic growth’.<br />
In areas <strong>of</strong> substantial real economic potential, however,<br />
undoubtedly the net loss <strong>of</strong> talented young people does<br />
represent a significant barrier to development <strong>and</strong> there<br />
is a need to facilitate inmigration to fill the vacuum the<br />
outmigrants have left <strong>and</strong> to provide the types <strong>of</strong><br />
workers who are needed to develop the full potential <strong>of</strong><br />
local resources <strong>and</strong> opportunities. What are the types <strong>of</strong><br />
interventions relating to migration which should be<br />
considered?<br />
RETURN MIGRATION<br />
One <strong>of</strong> the key strategies to be considered to combat the<br />
loss <strong>of</strong> young adults through regional outmigration is<br />
return migration. A ‘Bringing Them Back Home’ program<br />
should be part <strong>of</strong> any regional migration policy. The<br />
fundamentals <strong>of</strong> such a policy are as follows:<br />
Research indicates that once young people enter the<br />
early family formation stages <strong>of</strong> the lifecycle (30s<br />
<strong>and</strong> early 40s) their preferences for living areas <strong>of</strong>ten<br />
change. Closeness to direct family, good schools, a<br />
good health system, a secure environment, family<br />
housing etc. <strong>of</strong>ten replace night life options, high<br />
density housing, café society, international city as<br />
priorities in deciding where to live. A longst<strong>and</strong>ing<br />
finding <strong>of</strong> migration between rural <strong>and</strong> urban areas
- 6 -<br />
<br />
<br />
<br />
<br />
<br />
<br />
in <strong>Australia</strong> (Hugo, 1971) is that there is a significant,<br />
although smaller, return migration counterflow to<br />
the stream <strong>of</strong> young outmigrants.<br />
People from regional areas will not always respond<br />
to those changes by returning to their home areas.<br />
They <strong>of</strong>ten need to be presented with a real<br />
opportunity to actualise these preferences.<br />
To return they must be presented with high quality<br />
education, health <strong>and</strong> recreation choices for their<br />
children, a relevant properly renumerated job <strong>and</strong><br />
appropriate housing. However, they are much<br />
easier to attract to a regional area than people<br />
without social connections. Nevertheless, most will<br />
not come back unless the key elements <strong>of</strong> jobs <strong>and</strong><br />
services are there.<br />
These are a few examples <strong>of</strong> such policies to build<br />
upon but some attempts have been made in the<br />
United States (e.g. DeJong <strong>and</strong> Klein, 1999;<br />
Kenworthy, 2000).<br />
Identifying potential returnees can involve parents in<br />
the home community.<br />
Return migration strategies <strong>of</strong>ten are best focused<br />
on key individuals with particular skills needed for<br />
regional development.<br />
These policies can be equally applied to former<br />
residents, not only in capital cities but also overseas<br />
(Hugo, 2011a).<br />
REGIONAL RELOCATION<br />
An irony in <strong>Australia</strong> is the high level <strong>of</strong> personal mobility<br />
but the difficulty experienced in recruiting labour,<br />
especially skilled labour, in many regional areas. In<br />
recent years this has been especially highlighted in<br />
regional Queensl<strong>and</strong> <strong>and</strong> Western <strong>Australia</strong>. This is<br />
despite the high levels <strong>of</strong> displacement <strong>of</strong> semi-skilled<br />
<strong>and</strong> skilled workers from the contemporary closure <strong>of</strong><br />
many manufacturing enterprises in southeastern<br />
<strong>Australia</strong>. The ‘Patchwork Economy’ <strong>of</strong> contemporary<br />
<strong>Australia</strong> shows considerable spatial variation in the<br />
buoyancy <strong>of</strong> local economies <strong>and</strong> in the opportunities in<br />
local labour markets.<br />
It is interesting, in a country where so much public policy<br />
effort is directed at meeting national skilled labour<br />
shortages through international migration, there has<br />
been little effort to use migration policy to cope with<br />
labour shortages in particular regional areas. It may be<br />
that there is scope for internal migration initiatives<br />
which facilitate <strong>and</strong> encourage migration where there<br />
are labour shortages which are a barrier to regional<br />
development.<br />
Such efforts should take cognisance <strong>of</strong> what is known<br />
about internal migration in <strong>Australia</strong>. As discussed in the<br />
previous sections there are a number <strong>of</strong> factors which<br />
need to be considered if migration is to be encouraged:<br />
It is <strong>of</strong>ten the case that young singles may not be<br />
readily attracted to regional areas given their<br />
preference for the café society lifecycle <strong>of</strong> inner<br />
capital cities. On the other h<strong>and</strong>, young families may<br />
well be attracted.<br />
Jobs are not enough to attract internal migrants to<br />
regional areas. They are a necessary but not<br />
sufficient condition for internal migration for young<br />
families. An appropriate job with an appropriate<br />
level <strong>of</strong> remuneration is necessary but what are the<br />
types <strong>of</strong> things which will actually trigger the<br />
movement? It is clear that quality education <strong>and</strong><br />
other services (especially health) for families are a<br />
sine qua non for family migration, especially for<br />
skilled workers. Quality <strong>of</strong> life, security, recreation<br />
opportunities, social support etc. are very important<br />
<strong>and</strong> can be a strength for regional areas seeking to<br />
attract internal migrants.<br />
Retirement migration has been seen in <strong>Australia</strong> by<br />
some regional communities as being inimical to<br />
regional development. Older people are perceived<br />
as consumers <strong>of</strong> resources rather than economic<br />
contributors. However, research does not support<br />
that. Retirement migrants are overwhelmingly the<br />
‘young aged’, they are selectively drawn from high<br />
income groups <strong>and</strong> they <strong>of</strong>ten have considerable<br />
skills <strong>and</strong> qualities which can become an important<br />
element in the social <strong>and</strong> economic life <strong>of</strong><br />
communities. They can <strong>and</strong> do contribute to the<br />
economic <strong>and</strong> social sustainability <strong>of</strong> regional<br />
communities.<br />
Housing is a crucial element in regional migration<br />
decisions, especially for family migration. Housing<br />
affordability <strong>and</strong> shortage are seen in <strong>Australia</strong> as a<br />
problem <strong>of</strong> our major cities but they represent<br />
considerable barriers to family migration to regional<br />
areas.<br />
<strong>Australia</strong>n Population <strong>and</strong><br />
<strong>Migration</strong> Research Centre<br />
http://www.adelaide.edu.au/apmrc/<br />
School <strong>of</strong> Social Sciences<br />
Room G17, Ground Floor, Napier Building<br />
The <strong>University</strong> <strong>of</strong> <strong>Adelaide</strong><br />
South <strong>Australia</strong> 5005<br />
Telephone: +61 8 8313 3900<br />
Fax: +61 8 8313 3498