Lasius neglectus (A) PEST INFORMATION - Biosecurity New Zealand
Lasius neglectus (A) PEST INFORMATION - Biosecurity New Zealand
Lasius neglectus (A) PEST INFORMATION - Biosecurity New Zealand

You also want an ePaper? Increase the reach of your titles
YUMPU automatically turns print PDFs into web optimized ePapers that Google loves.
INVASIVE ANT RISK ASSESSMENT • <strong>Lasius</strong> <strong>neglectus</strong><br />
Climate similarity scores<br />
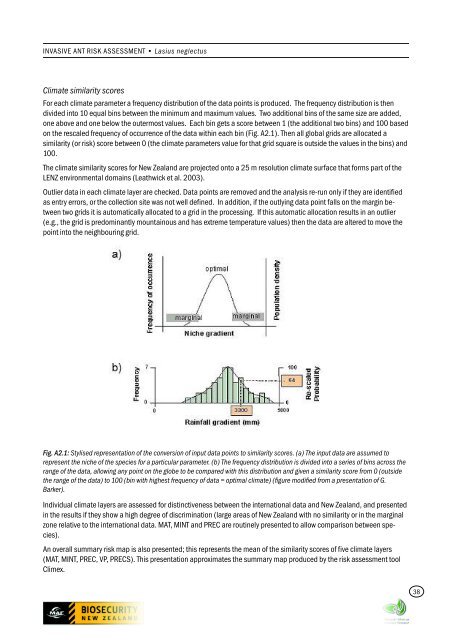
For each climate parameter a frequency distribution of the data points is produced. The frequency distribution is then<br />
divided into 10 equal bins between the minimum and maximum values. Two additional bins of the same size are added,<br />
one above and one below the outermost values. Each bin gets a score between 1 (the additional two bins) and 100 based<br />
on the rescaled frequency of occurrence of the data within each bin (Fig. A2.1). Then all global grids are allocated a<br />
similarity (or risk) score between 0 (the climate parameters value for that grid square is outside the values in the bins) and<br />
100.<br />
The climate similarity scores for <strong>New</strong> <strong>Zealand</strong> are projected onto a 25 m resolution climate surface that forms part of the<br />
LENZ environmental domains (Leathwick et al. 2003).<br />
Outlier data in each climate layer are checked. Data points are removed and the analysis re-run only if they are identified<br />
as entry errors, or the collection site was not well defined. In addition, if the outlying data point falls on the margin between<br />
two grids it is automatically allocated to a grid in the processing. If this automatic allocation results in an outlier<br />
(e.g., the grid is predominantly mountainous and has extreme temperature values) then the data are altered to move the<br />
point into the neighbouring grid.<br />
Fig. A2.1: Stylised representation of the conversion of input data points to similarity scores. (a) The input data are assumed to<br />
represent the niche of the species for a particular parameter. (b) The frequency distribution is divided into a series of bins across the<br />
range of the data, allowing any point on the globe to be compared with this distribution and given a similarity score from 0 (outside<br />
the range of the data) to 100 (bin with highest frequency of data = optimal climate) (figure modified from a presentation of G.<br />
Barker).<br />
Individual climate layers are assessed for distinctiveness between the international data and <strong>New</strong> <strong>Zealand</strong>, and presented<br />
in the results if they show a high degree of discrimination (large areas of <strong>New</strong> <strong>Zealand</strong> with no similarity or in the marginal<br />
zone relative to the international data. MAT, MINT and PREC are routinely presented to allow comparison between species).<br />
An overall summary risk map is also presented; this represents the mean of the similarity scores of five climate layers<br />
(MAT, MINT, PREC, VP, PRECS). This presentation approximates the summary map produced by the risk assessment tool<br />
Climex.<br />
38