Fatalities Associated with Ingestion of Diethylene Glycol ...
Fatalities Associated with Ingestion of Diethylene Glycol ...
Fatalities Associated with Ingestion of Diethylene Glycol ...

You also want an ePaper? Increase the reach of your titles
YUMPU automatically turns print PDFs into web optimized ePapers that Google loves.
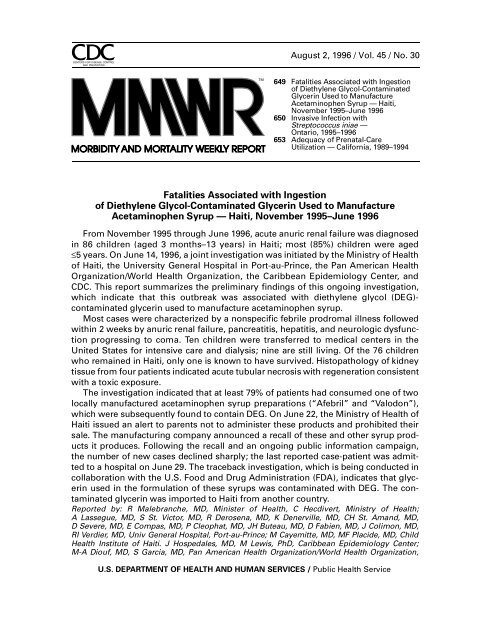
August 2, 1996 / Vol. 45 / No. 30<br />
649 <strong>Fatalities</strong> <strong>Associated</strong> <strong>with</strong> <strong>Ingestion</strong><br />
<strong>of</strong> <strong>Diethylene</strong> <strong>Glycol</strong>-Contaminated<br />
Glycerin Used to Manufacture<br />
Acetaminophen Syrup — Haiti,<br />
November 1995–June 1996<br />
650 Invasive Infection <strong>with</strong><br />
Streptococcus iniae —<br />
Ontario, 1995–1996<br />
653 Adequacy <strong>of</strong> Prenatal-Care<br />
Utilization — California, 1989–1994<br />
<strong>Fatalities</strong> <strong>Associated</strong> <strong>with</strong> <strong>Ingestion</strong><br />
<strong>of</strong> <strong>Diethylene</strong> <strong>Glycol</strong>-Contaminated Glycerin Used to Manufacture<br />
Acetaminophen Syrup — Haiti, November 1995–June 1996<br />
<strong>Diethylene</strong> From November <strong>Glycol</strong> 1995 Contaminated through June Glycerin 1996, — acute Continued anuric renal failure was diagnosed<br />
in 86 children (aged 3 months–13 years) in Haiti; most (85%) children were aged<br />
≤5 years. On June 14, 1996, a joint investigation was initiated by the Ministry <strong>of</strong> Health<br />
<strong>of</strong> Haiti, the University General Hospital in Port-au-Prince, the Pan American Health<br />
Organization/World Health Organization, the Caribbean Epidemiology Center, and<br />
CDC. This report summarizes the preliminary findings <strong>of</strong> this ongoing investigation,<br />
which indicate that this outbreak was associated <strong>with</strong> diethylene glycol (DEG)-<br />
contaminated glycerin used to manufacture acetaminophen syrup.<br />
Most cases were characterized by a nonspecific febrile prodromal illness followed<br />
<strong>with</strong>in 2 weeks by anuric renal failure, pancreatitis, hepatitis, and neurologic dysfunction<br />
progressing to coma. Ten children were transferred to medical centers in the<br />
United States for intensive care and dialysis; nine are still living. Of the 76 children<br />
who remained in Haiti, only one is known to have survived. Histopathology <strong>of</strong> kidney<br />
tissue from four patients indicated acute tubular necrosis <strong>with</strong> regeneration consistent<br />
<strong>with</strong> a toxic exposure.<br />
The investigation indicated that at least 79% <strong>of</strong> patients had consumed one <strong>of</strong> two<br />
locally manufactured acetaminophen syrup preparations (“Afebril” and “Valodon”),<br />
which were subsequently found to contain DEG. On June 22, the Ministry <strong>of</strong> Health <strong>of</strong><br />
Haiti issued an alert to parents not to administer these products and prohibited their<br />
sale. The manufacturing company announced a recall <strong>of</strong> these and other syrup products<br />
it produces. Following the recall and an ongoing public information campaign,<br />
the number <strong>of</strong> new cases declined sharply; the last reported case-patient was admitted<br />
to a hospital on June 29. The traceback investigation, which is being conducted in<br />
collaboration <strong>with</strong> the U.S. Food and Drug Administration (FDA), indicates that glycerin<br />
used in the formulation <strong>of</strong> these syrups was contaminated <strong>with</strong> DEG. The contaminated<br />
glycerin was imported to Haiti from another country.<br />
Reported by: R Malebranche, MD, Minister <strong>of</strong> Health, C Hecdivert, Ministry <strong>of</strong> Health;<br />
A Lassegue, MD, S St. Victor, MD, R Derosena, MD, K Denerville, MD, CH St. Amand, MD,<br />
D Severe, MD, E Compas, MD, P Cleophat, MD, JH Buteau, MD, D Fabien, MD, J Colimon, MD,<br />
RI Verdier, MD, Univ General Hospital, Port-au-Prince; M Cayemitte, MD, MF Placide, MD, Child<br />
Health Institute <strong>of</strong> Haiti. J Hospedales, MD, M Lewis, PhD, Caribbean Epidemiology Center;<br />
M-A Diouf, MD, S Garcia, MD, Pan American Health Organization/World Health Organization,<br />
U.S. DEPARTMENT OF HEALTH AND HUMAN SERVICES / Public Health Service
650 MMWR August 2, 1996<br />
<strong>Diethylene</strong> <strong>Glycol</strong>-Contaminated Glycerin — Continued<br />
Haiti. R Parekh, MD, T Bunchman, MD, Univ <strong>of</strong> Michigan, Ann Arbor. L Racusen, MD, Johns<br />
Hopkins Univ, Baltimore. Food and Drug Administration. Health Studies Br, Div <strong>of</strong> Environmental<br />
Hazards and Health Effects, National Center for Environmental Health; Childhood and<br />
Respiratory Diseases Br, Div <strong>of</strong> Bacterial and Mycotic Diseases, National Center for Infectious<br />
Diseases, CDC.<br />
Editorial Note: DEG, a known nephrotoxin and hepatotoxin, is used in industrial solvents<br />
and antifreeze. The mechanism <strong>of</strong> toxicity is unknown but probably is different<br />
from oxalate toxicity associated <strong>with</strong> ethylene glycol poisoning. Management <strong>of</strong> patients<br />
<strong>with</strong> DEG toxicity relies on early diagnosis <strong>with</strong> supportive and symptomatic<br />
care for multi-organ failure. Although data on outcome are limited, survival <strong>with</strong> resolution<br />
<strong>of</strong> signs and symptoms has been reported (1 ).<br />
The outbreak in Haiti is the fourth large outbreak associated <strong>with</strong> pharmaceutical<br />
products contaminated <strong>with</strong> DEG. Previous outbreaks (in the United States, Nigeria,<br />
and Bangladesh) resulted from ingestion <strong>of</strong> DEG-contaminated sulfanilamide or<br />
acetaminophen syrups (1–3 ). In two <strong>of</strong> the outbreaks, propylene glycol was the contaminated<br />
raw material, and in a third, DEG was used as a diluent. A cluster <strong>of</strong><br />
14 deaths occurred in India among patients in one hospital who ingested DEGcontaminated<br />
glycerin used for control <strong>of</strong> intracranial pressure (4 ).<br />
Glycerin is used as a sweetener in formulations <strong>of</strong> many pharmaceutical syrups<br />
ingested orally. Complexities in the distribution <strong>of</strong> glycerin and other pharmaceutical<br />
raw materials that may involve many handlers (importers and exporters) underscore<br />
the need for manufacturers to adequately identify raw materials and end products.<br />
However, infrared spectroscopy tests required by the United States Pharmocopoeia<br />
(USP) would not have detected this DEG-contaminated glycerin syrup. A gas chromatography<br />
method capable <strong>of</strong> separating and detecting glycerin, ethylene glycol, and<br />
DEG can be used to determine that glycerin is free <strong>of</strong> these contaminants. The outbreak<br />
in Haiti emphasizes the need for pharmaceutical producers worldwide to be<br />
aware <strong>of</strong> possible contamination <strong>of</strong> glycerin and other raw materials <strong>with</strong> DEG and to<br />
use appropriate quality-control measures to identify and prevent potential contamination.<br />
References<br />
1. Hanif M, Mobarak MR, Ronan A, Rahman D, Donovan JJ, Bennish ML. Fatal renal failure caused<br />
by diethylene glycol in paracetamol elixir: the Bangladesh epidemic. Br Med J 1995;311:88–91.<br />
2. Okuonghae HO, Ighogboja IS, Lawson JO, Nwana EJ. <strong>Diethylene</strong> glycol poisoning in Nigerian<br />
children. Ann Trop Paediatr 1992;12:235–8.<br />
3. Geiling EMK, Cannon PR. Pathologic effects <strong>of</strong> elixir <strong>of</strong> sulfanilamide (diethylene glycol) poisoning.<br />
A clinical and experimental correlation: final report. JAMA 1938;111:919–26.<br />
4. Pandya SK. An unmitigated tragedy. Br Med J 1988;297:117–9.<br />
<strong>Diethylene</strong> <strong>Glycol</strong>-Contaminated Glycerin — Continued<br />
Invasive Infection <strong>with</strong> Streptococcus iniae —<br />
Ontario, 1995–1996<br />
During December 1995–February 1996, four cases <strong>of</strong> a bacteremic illness (three accompanied<br />
by cellulitis and the fourth <strong>with</strong> infective endocarditis, meningitis, and<br />
probable septic arthritis) were identified among patients at a hospital in Ontario.<br />
Streptococcus iniae, a fish pathogen not previously reported as a cause <strong>of</strong> illness in<br />
humans (1–3 ), was isolated from all four patients. All four patients were <strong>of</strong> Chinese
Vol. 45 / No. 30 MMWR 651<br />
Streptococcus iniae — Continued<br />
descent had a history <strong>of</strong> preparing fresh, whole fish; three patients for whom information<br />
was available had had an injury associated <strong>with</strong> preparation <strong>of</strong> fresh, whole fish<br />
purchased locally. This report summarizes information about these cases and presents<br />
preliminary findings <strong>of</strong> an ongoing investigation by health <strong>of</strong>ficials in Canada<br />
(4 ), which suggests that S. iniae may be an emerging pathogen associated <strong>with</strong> injury<br />
while preparing fresh aquacultured fish.<br />
Case Reports<br />
The first three cases occurred during December 15–20, 1995, among previously<br />
healthy women who ranged in age from 40–74 years. Each had a history <strong>of</strong> injury to<br />
the hand while preparing fresh, whole, aquacultured fish. The first case-patient reported<br />
a puncture wound to her hand <strong>with</strong> a fish bone while preparing a newly purchased<br />
tilapia (Oreochromis species)*, a freshwater fish marketed primarily as whole<br />
fish; the second lacerated the skin over her finger <strong>with</strong> a knife that had just been used<br />
to cut and clean a freshwater fish <strong>of</strong> unknown type; and the third punctured her finger<br />
<strong>with</strong> the dorsal fin while scaling a fresh tilapia.<br />
The period from injury to onset <strong>of</strong> symptoms for the three cases ranged from<br />
16 hours to 2 days. At the time <strong>of</strong> hospitalization, physical examination findings included<br />
fever (range: 100.4 F [38.0 C] to 101.3 F [38.5 C]) and cellulitis <strong>with</strong> lymphangitic<br />
spread proximate to the site <strong>of</strong> injury. Leukocyte counts ranged from 12,900/mm 3 to<br />
16,900/mm 3 <strong>with</strong> an increased proportion <strong>of</strong> neutrophils. Blood cultures from all three<br />
patients were positive for S. iniae, and treatment <strong>with</strong> beta-lactam antibiotics or clindamycin<br />
resulted in complete resolution <strong>of</strong> all manifestations <strong>of</strong> illness.<br />
The fourth patient, a 77-year-old man, was admitted to the hospital on February 1,<br />
1996, because <strong>of</strong> a 1-week history <strong>of</strong> increasing knee pain, intermittent sweats, fever,<br />
dyspnea, and confusion. Past medical history included diabetes mellitus, hypertension,<br />
rheumatic heart disease, chronic renal failure, Paget’s disease, and osteoarthritis.<br />
Approximately 10 days before admission, he had prepared a fresh tilapia, although<br />
it was unknown whether he incurred an injury while preparing the fish. Findings on<br />
examination included temperature <strong>of</strong> 96.1 F (35.6 C) and a large effusion and warmth<br />
<strong>of</strong> the right knee <strong>with</strong>out overlying cellulitis. New murmurs <strong>of</strong> aortic insufficiency and<br />
mitral regurgitation were noted. While in the emergency department, he had a respiratory<br />
arrest and was intubated; treatment included administration <strong>of</strong> a beta-lactam<br />
agent and erythromycin. The leukocyte count on admission was 25,200/mm 3 <strong>with</strong> 95%<br />
neutrophils. Ten hours following admission, his knee was aspirated, and a lumbar<br />
puncture was performed. Analysis <strong>of</strong> the joint fluid included a leukocyte count <strong>of</strong><br />
72,000/mm 3 but no evidence <strong>of</strong> crystals. Analysis <strong>of</strong> the cerebrospinal fluid (CSF) included<br />
a leukocyte count <strong>of</strong> 87/mm 3 (54% neutrophils), a glucose <strong>of</strong> 14 mg/dL, and a<br />
protein <strong>of</strong> 320 mg/dL. Cultures <strong>of</strong> samples <strong>of</strong> synovial fluid and CSF were negative, but<br />
blood cultures yielded S. iniae. Based on the clinical and laboratory findings, and a<br />
transesophageal echocardiogram that documented a mitral-valve vegetation, S. iniae<br />
endocarditis and meningitis were diagnosed. Treatment <strong>with</strong> beta-lactam antibiotics<br />
was continued, and he recovered.<br />
Microbiology<br />
Isolates from all patients grew on sheep-blood agar incubated in room air at 95.0 F<br />
(35 C), appeared as gram-positive cocci in short chains or pairs, and were catalase-<br />
*Tilapia is one <strong>of</strong> the fastest growing aquaculture industries in the United States and the world.
652 MMWR August 2, 1996<br />
Streptococcus iniae — Continued<br />
negative. During the first 18 hours <strong>of</strong> incubation, colonies were alpha-hemolytic and<br />
initially were identified as viridans streptococci. Further testing conducted by reference<br />
laboratories identified them as S. iniae. Three strains were resistant to bacitracin,<br />
and the fourth was susceptible. Pulsed-field gel electrophoresis patterns <strong>of</strong> chromosomal<br />
Sma1 digests <strong>of</strong> all four isolates were identical. Microbroth-dilution testing for<br />
susceptibility indicated that all isolates were susceptible to beta-lactams, macrolides,<br />
trimethoprim-sulfamethoxazole, and tetracycline.<br />
Follow-Up Investigation<br />
All four patients had prepared fresh, whole fish, three <strong>of</strong> which were known to be<br />
tilapia, that had been purchased from different stores. In two cases, the fish were<br />
taken live from holding tanks in different fish markets. Surface cultures were obtained<br />
from four fresh tilapia purchased at selected fish markets in the community during<br />
March 1996. Cultures from three <strong>of</strong> the four fish yielded S. iniae; however, pulsed-field<br />
gel electrophoresis patterns were different for each, and none matched the outbreak<br />
strain. None <strong>of</strong> the vendors at the markets where the fish were purchased reported<br />
that the fish appeared to be sick. Fresh, whole tilapia sold in Ontario were imported<br />
from U.S. fish farms.<br />
The ongoing epidemiologic and microbiologic investigation includes the establishment<br />
<strong>of</strong> surveillance for cases <strong>of</strong> upper-extremity cellulitis in patients visiting the<br />
emergency departments <strong>of</strong> 10 Toronto-area hospitals and use <strong>of</strong> a standardized questionnaire<br />
for interviewing patients. In addition, to better characterize the prevalence <strong>of</strong><br />
S. iniae in fish, samples from live, aquacultured fish imported into Canada are being<br />
collected and tested by Canadian health <strong>of</strong>ficials for S. iniae.<br />
Reported by: M Weinstein, MD, DE Low, MD, A McGeer, MD, B Willey, Mount Sinai Hospital<br />
and Princess Margaret Hospital, Univ <strong>of</strong> Toronto, and Canadian Bacterial Diseases Network,<br />
Toronto; D Rose, MD, M Coulter, P Wyper, Scarborough Grace Hospital, Scarborough; A Borczyk,<br />
MSc, Public Health Laboratory <strong>of</strong> Ontario, Toronto; M Lovgren, National Reference Center for<br />
Streptococcus, Laboratory Center for Disease Control, Edmonton, Alberta, Canada. Childhood<br />
and Respiratory Diseases Br, Div <strong>of</strong> Bacterial and Mycotic Diseases, National Center for Infectious<br />
Diseases, CDC.<br />
Editorial Note: Because <strong>of</strong> recent increases in aquaculture, the occurrence <strong>of</strong> infections<br />
caused by a variety <strong>of</strong> streptococcal species is increasing among some saltwater<br />
and freshwater fish. S. iniae was first recognized in 1972 as a cause <strong>of</strong> disease<br />
in an Amazon freshwater dolphin, Inia ge<strong>of</strong>frensis. In 1986, S. iniae (reported as<br />
S. shiloi ) was identified as a cause <strong>of</strong> meningoencephalitis among tilapia and trout in<br />
Israel; the organism was identified subsequently among tilapia in the United States<br />
and Taiwan. Infections <strong>with</strong> S. iniae may be asymptomatic or may cause disease associated<br />
<strong>with</strong> death rates <strong>of</strong> 30% to 50% in affected fishponds (2 ).<br />
The first recognized case <strong>of</strong> S. iniae infection in humans occurred in Texas in 1991,<br />
and a second case occurred in Ottawa, Canada, in 1994; however, potential sources for<br />
both cases were not determined. The pulsed-field gel electrophoresis digest from the<br />
isolates causing both <strong>of</strong> these infections was identical to the isolates <strong>of</strong> the cases described<br />
in this report, except for a one-band shift.<br />
Whether the recent cases <strong>of</strong> S. iniae infection represent the emergence <strong>of</strong> a new<br />
human pathogen or previously unrecognized disease is unclear. S. iniae infection<br />
may not be recognized because cultures rarely are obtained from patients <strong>with</strong> wound<br />
infections or cellulitis and, if cultured, viridans streptococcus isolates may be consid-
Vol. 45 / No. 30 MMWR 653<br />
Streptococcus iniae — Continued<br />
ered contaminants and not be further characterized. In addition, it is unclear whether<br />
human infections may be caused by any S. iniae strain or whether the strain implicated<br />
in all six <strong>of</strong> the cases is more virulent than other strains. Finally, because all four<br />
persons described in this report were <strong>of</strong> Chinese descent, potential racial/ethnic associations<br />
<strong>with</strong> risk for this infection should be further considered. Additional culture<br />
surveys and laboratory studies <strong>of</strong> tilapia should assist in characterizing the diversity<br />
and virulence among S. iniae.<br />
To more clearly define the role <strong>of</strong> S. iniae as a human pathogen, physicians are<br />
encouraged to obtain blood and wound cultures from persons <strong>with</strong> upper-extremity<br />
cellulitis and to seek a history <strong>of</strong> recently having prepared a fresh, whole fish. Microbiology<br />
laboratories should be able to make a preliminary identification <strong>of</strong> S. iniae<br />
based on several distinguishing phenotypic characteristics. † Possible S. iniae isolates<br />
can be confirmed at the CDC Streptococcal Reference Laboratory and tested to determine<br />
whether they are the same strain as identified from the six cases <strong>of</strong> human disease.<br />
References<br />
1. Eldar A, Frelier P, Assenta L, et al. Streptococcus shiloi, the name for an agent causing septicemic<br />
infection in fish is a junior synonym <strong>of</strong> Streptococcus iniae. Int J Syst Bacteriol<br />
1995;45:840–2.<br />
2. Eldar A, Bejerano Y, Bercovier H. Streptococcus shiloi, and Streptococcus difficile: two new<br />
streptococcal species causing a meningoencephalitis in fish. Curr Microbiol 1994;28:139–43.<br />
3. Perera R, Johnson S, Collins M, et al. Streptococcus iniae associated <strong>with</strong> mortality <strong>of</strong> Tilapia<br />
nilotica and T. aurea hybrids. Journal <strong>of</strong> Aquatic Animal Health 1994;6:335–40.<br />
4. Weinstein M, Low D, McGeer A, et al. Invasive infection due to Streptococcus iniae: a new<br />
or previously unrecognized disease—Ontario, 1995–1996. Canada Communicable Disease Report<br />
1996;22:129–32.<br />
5. Pier GB, Madin SH. Streptococcus iniae sp. nov., a beta-hemolytic streptococcus isolated from<br />
an Amazon freshwater dolphin, Inia ge<strong>of</strong>frensis. Int J Syst Bacteriol 1976;26:545–53.<br />
6. Pier GB, Madin SH, Al-Nakeeb S. Isolation and characterization <strong>of</strong> a second isolate <strong>of</strong> Streptococcus<br />
iniae. Int J Syst Bacteriol 1978;28:311–4.<br />
† S. iniae is beta-hemolytic; however, some strains may appear to be alpha-hemolytic because<br />
a narrow zone <strong>of</strong> beta-hemolysis is surrounded by a larger zone <strong>of</strong> alpha-hemolysis (5,6 ).<br />
Beta-hemolysis always is observed under anaerobic incubation and in the area <strong>of</strong> stabs in the<br />
agar. S. iniae is nongroupable <strong>with</strong> Lancefield group A through U antisera. In addition, the<br />
pyrrolidonylarylaminase and leucine aminopeptidase tests are positive, the Voges-Proskauer<br />
test is negative, and the organism may have variable susceptibility to bacitracin.<br />
Adequacy <strong>of</strong> Prenatal-Care Utilization — California, 1989–1994<br />
A Prenatal-Care national health Utilization objective — for Continued the year 2000 is to increase to at least 90% the proportion<br />
<strong>of</strong> pregnant women who receive prenatal care during the first trimester <strong>of</strong><br />
pregnancy (objective 14.11) (1 ). Adequate prenatal care is believed to result in better<br />
pregnancy outcomes, including reduced maternal and infant morbidity and mortality<br />
and reduced risk for preterm delivery and for low birthweight (
654 MMWR August 2, 1996<br />
Prenatal-Care Utilization — Continued<br />
<strong>of</strong> prenatal-care utilization. To calculate rates <strong>of</strong> prenatal-care utilization for California<br />
during 1989–1994, the California Department <strong>of</strong> Health Services (CDHS) analyzed data<br />
from birth certificates using a more comprehensive measure <strong>of</strong> prenatal-care utilization.<br />
This report presents annual rates <strong>of</strong> adequate prenatal-care utilization (APNCU)<br />
for California during 1989–1994 (the most recent year for which complete data were<br />
available), compares these data <strong>with</strong> the year 2000 objective for prenatal-care utilization,<br />
and examines rates <strong>of</strong> APNCU in California by payment source (for prenatal care)<br />
for 1989, 1992, and 1994.<br />
CDHS defines APNCU as care initiated during the first 4 months <strong>of</strong> pregnancy, followed<br />
by ≥80% <strong>of</strong> the expected total number <strong>of</strong> visits recommended by the American<br />
College <strong>of</strong> Obstetricians and Gynecologists (ACOG), adjusted for the length <strong>of</strong> gestation<br />
(3 ). For a full-term (40-week) pregnancy <strong>with</strong> no complications, ACOG recommends<br />
prenatal-care visits “...every 4 weeks for the first 28 weeks <strong>of</strong> pregnancy, every<br />
2–3 weeks until 36 weeks <strong>of</strong> gestation, and weekly, thereafter, although flexibility is<br />
desirable” (4 ). Birth certificate data for live-born infants in California were used to<br />
calculate annual APNCU rates by accounting for both the time <strong>of</strong> prenatal-care initiation<br />
and the number <strong>of</strong> visits relative to gestational age (3 ). Information obtained<br />
from the birth certificate included prenatal-care utilization as self-reported by the<br />
mother and gestational age. Infants <strong>of</strong> women who had no prenatal care or for whom<br />
the source <strong>of</strong> payment for prenatal care was unknown were excluded from this analysis,<br />
accounting for approximately 1.8% <strong>of</strong> live-born infants in 1989, 1.3% in 1992, and<br />
1.6% in 1994. In addition, gestational age was missing for 3.1% <strong>of</strong> birth certificates in<br />
1989, 2.8% in 1992, and 3.1% in 1994; however, the algorithm used to calculate APNCU<br />
estimated gestational age from sex and birthweight data.<br />
During 1989–1994, the overall annual rate <strong>of</strong> prenatal-care initiation during the first<br />
trimester increased 6.9%, from 72.1 per 100 live-born infants to 77.1 per 100. In comparison,<br />
the rate <strong>of</strong> APNCU increased 18.2%, from 56.2 per 100 to 66.4 per 100, an<br />
annual rate <strong>of</strong> increase <strong>of</strong> 2.2 per 100 per year. In 1994, 16% <strong>of</strong> women in California<br />
who initiated prenatal care during the first trimester had
Vol. 45 / No. 30 MMWR 655<br />
Prenatal-Care Utilization — Continued<br />
TABLE 1. Prevalence rate <strong>of</strong> adequate prenatal-care utilization, by payment source and<br />
selected years — California, 1989–1994<br />
Source <strong>of</strong> payment/<br />
Year<br />
Total births<br />
<strong>with</strong>in payment source<br />
Births <strong>with</strong> adequate<br />
prenatal-care utilization*<br />
No. (%) No. (%)<br />
Uninsured †<br />
1989 85,407 15.3 27,789 32.5<br />
1992 38,027 6.4 15,742 41.4<br />
1994 24,909 4.5 10,520 42.2<br />
Health-maintenance<br />
organization<br />
1989 134,473 24.0 89,773 66.8<br />
1992 146,825 24.8 107,230 73.0<br />
1994 146,854 26.3 110,187 75.0<br />
Fee-for-service §<br />
1989 161,937 29.0 117,372 72.5<br />
1992 130,042 21.9 101,683 78.2<br />
1994 111,632 20.0 91,238 81.7<br />
Medi-Cal <br />
1989 154,660 27.7 64,929 42.0<br />
1992 257,683 43.5 127,424 49.5<br />
1994 259,643 46.5 147,078 56.7<br />
Other**<br />
1989 22,852 4.1 14,423 63.1<br />
1992 20,456 3.5 14,998 73.3<br />
1994 14,831 2.7 11,575 78.1<br />
Total ††<br />
1989 559,329 100.0 314,286 56.2<br />
1992 593,033 100.0 367,077 61.9<br />
1994 557,869 100.0 370,598 66.4<br />
*Care initiated during the first 4 months <strong>of</strong> pregnancy, followed by ≥80% <strong>of</strong> the total number<br />
<strong>of</strong> visits recommended by the American College <strong>of</strong> Obstetricians and Gynecologists,<br />
adjusted for the length <strong>of</strong> gestation (3 ).<br />
† Includes persons who self-paid, those not charged, and those who were indigent.<br />
§Non–health-maintenance organization private insurance.<br />
The state Medicaid program for California residents.<br />
**Includes Medicare, Workers’ Compensation, and other governmental and nongovernmental<br />
programs.<br />
†† Infants <strong>of</strong> women who had no prenatal care or for whom the source <strong>of</strong> payment for prenatal<br />
care was unknown were excluded from this analysis, accounting for approximately 1.8% <strong>of</strong><br />
live-born infants in 1989, 1.3% in 1992, and 1.6% in 1994.<br />
Reported by: S Kessler, MBA, Primary Care and Family Health, R Shah, MD, Maternal and Child<br />
Health Br, T Smith, MD, Perinatal Care Section, D Taylor, MA, California Dept <strong>of</strong> Health Svcs.<br />
Div <strong>of</strong> Reproductive Health, National Center for Chronic Disease Prevention and Health Promotion;<br />
Div <strong>of</strong> Applied Public Health Training (proposed), Epidemiology Program Office, CDC.<br />
Editorial Note: The findings in this report indicate that in California during 1989–1994,<br />
the rate <strong>of</strong> first-trimester initiation <strong>of</strong> prenatal care increased 6.9%; in contrast, the<br />
overall rate <strong>of</strong> APNCU increased 18.2%. The primary reason for the difference in rates<br />
is that first-trimester initiation addresses only the timing <strong>of</strong> prenatal-care initiation
656 MMWR August 2, 1996<br />
Prenatal-Care Utilization — Continued<br />
and, therefore, presents an incomplete assessment <strong>of</strong> prenatal-care utilization. If the<br />
trends in both rates continue until the year 2000, the rates <strong>of</strong> first-trimester initiation<br />
and APNCU should converge at 80 per 100 live-born infants. Although the rate <strong>of</strong> firsttrimester<br />
initiation was higher than the rate <strong>of</strong> APNCU in 1994, the trend toward decreasing<br />
differences in the rates indicates that, in 1994, among women who initiated<br />
prenatal care, a greater proportion had the appropriate number <strong>of</strong> prenatal-care visits<br />
recommended by ACOG than in 1989. The findings for California can not be generalized<br />
to the entire population <strong>of</strong> live-born infants in the United States; however, other<br />
states can use similar analyses to calculate more comprehensive measures <strong>of</strong> APNCU.<br />
In California, efforts to improve the availability and financial accessibility <strong>of</strong> prenatal<br />
care have included use <strong>of</strong> federal Medicaid options and state-based funding to<br />
nearly double Medi-Cal eligibility levels for health-care coverage for pregnant women<br />
since 1989 and to promote early, continuous, and comprehensive prenatal care. For<br />
example, eligibility requirements for coverage <strong>of</strong> pregnancy-related services under<br />
Medi-Cal were increased from 185% <strong>of</strong> the poverty level in 1989 to 200% in 1990. During<br />
the same period, implementation <strong>of</strong> several Medi-Cal obstetric initiatives improved<br />
provider participation and improved and expanded prenatal-care services to<br />
women in California. These initiatives include the BabyCal campaign, a statewide media<br />
effort promoting the importance <strong>of</strong> prenatal care and assistance in obtaining Medi-<br />
Cal; the Comprehensive Perinatal Services Program, a program that provides support<br />
services during prenatal care; and improved access to Medi-Cal through presumptive<br />
and continuous eligibility, waived asset tests, and reduced application paperwork. In<br />
addition, most (86%) women and children who are Medi-Cal beneficiaries in California<br />
are expected to be enrolled in some form <strong>of</strong> managed care by 1997.<br />
The year 2000 objective reflects only initiation <strong>of</strong> prenatal care during the first trimester;<br />
however, additional important factors include a minimum <strong>of</strong> 14 subsequent<br />
prenatal-care visits (for a full-term pregnancy), adjusted for the length <strong>of</strong> gestation<br />
(3 ). Although the definition <strong>of</strong> APNCU used in this report neither addresses the quality<br />
or content <strong>of</strong> the prenatal-care visit nor adjusts for maternal risk conditions (3 ), it does<br />
provide a readily available measure <strong>of</strong> APNCU. The findings <strong>of</strong> this report will be used<br />
in California for assessing the impact <strong>of</strong> changes in the health-care system on prenatal-care<br />
utilization.<br />
References<br />
1. Public Health Service. Healthy people 2000: national health promotion and disease prevention<br />
objectives—full report, <strong>with</strong> commentary. Washington, DC: US Department <strong>of</strong> Health and Human<br />
Services, Public Health Service, 1991; DHHS publication no. (PHS)91-50212.<br />
2. Office <strong>of</strong> Technology Assessment, US Congress. Healthy children: investing in the future. Washington,<br />
DC: US Congress, Office <strong>of</strong> Technology Assessment, 1988.<br />
3. Kotelchuck M. An evaluation <strong>of</strong> the Kessner adequacy <strong>of</strong> prenatal care index and a proposed<br />
adequacy <strong>of</strong> prenatal care utilization index. Am J Public Health 1994;84:1414–20.<br />
4. American Academy <strong>of</strong> Pediatrics/American College <strong>of</strong> Obstetricians and Gynecologists. Guidelines<br />
for perinatal care. 3rd ed. Washington, DC: American Academy <strong>of</strong> Pediatrics/American<br />
College <strong>of</strong> Obstetricians and Gynecologists, 1992:53.<br />
Prenatal-Care Utilization — Continued
Vol. 45 / No. 30 MMWR 657<br />
FIGURE I. Selected notifiable disease reports, comparison <strong>of</strong> 4-week totals ending<br />
July 27, 1996, <strong>with</strong> historical data — United States<br />
DISEASE DECREASE INCREASE<br />
Hepatitis A<br />
Hepatitis B<br />
Hepatitis, C/Non-A, Non-B<br />
Legionellosis<br />
Malaria<br />
Measles, Total<br />
Meningococcal Infections<br />
Mumps<br />
Pertussis<br />
CASES CURRENT<br />
4 WEEKS<br />
1,512<br />
589<br />
201<br />
49<br />
102<br />
40<br />
172<br />
28<br />
364<br />
Rabies, Animal<br />
Rubella<br />
AAAAAA<br />
AAAAAA<br />
AAAAAA<br />
AAAAAA<br />
AAAAAA<br />
456<br />
67<br />
0.125<br />
0.25<br />
0.5<br />
1<br />
2<br />
4<br />
Ratio (Log Scale) *<br />
AAAAAA<br />
AAAAAA<br />
AAAAAA<br />
Beyond Historical Limits<br />
*Ratio <strong>of</strong> current 4-week total to mean <strong>of</strong> 15 4-week totals (from previous, comparable, and<br />
subsequent 4-week periods for the past 5 years). The point where the hatched area begins is<br />
based on the mean and two standard deviations <strong>of</strong> these 4-week totals.<br />
TABLE I. Summary — cases <strong>of</strong> selected notifiable diseases, United States,<br />
cumulative, week ending July 27, 1996 (30th Week)<br />
Cum. 1996<br />
Cum. 1996<br />
Anthrax - HIV infection, pediatric* § 138<br />
Brucellosis 52 Plague -<br />
Cholera 2 Poliomyelitis, paralytic -<br />
Congenital rubella syndrome 1 Psittacosis 22<br />
Cryptosporidiosis* 972 Rabies, human -<br />
Diphtheria 2 Rocky Mountain spotted fever (RMSF) 275<br />
Encephalitis: California* 4 Streptococcal toxic-shock syndrome* 10<br />
eastern equine* 1 Syphilis, congenital** -<br />
St. Louis* - Tetanus 11<br />
western equine* - Toxic-shock syndrome 79<br />
Hansen Disease 57 Trichinosis 11<br />
Hantavirus pulmonary syndrome* † 9 Typhoid fever 178<br />
-: no reported cases<br />
*Not notifiable in all states.<br />
† Updated weekly from reports to the Division <strong>of</strong> Viral and Rickettsial Diseases, National Center for Infectious Diseases (NCID).<br />
§ Updated monthly to the Division <strong>of</strong> HIV/AIDS Prevention, National Center for HIV, STD, and TB Prevention (NCHSTP), last<br />
update June 25, 1996.<br />
Three suspected cases <strong>of</strong> polio <strong>with</strong> onset in 1996 have been reported to date.<br />
**Updated quarterly from reports to the Division <strong>of</strong> STD Prevention, NCHSTP. First quarter 1996 is not yet available.
658 MMWR August 2, 1996<br />
TABLE II. Cases <strong>of</strong> selected notifiable diseases, United States, weeks ending<br />
July 27, 1996, and July 29, 1995 (30th Week)<br />
Reporting Area<br />
Cum.<br />
1996<br />
AIDS*<br />
Cum.<br />
1995<br />
Chlamydia<br />
Cum.<br />
1996<br />
Escherichia<br />
coli O157:H7<br />
NETSS † PHLIS §<br />
Cum. Cum.<br />
1996 1996<br />
Gonorrhea<br />
Hepatitis<br />
C/NA,NB<br />
Legionellosis<br />
UNITED STATES 34,213 42,080 165,822 1,004 328 151,848 222,508 2,017 2,259 420 691<br />
NEW ENGLAND 1,391 2,092 9,533 137 21 4,130 4,296 65 75 20 14<br />
Maine 22 75 - 10 - 24 44 - - 1 4<br />
N.H. 42 59 397 12 5 80 69 3 11 - 1<br />
Vt. 10 16 - 11 6 34 30 25 7 2 -<br />
Mass. 648 922 3,810 60 10 1,245 1,527 32 55 11 8<br />
R.I. 94 144 1,158 7 - 292 288 5 2 6 1<br />
Conn. 575 876 4,168 37 - 2,455 2,338 - - N N<br />
MID. ATLANTIC 9,450 10,844 22,107 90 26 16,647 24,800 196 240 89 117<br />
Upstate N.Y. 1,164 1,272 N 55 12 3,460 4,802 163 119 28 30<br />
N.Y. City 5,299 5,643 9,512 4 - 4,931 10,223 1 1 1 3<br />
N.J. 1,796 2,544 2,332 31 5 2,526 2,226 - 99 7 19<br />
Pa. 1,191 1,385 10,263 N 9 5,730 7,549 32 21 53 65<br />
E.N. CENTRAL 2,777 3,280 23,545 262 95 24,044 44,800 273 181 121 199<br />
Ohio 622 670 11,474 68 33 8,362 14,376 18 6 52 94<br />
Ind. 393 335 5,785 30 19 3,827 5,242 7 1 27 45<br />
Ill. 1,202 1,394 1,447 118 16 9,588 11,203 44 53 9 21<br />
Mich. 407 667 U 46 27 U 10,202 204 121 26 21<br />
Wis. 153 214 4,839 N - 2,267 3,777 - - 7 18<br />
W.N. CENTRAL 820 963 13,675 207 78 6,673 11,333 71 40 24 47<br />
Minn. 157 218 - 75 38 U 1,668 1 2 2 -<br />
Iowa 57 53 2,305 57 23 595 798 36 7 5 14<br />
Mo. 402 421 7,208 26 - 4,629 6,483 20 13 6 13<br />
N. Dak. 8 4 2 8 6 1 17 - 4 - 3<br />
S. Dak. 8 9 689 7 - 95 111 - 1 2 -<br />
Nebr. 55 75 885 10 2 159 621 3 9 7 11<br />
Kans. 133 183 2,586 24 9 1,194 1,635 11 4 2 6<br />
S. ATLANTIC 8,571 10,712 30,851 50 13 56,632 61,838 141 133 77 109<br />
Del. 167 191 - - 1 816 1,206 1 - 7 1<br />
Md. 1,026 1,416 3,549 N 3 7,410 7,193 1 6 9 20<br />
D.C. 591 639 N - - 2,566 2,595 - - 6 4<br />
Va. 546 880 6,240 N 2 5,430 6,170 8 9 12 8<br />
W. Va. 64 46 - N 2 276 470 7 26 1 3<br />
N.C. 464 586 - 14 2 10,819 13,808 30 33 6 23<br />
S.C. 443 569 - 6 3 6,309 7,209 16 14 4 21<br />
Ga. 1,288 1,459 7,122 14 - 12,288 11,558 U 15 2 14<br />
Fla. 3,982 4,926 13,940 13 - 10,718 11,629 78 30 30 15<br />
E.S. CENTRAL 1,136 1,391 16,621 29 14 17,636 23,135 384 670 30 37<br />
Ky. 174 179 3,789 5 2 2,325 2,643 17 21 3 8<br />
Tenn. 444 561 7,271 12 12 6,256 7,717 308 647 14 15<br />
Ala. 325 375 4,663 7 - 7,448 9,720 3 2 2 5<br />
Miss. 193 276 U 5 - 1,607 3,055 56 U 11 9<br />
W.S. CENTRAL 3,320 3,694 10,673 31 5 11,070 30,767 275 158 3 12<br />
Ark. 145 166 - 9 2 2,220 2,900 3 3 - 5<br />
La. 787 602 3,891 5 2 4,315 6,925 117 100 - 2<br />
Okla. 138 173 4,349 4 - 2,707 3,092 69 28 3 3<br />
Tex. 2,250 2,753 2,433 13 1 1,828 17,850 86 27 - 2<br />
MOUNTAIN 984 1,328 6,711 77 26 4,264 5,215 370 U 23 82<br />
Mont. 14 14 - 7 - 15 40 11 10 1 4<br />
Idaho 23 31 882 18 5 60 76 88 33 - 2<br />
Wyo. 3 8 350 - 2 16 29 113 115 3 7<br />
Colo. 301 454 - 26 5 1,043 1,682 31 42 7 30<br />
N. Mex. 56 111 U 4 - 512 590 38 34 1 4<br />
Ariz. 287 350 3,631 N 11 2,165 1,903 41 18 7 7<br />
Utah 104 87 825 12 - 160 131 40 10 2 12<br />
Nev. 196 273 1,023 10 3 293 764 8 9 2 16<br />
PACIFIC 5,764 7,776 32,106 121 50 10,752 16,324 242 491 33 74<br />
Wash. 383 576 5,076 25 5 1,114 1,473 35 122 3 12<br />
Oreg. 266 256 U 42 17 269 453 4 32 - -<br />
Calif. 5,013 6,733 22,672 51 23 8,903 13,655 89 327 28 57<br />
Alaska 14 50 629 3 - 251 398 2 1 1 -<br />
Hawaii 88 161 724 N 5 215 345 112 9 1 5<br />
Guam 4 - 114 N - 26 74 1 4 - 1<br />
P.R. 1,057 1,615 N 12 U 167 335 72 125 - -<br />
V.I. 14 25 N N U - - - - - -<br />
Amer. Samoa - - - N U - 14 - - - -<br />
C.N.M.I. - - N N U 11 30 - 5 - -<br />
N: Not notifiable U: Unavailable -: no reported cases C.N.M.I.: Commonwealth <strong>of</strong> Northern Mariana Islands<br />
*Updated monthly to the Division <strong>of</strong> HIV/AIDS Prevention, National Center for HIV, STD, and TB Prevention, last update June 25, 1996.<br />
National Electronic Telecommunications System for Surveillance.<br />
Public Health Laboratory Information System.<br />
Cum.<br />
1996<br />
Cum.<br />
1995<br />
Cum.<br />
1996<br />
Cum.<br />
1995<br />
Cum.<br />
1996<br />
Cum.<br />
1995
Vol. 45 / No. 30 MMWR 659<br />
TABLE II. (Cont’d.) Cases <strong>of</strong> selected notifiable diseases, United States, weeks ending<br />
July 27, 1996, and July 29, 1995 (30th Week)<br />
Reporting Area<br />
Cum.<br />
1996<br />
Lyme<br />
Disease<br />
Cum.<br />
1995<br />
Cum.<br />
1996<br />
Malaria<br />
Cum.<br />
1995<br />
Meningococcal<br />
Disease<br />
Cum.<br />
1996<br />
Syphilis<br />
(Primary & Secondary) Tuberculosis Rabies, Animal<br />
UNITED STATES 3,895 5,079 684 657 2,129 1,985 5,899 9,379 10,386 11,445 3,213 4,599<br />
NEW ENGLAND 1,152 969 31 28 91 96 98 216 233 276 400 936<br />
Maine 10 3 6 3 12 6 - 2 4 11 53 20<br />
N.H. 9 16 1 1 3 16 1 1 8 9 40 101<br />
Vt. 6 6 2 1 3 6 - - 1 2 99 119<br />
Mass. 97 61 11 9 34 33 42 38 109 147 63 306<br />
R.I. 185 150 3 2 9 4 1 1 24 27 29 179<br />
Conn. 845 733 8 12 30 31 54 174 87 80 116 211<br />
MID. ATLANTIC 2,291 3,347 162 181 187 263 240 486 1,788 2,469 442 1,202<br />
Upstate N.Y. 1,383 1,646 45 36 56 73 40 47 215 283 241 699<br />
N.Y. City 173 252 79 90 29 36 71 212 995 1,424 - -<br />
N.J. 94 906 28 41 49 64 73 106 393 410 79 224<br />
Pa. 641 543 10 14 53 90 56 121 185 352 122 279<br />
E.N. CENTRAL 32 200 79 93 287 289 803 1,616 1,124 1,117 37 40<br />
Ohio 23 13 8 5 109 85 285 529 167 160 4 4<br />
Ind. 9 9 7 12 45 40 135 168 106 104 1 5<br />
Ill. - 13 35 52 76 77 272 629 638 595 6 6<br />
Mich. - 5 20 13 30 52 U 170 156 217 15 18<br />
Wis. U 160 9 11 27 35 111 120 57 41 11 7<br />
W.N. CENTRAL 64 59 18 16 165 115 215 474 260 347 326 216<br />
Minn. 13 - 7 3 22 18 27 26 50 87 16 11<br />
Iowa 12 7 2 2 32 22 13 28 39 41 157 76<br />
Mo. 18 32 6 5 69 44 154 402 114 130 15 22<br />
N. Dak. - - - 1 3 1 - - 3 2 44 22<br />
S. Dak. - - - 1 8 5 - - 14 13 76 57<br />
Nebr. - 4 1 3 13 8 6 9 13 17 3 1<br />
Kans. 21 16 2 1 18 17 15 9 27 57 15 27<br />
S. ATLANTIC 214 346 149 125 470 321 2,140 2,369 1,935 2,042 1,576 1,248<br />
Del. 36 30 2 1 3 5 23 8 20 36 39 70<br />
Md. 103 225 31 32 43 29 340 249 172 228 378 247<br />
D.C. 1 1 7 11 7 4 95 70 80 62 8 10<br />
Va. 19 30 21 26 35 41 252 362 149 146 328 245<br />
W. Va. 7 16 2 1 11 7 1 8 33 49 64 71<br />
N.C. 31 26 11 11 55 53 605 660 272 241 406 284<br />
S.C. 3 8 8 - 43 41 237 358 203 190 50 84<br />
Ga. 1 7 14 14 109 63 355 445 390 373 178 168<br />
Fla. 13 3 53 29 164 78 232 209 616 717 125 69<br />
E.S. CENTRAL 37 31 17 11 118 127 1,452 1,844 777 779 121 155<br />
Ky. 10 7 2 1 20 34 79 113 146 173 29 14<br />
Tenn. 14 15 8 4 15 42 554 474 249 263 42 59<br />
Ala. 3 1 3 5 44 28 309 363 255 218 48 78<br />
Miss. 10 8 4 1 39 23 510 894 127 125 2 4<br />
W.S. CENTRAL 51 64 14 16 241 236 618 1,856 1,352 1,462 39 493<br />
Ark. 14 6 - 2 28 24 105 283 111 126 13 33<br />
La. 1 2 2 1 44 35 325 624 59 134 13 22<br />
Okla. 3 25 - 1 23 24 114 111 106 124 13 24<br />
Tex. 33 31 12 12 146 153 74 838 1,076 1,078 - 414<br />
MOUNTAIN 5 5 31 37 120 147 78 142 330 346 U 86<br />
Mont. - - 3 3 4 2 - 4 14 10 14 29<br />
Idaho 2 - - 1 18 7 2 - 5 8 - -<br />
Wyo. 2 3 3 - 3 5 2 - 3 1 18 21<br />
Colo. - - 14 17 20 38 23 80 45 25 22 -<br />
N. Mex. - 1 1 4 21 26 1 5 52 50 3 3<br />
Ariz. - - 4 6 33 45 45 21 134 168 16 25<br />
Utah 1 - 4 4 12 11 2 4 34 19 2 7<br />
Nev. - 1 2 2 9 13 3 28 43 65 3 1<br />
PACIFIC 49 58 183 150 450 391 255 376 2,587 2,607 194 223<br />
Wash. 4 4 12 13 65 66 3 9 132 159 - 4<br />
Oreg. 9 7 13 9 80 71 5 18 49 67 - 1<br />
Calif. 35 47 151 118 298 246 246 348 2,271 2,234 186 211<br />
Alaska - - 2 1 5 5 - 1 40 47 8 7<br />
Hawaii 1 - 5 9 2 3 1 - 95 100 - -<br />
Guam - - - 1 1 2 3 5 35 71 - -<br />
P.R. - - - 1 4 15 81 167 63 85 29 31<br />
V.I. - - - 2 - - - - - - - -<br />
Amer. Samoa - - - - - - - - - 3 - -<br />
C.N.M.I. - - - 1 - - 1 1 - 23 - -<br />
N: Not notifiable U: Unavailable -: no reported cases<br />
Cum.<br />
1995<br />
Cum.<br />
1996<br />
Cum.<br />
1995<br />
Cum.<br />
1996<br />
Cum.<br />
1995<br />
Cum.<br />
1996<br />
Cum.<br />
1995
660 MMWR August 2, 1996<br />
TABLE III. Cases <strong>of</strong> selected notifiable diseases preventable by vaccination,<br />
United States, weeks ending July 27, 1996, and July 29, 1995 (30th Week)<br />
Reporting Area<br />
H. influenzae,<br />
invasive<br />
Cum.<br />
1996*<br />
Cum.<br />
1995<br />
Cum.<br />
1996<br />
Hepatitis (viral), by type<br />
Measles (Rubeola)<br />
A B Indigenous Imported †<br />
Cum. Cum. Cum.<br />
Cum.<br />
Cum.<br />
1995 1996 1995 1996 1996 1996 1996<br />
UNITED STATES 717 714 15,221 15,906 5,285 5,731 8 290 - 21<br />
NEW ENGLAND 17 28 183 150 102 135 - 8 - 3<br />
Maine - 3 12 17 2 6 - - - -<br />
N.H. 8 7 9 7 8 13 - - - -<br />
Vt. - 2 4 4 6 2 - 1 - -<br />
Mass. 8 8 94 62 33 46 - 6 - 3<br />
R.I. 1 3 8 18 6 8 - - - -<br />
Conn. - 5 56 42 47 60 - 1 - -<br />
MID. ATLANTIC 110 98 924 1,000 757 828 - 15 - 5<br />
Upstate N.Y. 33 24 237 226 212 210 - - - -<br />
N.Y. City 20 25 357 491 367 270 - 6 - 3<br />
N.J. 34 11 204 141 99 216 - - - -<br />
Pa. 23 38 126 142 79 132 - 9 - 2<br />
E.N. CENTRAL 112 129 1,273 1,941 544 649 - 6 - 3<br />
Ohio 66 65 521 1,106 79 73 - 2 - -<br />
Ind. 7 17 181 92 93 123 - - - -<br />
Ill. 27 29 238 395 117 170 - 2 - 1<br />
Mich. 7 16 239 221 221 235 - 1 - 2<br />
Wis. 5 2 94 127 34 48 - 1 - -<br />
W.N. CENTRAL 28 53 1,204 1,069 245 360 1 17 - 1<br />
Minn. 15 28 70 110 31 32 1 14 - 1<br />
Iowa 5 2 229 57 56 28 - - - -<br />
Mo. 5 16 564 760 124 255 - 2 - -<br />
N. Dak. - - 28 17 - 4 - - - -<br />
S. Dak. 1 1 37 25 - 2 - - - -<br />
Nebr. 1 3 130 29 11 18 - - - -<br />
Kans. 1 3 146 71 23 21 - 1 - -<br />
S. ATLANTIC 172 143 676 643 846 762 - 3 - 3<br />
Del. 2 - 8 8 6 6 - 1 - -<br />
Md. 40 51 119 119 179 151 - 2 - -<br />
D.C. 5 - 19 16 27 13 - - - -<br />
Va. 6 19 90 106 87 59 - - - 2<br />
W. Va. 6 6 12 11 14 29 - - - -<br />
N.C. 20 22 80 68 213 176 - - - -<br />
S.C. 4 - 31 25 48 33 - - - -<br />
Ga. 71 41 49 50 8 62 - - - 1<br />
Fla. 18 4 268 240 264 233 - - - -<br />
E.S. CENTRAL 18 6 873 970 442 540 - - - -<br />
Ky. 4 1 17 32 35 49 - - - -<br />
Tenn. 7 - 589 814 258 424 - - - -<br />
Ala. 6 4 119 53 39 67 - - - -<br />
Miss. 1 1 148 71 110 - U - U -<br />
W.S. CENTRAL 30 37 3,192 1,782 739 666 4 17 - 2<br />
Ark. - 5 295 221 49 31 - - - -<br />
La. 3 1 91 53 64 110 - - - -<br />
Okla. 25 18 1,298 454 59 93 - - - -<br />
Tex. 2 13 1,508 1,054 567 432 4 17 - 2<br />
MOUNTAIN 71 81 2,452 2,427 622 493 3 89 - 1<br />
Mont. - - 76 61 6 16 - - - -<br />
Idaho 1 2 142 216 64 56 - 1 - -<br />
Wyo. 35 4 28 74 23 16 U - U -<br />
Colo. 7 9 245 295 72 73 - 6 - 1<br />
N. Mex. 8 11 268 526 210 190 1 8 - -<br />
Ariz. 9 20 995 660 157 71 - 8 - -<br />
Utah 6 9 552 483 64 44 2 61 - -<br />
Nev. 5 26 146 112 26 27 - 5 - -<br />
PACIFIC 159 139 4,444 5,924 988 1,298 - 135 - 3<br />
Wash. 2 7 320 429 58 104 - 45 - -<br />
Oreg. 21 20 553 1,502 39 80 - 4 - -<br />
Calif. 133 109 3,494 3,859 877 1,094 - 22 - 2<br />
Alaska 1 - 28 27 6 8 - 63 - -<br />
Hawaii 2 3 49 107 8 12 - 1 - 1<br />
Guam - - 2 3 - 4 U - U -<br />
P.R. 1 2 51 51 175 337 - 7 - -<br />
V.I. - - - 6 - 12 U - U -<br />
Amer. Samoa - - - 5 - - U - U -<br />
C.N.M.I. 10 10 1 21 5 10 U - U -<br />
N: Not notifiable U: Unavailable -: no reported cases<br />
*Of 164 cases among children aged
Vol. 45 / No. 30 MMWR 661<br />
TABLE III. (Cont’d.) Cases <strong>of</strong> selected notifiable diseases preventable by vaccination,<br />
United States, weeks ending July 27, 1996, and July 29, 1995 (30th Week)<br />
Reporting Area<br />
Measles (Rubeola), cont’d.<br />
Total<br />
Cum. Cum.<br />
1996 1995 1996<br />
Mumps Pertussis Rubella<br />
Cum.<br />
1996<br />
Cum.<br />
1995 1996<br />
UNITED STATES 311 248 6 368 538 170 1,991 1,856 60 172 87<br />
NEW ENGLAND 11 8 - - 10 45 410 257 - 12 35<br />
Maine - - - - 4 3 16 18 - - -<br />
N.H. - - - - 1 19 40 23 - - 1<br />
Vt. 1 - - - - - 11 36 - 2 -<br />
Mass. 9 2 - - 2 23 340 169 - 8 7<br />
R.I. - 5 - - - - - 1 - - -<br />
Conn. 1 1 - - 3 - 3 10 - 2 27<br />
MID. ATLANTIC 20 5 1 57 79 9 145 151 1 7 11<br />
Upstate N.Y. - - 1 18 19 2 74 71 1 4 3<br />
N.Y. City 9 - - 13 8 - 21 27 - 1 6<br />
N.J. - 5 - 2 13 - 5 11 - 2 2<br />
Pa. 11 - - 24 39 7 45 42 - - -<br />
E.N. CENTRAL 9 13 - 70 90 7 201 208 - 3 2<br />
Ohio 2 1 - 28 26 4 93 52 - - -<br />
Ind. - - - 5 7 - 19 18 - - -<br />
Ill. 3 1 - 18 26 1 64 38 - 1 -<br />
Mich. 3 5 - 18 31 2 20 33 - 2 2<br />
Wis. 1 6 - 1 - - 5 67 - - -<br />
W.N. CENTRAL 18 2 1 7 32 1 84 105 - 1 -<br />
Minn. 15 - - 3 2 1 55 27 - - -<br />
Iowa - - - - 8 - 3 5 - 1 -<br />
Mo. 2 1 - 1 18 - 16 34 - - -<br />
N. Dak. - - - 2 - - 1 6 - - -<br />
S. Dak. - - - - - - 2 7 - - -<br />
Nebr. - - - - 4 - 3 7 - - -<br />
Kans. 1 1 1 1 - - 4 19 - - -<br />
S. ATLANTIC 6 11 3 56 84 11 245 157 59 89 6<br />
Del. 1 - - - - - 10 8 - - -<br />
Md. 2 1 1 16 27 2 84 19 - - 1<br />
D.C. - - - - - - - 4 - 1 -<br />
Va. 2 - 1 8 15 - 26 10 - 2 -<br />
W. Va. - - - - - - 2 - - - -<br />
N.C. - - - 11 16 - 36 73 59 75 -<br />
S.C. - - - 5 7 2 21 15 - 1 -<br />
Ga. 1 2 - 2 6 - 13 11 - - -<br />
Fla. - 8 1 14 13 7 53 17 - 10 5<br />
E.S. CENTRAL - - - 17 7 1 57 90 - 2 -<br />
Ky. - - - - - - 26 10 - - -<br />
Tenn. - - - 2 - 1 17 50 - - -<br />
Ala. - - - 3 4 - 9 30 - 2 -<br />
Miss. - - - 12 3 - 5 - N N N<br />
W.S. CENTRAL 19 20 - 16 38 3 56 141 - 2 7<br />
Ark. - 2 - - 5 - 3 22 - - -<br />
La. - 18 - 11 8 1 6 10 - 1 -<br />
Okla. - - - - - 2 7 17 - - -<br />
Tex. 19 - - 5 25 - 40 92 - 1 7<br />
MOUNTAIN 90 68 - 21 24 14 208 373 - 6 4<br />
Mont. - - - - 1 5 11 3 - - -<br />
Idaho 1 - - - 2 - 74 82 - 2 -<br />
Wyo. - - - - - 1 2 1 - - -<br />
Colo. 7 26 - 2 - 7 43 55 - 2 -<br />
N. Mex. 8 31 N N N 1 34 59 - - -<br />
Ariz. 8 10 - 1 2 - 11 135 - 1 3<br />
Utah 61 - - 2 11 - 11 16 - - 1<br />
Nev. 5 1 - 16 8 - 22 22 - 1 -<br />
PACIFIC 138 121 1 124 174 79 585 374 - 50 22<br />
Wash. 45 17 - 18 10 6 222 78 - 1 -<br />
Oreg. 4 1 - - - 1 29 21 - 1 -<br />
Calif. 24 101 1 87 148 71 321 238 - 45 18<br />
Alaska 63 - - 2 12 - 2 - - - -<br />
Hawaii 2 2 - 17 4 1 11 37 - 3 4<br />
Guam - - U 3 3 U - 2 U - 1<br />
P.R. 7 3 - 1 2 - 1 1 - - -<br />
V.I. - - U - 3 U - - U - -<br />
Amer. Samoa - - U - - U - - U - -<br />
C.N.M.I. - - U - - U - - U - -<br />
N: Not notifiable U: Unavailable -: no reported cases<br />
Cum.<br />
1996<br />
Cum.<br />
1995 1996<br />
Cum.<br />
1996<br />
Cum.<br />
1995
662 MMWR August 2, 1996<br />
TABLE IV. Deaths in 121 U.S. cities,* week ending<br />
July 27, 1996 (30th Week)<br />
Reporting Area<br />
All<br />
Ages<br />
All Causes, By Age (Years)<br />
>65 45-64 25-44 1-24 65 45-64 25-44 1-24
Vol. 45 / No. 30 MMWR 663<br />
Contributors to the Production <strong>of</strong> the MMWR (Weekly)<br />
Weekly Notifiable Disease Morbidity Data and 121 Cities Mortality Data<br />
Denise Koo, M.D., M.P.H.<br />
Deborah A. Adams<br />
Timothy M. Copeland<br />
Patsy A. Hall<br />
Carol M. Knowles<br />
Sarah H. Landis<br />
Myra A. Montalbano<br />
Desktop Publishing and Graphics Support<br />
Jolene W. Altman<br />
Morie M. Higgins<br />
Peter M. Jenkins
664 MMWR August 2, 1996<br />
The Morbidity and Mortality Weekly Report (MMWR) Series is prepared by the Centers for Disease Control<br />
and Prevention (CDC) and is available free <strong>of</strong> charge in electronic format and on a paid subscription basis<br />
for paper copy. To receive an electronic copy on Friday <strong>of</strong> each week, send an e-mail message to<br />
lists@list.cdc.gov. The body content should read subscribe mmwr-toc. Electronic copy also is available<br />
from CDC’s World-Wide Web server at http://www.cdc.gov/ or from CDC’s file transfer protocol server at<br />
ftp.cdc.gov. To subscribe for paper copy, contact Superintendent <strong>of</strong> Documents, U.S. Government Printing<br />
Office, Washington, DC 20402; telephone (202) 512-1800.<br />
Data in the weekly MMWR are provisional, based on weekly reports to CDC by state health departments.<br />
The reporting week concludes at close <strong>of</strong> business on Friday; compiled data on a national basis are <strong>of</strong>ficially<br />
released to the public on the following Friday. Address inquiries about the MMWR Series, including material<br />
to be considered for publication, to: Editor, MMWR Series, Mailstop C-08, CDC, 1600 Clifton Rd., N.E., Atlanta,<br />
GA 30333; telephone (404) 332-4555.<br />
All material in the MMWR Series is in the public domain and may be used and reprinted <strong>with</strong>out<br />
permission; citation as to source, however, is appreciated.<br />
Director, Centers for Disease Control<br />
Editor, MMWR Series<br />
and Prevention<br />
Richard A. Goodman, M.D., M.P.H.<br />
David Satcher, M.D., Ph.D.<br />
Managing Editor, MMWR (weekly)<br />
Deputy Director, Centers for Disease Control<br />
Karen L. Foster, M.A.<br />
and Prevention<br />
Writers-Editors, MMWR (weekly)<br />
Claire V. Broome, M.D.<br />
David C. Johnson<br />
Director, Epidemiology Program Office<br />
Darlene D. Rumph Person<br />
Stephen B. Thacker, M.D., M.Sc.<br />
Caran R. Wilbanks<br />
Editorial Assistant, MMWR (weekly)<br />
Teresa F. Rutledge<br />
✩U.S. Government Printing Office: 1996-733-175/47018 Region IV