DoubleChecker: Efficient Sound and Precise Atomicity Checking
DoubleChecker: Efficient Sound and Precise Atomicity Checking
DoubleChecker: Efficient Sound and Precise Atomicity Checking

Create successful ePaper yourself
Turn your PDF publications into a flip-book with our unique Google optimized e-Paper software.
<strong>DoubleChecker</strong>: <strong>Efficient</strong> <strong>Sound</strong> <strong>and</strong> <strong>Precise</strong> <strong>Atomicity</strong> <strong>Checking</strong><br />
Swarnendu Biswas Jipeng Huang Aritra Sengupta Michael D. Bond<br />
Department of Computer Science <strong>and</strong> Engineering<br />
Ohio State University<br />
{biswass,huangjip,sengupta,mikebond}@cse.ohio-state.edu<br />
Ohio State CSE Technical Report #OSU-CISRC-11/13-TR24, November 2013<br />
Abstract<br />
<strong>Atomicity</strong> is a key correctness property that allows programmers<br />
to reason about code regions in isolation. However, programs often<br />
fail to enforce atomicity correctly, leading to atomicity violations<br />
that are difficult to detect. Dynamic program analyses can detect<br />
atomicity violations soundly <strong>and</strong> precisely based on an atomicity<br />
specification, but existing approaches slow programs substantially.<br />
This paper presents <strong>DoubleChecker</strong>, a novel sound <strong>and</strong> precise<br />
atomicity checker whose key insight lies in its use of two new cooperating<br />
dynamic analyses. Its imprecise analysis tracks inter-thread<br />
dependences soundly but imprecisely with significantly better performance<br />
than a fully precise analysis, so it detects all atomicity<br />
violations but also has false positives. Its precise analysis is more<br />
expensive but only needs to process parts of execution identified<br />
as potentially involved in atomicity violations. If <strong>DoubleChecker</strong><br />
operates in single-run mode, the two analyses execute in the same<br />
program run, which guarantees soundness but requires logging program<br />
accesses to pass from the imprecise to the precise analysis. In<br />
contrast, in multi-run mode, the first program run executes only<br />
the imprecise analysis, <strong>and</strong> a second run executes both analyses.<br />
Multi-run mode trades accuracy for performance, potentially missing<br />
some violations but outperforming the single-run mode.<br />
We have implemented <strong>DoubleChecker</strong> <strong>and</strong> an existing state-ofthe-art<br />
atomicity checker called Velodrome in a high-performance<br />
Java virtual machine. <strong>DoubleChecker</strong>’s single-run mode significantly<br />
outperforms Velodrome, while still providing full soundness<br />
<strong>and</strong> precision. <strong>DoubleChecker</strong>’s multi-run mode improves performance<br />
further, without significantly impacting soundness in practice.<br />
These results suggest that <strong>DoubleChecker</strong>’s approach is a<br />
promising direction for improving the performance of dynamic<br />
atomicity checking over prior work.<br />
1. Introduction<br />
Modern multicore hardware trends have made concurrency necessary<br />
for performance, but developing correct, high-performance<br />
parallel programs is notoriously challenging. Concurrency bugs<br />
have caused several high-profile failures, a testament to the fact that<br />
concurrency errors are present even in well-tested code [14, 31].<br />
According to a study of real-world bugs, 65% of concurrency errors<br />
are due to atomicity violations [20].<br />
<strong>Atomicity</strong> is a fundamental non-interference property that eases<br />
reasoning about program behavior in multithreaded programs. For<br />
programming language semantics, atomicity is synonymous with<br />
serializability: program execution must be equivalent to some serial<br />
execution of atomic regions <strong>and</strong> non-atomic instructions. That<br />
is, the code block’s execution appears not to be interleaved with<br />
statements from other concurrently executing threads. Programmers<br />
can thus reason about atomic regions without considering effects<br />
of other threads. However, modern general-purpose languages<br />
provide crude support for enforcing atomicity—programmers are<br />
basically stuck using locks to control how threads’ shared memory<br />
accesses can interleave. Programmers try to maximize scalability<br />
by minimizing synchronization, often mistakenly writing code that<br />
does not correctly enforce needed atomicity properties.<br />
An atomicity specification denotes particular code regions that<br />
are expected to execute atomically. Program analysis can check<br />
atomicity by checking whether program execution(s) conform to<br />
the atomicity specification. A violation indicates that the program<br />
or specification is wrong (or both). Writing an atomicity specification<br />
may seem burdensome, but prior work shows that specifications<br />
can be derived mostly automatically [10, 13].<br />
Static analysis can check atomicity but is inherently imprecise,<br />
<strong>and</strong> type-based approaches rely on annotations [8, 9, 12, 14]. Existing<br />
dynamic analyses are precise but slow programs by up to an order<br />
of magnitude or more [10, 13, 21, 33–35]. Dynamic approaches<br />
incur high costs to track cross-thread dependences soundly <strong>and</strong> precisely,<br />
which is especially expensive because it requires inserting<br />
intrusive synchronization in order to track dependences correctly.<br />
The state-of-the-art Velodrome algorithm soundly <strong>and</strong> precisely<br />
checks conflict serializability, a sufficient condition for serializability<br />
[13]. During program execution, it builds a graph of dependence<br />
edges between transactions, <strong>and</strong> checks for occurrences of cycles.<br />
A transaction is a dynamically executing atomic region. Each<br />
non-transactional access conceptually executes in its own unary<br />
transaction. Dependences include intra-thread program order dependences,<br />
cross-thread data dependences (write–read, read–write,<br />
write-write), <strong>and</strong> release–acquire synchronization dependences.<br />
Velodrome slows programs by 12.7X (prior work [13]) or 8.7X<br />
(our implementation <strong>and</strong> experiments) largely due to the cost of<br />
tracking cross-thread dependences soundly <strong>and</strong> precisely, which<br />
involves maintaining the last transaction to write <strong>and</strong> each thread’s<br />
last transaction to read each variable. To preserve soundness in<br />
the face of potentially racy program accesses, the analysis must<br />
use atomic operations, which further slow execution by serializing<br />
in-flight instructions <strong>and</strong> by triggering remote cache misses for<br />
otherwise read-shared access patterns.<br />
<strong>Atomicity</strong> violations are common but serious errors that are<br />
sensitive to inputs, environments, <strong>and</strong> thread interleavings, so violations<br />
manifest unexpectedly <strong>and</strong> only in certain settings. Lowoverhead<br />
checking is needed in order to use it liberally to find bugs<br />
during in-house, alpha, <strong>and</strong> beta testing, <strong>and</strong> perhaps even some<br />
production settings. Our goal is to reduce the cost of sound <strong>and</strong> precise<br />
atomicity checking significantly in order to increase its practicality<br />
for various use cases.<br />
Our Approach<br />
This paper presents a sound <strong>and</strong> precise dynamic conflict serializability<br />
checker called <strong>DoubleChecker</strong> that significantly reduces<br />
overhead compared with existing state-of-the-art detectors. The<br />
key insight of <strong>DoubleChecker</strong> lies in its dual-analysis approach<br />
that avoids the high costs of precisely tracking cross-thread dependences<br />
<strong>and</strong> performing synchronized metadata updates, by overap-<br />
1
proximating transactional dependences <strong>and</strong> then recovering precision<br />
only for transactions that might be involved in a violation.<br />
<strong>DoubleChecker</strong> achieves low overhead by staging work between<br />
two new analyses, one imprecise <strong>and</strong> the other precise. The<br />
imprecise analysis constructs a graph that soundly but imprecisely<br />
captures dependences among transactions. The imprecise analysis<br />
(1) detects cross-thread dependences by extending an existing concurrency<br />
control mechanism [3]; (2) computes dependence edges<br />
that soundly imply the true cross-thread dependences; (3) detects<br />
cycles in the graph, which indicate potential atomicity violations<br />
<strong>and</strong> are a superset of the true (precise) cycles; <strong>and</strong> (4) (when the<br />
precise analysis executes in the same run as the imprecise analysis)<br />
captures enough information about program accesses to allow<br />
reconstruction of precise dependences. The precise analysis computes<br />
precise cross-thread dependences <strong>and</strong> checks for cycles in a<br />
precise dependence graph. However,the precise analysis processes<br />
only those transactions that the imprecise analysis identified as being<br />
involved in a cycle. In practice, these transactions are a reasonable<br />
overapproximation of the precise cycles, eliminating most<br />
of the work that would otherwise normally be performed by any<br />
sound <strong>and</strong> precise analysis.<br />
<strong>DoubleChecker</strong> supports two execution modes. In single-run<br />
mode, the imprecise <strong>and</strong> precise analyses operate on the same program<br />
execution. Single-run mode requires the imprecise analysis to<br />
record all program accesses so that the precise analysis can determine<br />
the precise dependences among the transactions identified by<br />
the imprecise analysis. The imprecise analysis is thus fully sound: it<br />
detects all atomicity violations in an execution. In multi-run mode,<br />
the first <strong>and</strong> second runs operate on different program runs. The<br />
first run executes only the imprecise analysis, while the second run<br />
executes both the imprecise <strong>and</strong> precise analyses (similar to singlerun<br />
mode). The first run is thus imprecise whereas the second run is<br />
precise. The first run passes static program information about imprecise<br />
cycles to the second run to help reduce the instrumentation<br />
introduced by the second run. The multi-run mode is unsound since<br />
the first <strong>and</strong> second runs operate on different program executions,<br />
which could differ due to different program inputs <strong>and</strong> thread interleavings.<br />
The multi-run mode can thus miss atomicity violations<br />
that occur in either program run.<br />
We have implemented <strong>DoubleChecker</strong> <strong>and</strong> prior work’s Velodrome,<br />
in a high-performance Java virtual machine. We evaluate<br />
correctness, performance, <strong>and</strong> other characteristics of Double-<br />
Checker on large, real-world multithreaded programs, <strong>and</strong> compare<br />
it with Velodrome. In single-run mode, <strong>DoubleChecker</strong> is a fully<br />
sound <strong>and</strong> precise analysis that slows programs by 3.5X on average,<br />
a significant improvement over Velodrome’s 8.7X slowdown.<br />
<strong>DoubleChecker</strong>’s multi-run mode does not guarantee soundness for<br />
either run, although we show it can find a high fraction of atomicity<br />
violations in practice. Its first <strong>and</strong> second runs slow programs<br />
by 2.2X each. As such, the overhead added by <strong>DoubleChecker</strong> in<br />
its single- <strong>and</strong> multi- run modes is 3.1 <strong>and</strong> 6.4 times less than Velodrome’s,<br />
respectively. These results suggest that <strong>DoubleChecker</strong>’s<br />
novel approach is a promising direction for providing significantly<br />
better performance for dynamic atomicity checking.<br />
Contributions. This paper makes the following contributions:<br />
• a novel sound <strong>and</strong> precise dynamic atomicity checker based on<br />
using two new, cooperating analyses:<br />
an imprecise analysis that shows it can be cheaper to overapproximate<br />
dependence edges rather than compute them<br />
precisely, <strong>and</strong> thus detect cycles whose transactions are a<br />
superset of the true (precise) cycles, <strong>and</strong><br />
a precise analysis that replays an execution history of only<br />
those transactions involved in potential cycles;<br />
• two modes of execution that provide two choices for balancing<br />
soundness <strong>and</strong> performance;<br />
Program<br />
execution<br />
Program<br />
execution<br />
Program<br />
execution<br />
atomicity<br />
specification<br />
ICD<br />
atomicity<br />
specification<br />
monitored<br />
transactions<br />
ICD + PCD<br />
ICD cycles<br />
read/write logs<br />
(a) Single-run mode<br />
ICD<br />
First run<br />
ICD + PCD<br />
Second run<br />
(b) Multi-run mode<br />
PCD<br />
static transaction<br />
information<br />
<strong>Atomicity</strong><br />
violations<br />
Potentially<br />
imprecise<br />
cycles<br />
<strong>Atomicity</strong><br />
violations<br />
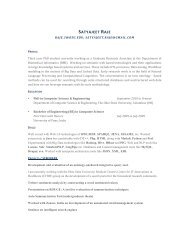
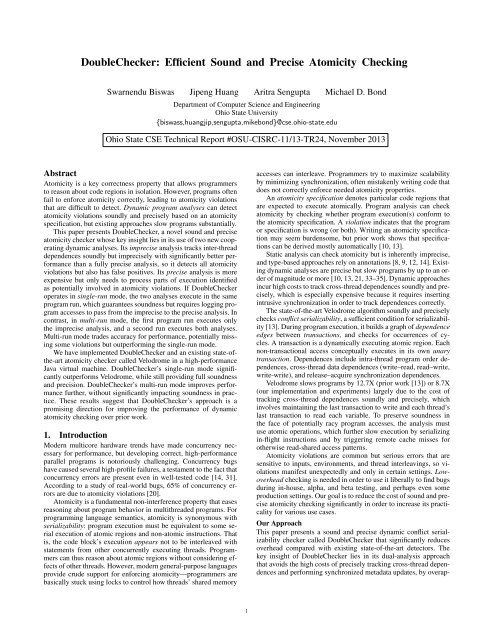
Figure 1. An overview of <strong>DoubleChecker</strong>’s two execution modes.<br />
• implementations of <strong>DoubleChecker</strong> <strong>and</strong> Velodrome that we will<br />
make publicly available; <strong>and</strong><br />
• an evaluation that shows <strong>DoubleChecker</strong> outperforms Velodrome<br />
significantly, with multi-run mode providing better performance<br />
without sacrificing much soundness in practice.<br />
2. Design of <strong>DoubleChecker</strong><br />
This section describes <strong>DoubleChecker</strong>, which uses two cooperating<br />
dynamic analyses to check atomicity without incurring the full<br />
costs of tracking cross-thread dependences soundly <strong>and</strong> precisely<br />
for all program accesses. First we overview <strong>DoubleChecker</strong>’s analyses<br />
<strong>and</strong> execution modes. Then Section 2.2 describes the imprecise<br />
analysis, <strong>and</strong> Section 2.3 describes the precise analysis.<br />
2.1 Overview<br />
<strong>DoubleChecker</strong>’s imprecise analysis, called imprecise cycle detection<br />
(ICD), monitors all program accesses to track cross-thread dependences<br />
soundly but imprecisely, i.e., the dependences imply that<br />
execution’s actual dependences as well as other dependences. ICD<br />
is inherently imprecise because it identifies dependence edges by<br />
tracking shared memory “ownership”; a transfer of ownership indicates<br />
a possible dependence, but does not guarantee a dependence<br />
nor identify the source of the dependence edge. ICD constructs a<br />
transactional dependence graph whose nodes are transactions <strong>and</strong><br />
whose edges correspond to the cross-thread dependences that ICD<br />
detects. ICD checks for cycles in this graph.<br />
The second analysis, precise cycle detection (PCD), is a sound<br />
<strong>and</strong> precise analysis that limits its monitoring to a subset of all<br />
transactions. This subset of transactions are the transactions identified<br />
by ICD as being involved in potential cycles—which is correct<br />
because every precise cycle’s transactions will always be a subset<br />
of some (potentially imprecise) cycle identified by ICD. It is important<br />
to note that PCD is not a st<strong>and</strong>alone analysis: it performs<br />
its analysis on an execution’s access log, provided by ICD.<br />
<strong>DoubleChecker</strong> can operate in either of two modes. Figure 1<br />
overviews the two modes of <strong>DoubleChecker</strong>.<br />
Single-run mode. In single-run mode, ICD <strong>and</strong> PCD run on the<br />
same program execution. ICD logs all program reads <strong>and</strong> writes<br />
<strong>and</strong> ordering dependences between them, so PCD can reproduce<br />
the exact execution <strong>and</strong> identify precise cycles. A key cost of<br />
single-run mode is logging all program accesses.<br />
2
Multi-run mode. In testing <strong>and</strong> deployment situations, programs<br />
are run multiple times with various inputs. <strong>DoubleChecker</strong>’s multirun<br />
mode takes advantage of this situation by splitting work across<br />
multiple program runs. 1 One run can identify transactions that<br />
might be involved in a dependence cycle, <strong>and</strong> another run can focus<br />
on this set of transactions. In contrast to single-run mode, multi-run<br />
mode avoids logging all accesses during the first run by instead performing<br />
precise checking during a second run of the program. The<br />
first run of multi-run mode uses only ICD. This run identifies all<br />
regular (non-unary) transactions that are involved in imprecise cycles<br />
during that execution according to their static starting locations<br />
(e.g., method signatures). Since it would be expensive to be able to<br />
identify unary transactions involved in cycles, the first run simply<br />
identifies whether any unary transactions were involved in a cycle.<br />
The second run takes this static transaction information (set of<br />
regular transactions plus a boolean about unary transactions) as<br />
input <strong>and</strong> limits its analysis to the identified regular transactions <strong>and</strong><br />
instruments all unary transactions if <strong>and</strong> only the unary transaction<br />
boolean is true. This approximation is acceptable in practice if most<br />
accesses are not unary, i.e., if they occur inside regular transactions.<br />
In our experiments, the second run uses both ICD <strong>and</strong> PCD—<br />
similar to the single-run mode—for the best performance, but the<br />
second run can use a different precise checker such as Velodrome.<br />
In multi-run mode, <strong>DoubleChecker</strong> guarantees soundness if the<br />
two program runs execute identically. In practice, executions will<br />
differ due to different inputs <strong>and</strong> thread interleavings. The set of<br />
(static) transactions identified by the first run may not be involved<br />
in a cycle in the second run; similarly, the second run may execute<br />
transactional cycles not present in the first run. To increase efficacy,<br />
the second run can take as input the transactions identified across<br />
multiple executions of the first run. The multi-run mode can still<br />
be effective in practice if the same regions tend to be involved in<br />
cycles across multiple runs.<br />
2.2 Imprecise Cycle Detection<br />
Imprecise cycle detection (ICD) is a dynamic analysis that analyzes<br />
all program execution in order to detect cycles among transactions.<br />
ICD constructs a sound but imprecise graph called the<br />
imprecise dependence graph (IDG) to model dependences among<br />
the transactions in a multithreaded program. The nodes in an IDG<br />
are regular transactions (which correspond to atomic regions) or<br />
unary transactions (which correspond to single accesses outside of<br />
atomic regions). A cross-thread edge between two nodes in different<br />
threads indicates a (potentially imprecise) cross-thread dependence<br />
between the transactions. Two consecutive nodes (i.e., transactions)<br />
in the same thread are connected by an intra-thread edge<br />
that effectively captures any intra-thread dependences.<br />
This section first describes an existing concurrency control<br />
mechanism that ICD uses to help detect cross-thread dependences<br />
but that makes detection inherently imprecise. We then describe<br />
how ICD builds the IDG <strong>and</strong> how it detects cycles.<br />
2.2.1 Background: Concurrency Control<br />
This section describes Octet, a recently developed software-based<br />
concurrency control mechanism [3] that ICD uses to help detect<br />
cross-thread dependences. Octet ensures that happens-before relationships<br />
[18] exist between all dependences in an execution.<br />
Octet is a dynamic analysis that maintains a locality state for<br />
each object 2 that can be one of the following: WrEx T<br />
(write exclusive<br />
for thread T), RdEx T<br />
(read exclusive for thread T), or RdSh c<br />
(read shared; we explain the counter c later). These states are analogous<br />
to the states in the MESI cache coherence protocol [24]. Table<br />
1 shows the possible state transitions based on an access <strong>and</strong> the<br />
1 Prior bug detection work has split work across runs using sampling<br />
(e.g., [19]), which is complementary to our work.<br />
2 We use the term “object” to refer to any unit of shared memory.<br />
Trans. Old New Cross-thread<br />
type state Access state dependence?<br />
Possibly<br />
WrEx T R or W by T Same<br />
Same state RdEx T R by T Same No<br />
RdSh c<br />
R by T ∗ Same<br />
Upgrading<br />
RdEx T<br />
W by T WrEx T<br />
No<br />
RdEx T1 R by T2 RdSh gRdShCnt Possibly<br />
Fence RdSh c R by T ∗ Same ∗ Possibly<br />
WrEx<br />
Conflicting<br />
T1 R by T2 RdEx T2<br />
RdEx T1<br />
W by T2 WrEx T2<br />
WrEx T1<br />
W by T2 WrEx T2<br />
RdSh c W by T WrEx T<br />
Table 1. Octet state transitions. ∗ A read to a RdSh c<br />
object by T triggers<br />
a fence transition if <strong>and</strong> only if per-thread counter T.rdShCnt < c. Fence<br />
transitions update T.rdShCnt to c.<br />
object’s current state. To maintain each object’s state at run time,<br />
the compiler inserts read <strong>and</strong> write barriers 3 before every write:<br />
if (obj . state != WrEx T ) {<br />
/∗ slow path: change obj. state ∗/<br />
}<br />
obj . f = ... ; // program write<br />
<strong>and</strong> before every read:<br />
if (obj . state != WrEx T && obj.state != RdEx T &&<br />
!( obj . state == RdSh c<br />
&& T.rdShCnt >= c)) {<br />
/∗ slow path: change obj. state ∗/<br />
}<br />
... = obj.f ; // program read<br />
The state check, called the fast path, checks whether the state needs<br />
to change (the Same state rows in Table 1). The key to Octet’s<br />
performance is that the fast path is simple <strong>and</strong> performs no writes or<br />
synchronization. If the state needs to change, the slow path executes<br />
in order to change the state.<br />
Conflicting transitions. The last four rows of Table 1 show conflicting<br />
state transitions, which indicate a conflicting access <strong>and</strong> require<br />
a coordination protocol to perform the state change. For example,<br />
in Figure 2, before thread T2 can change an object o’s state<br />
from WrEx T1<br />
to RdEx T2<br />
, T2 must coordinate with T1 to ensure that<br />
T1 does not continue accessing o racily without synchronization.<br />
As part of this coordination protocol, T1 does not respond to T2’s<br />
request until it reaches a safe point: a program point definitely not<br />
between an Octet barrier <strong>and</strong> its corresponding program access.<br />
The roundtrip coordination protocol for conflicting transitions<br />
first puts o into an intermediate state, which helps simplify the<br />
protocol by ensuring that only one thread at a time tries to change<br />
an object’s state. For example, if T2 wants to read an object that is<br />
in the WrEx T1<br />
state, T2 first puts the object into the RdEx Int<br />
T2 state.<br />
The coordination protocol is then performed in one of two ways:<br />
• The threads perform the explicit protocol if T1 is executing<br />
code normally. T2 sends a request to T1, <strong>and</strong> T1 responds to<br />
the request when it reaches a safe point. When T2 observes<br />
the response, a roundtrip happens-before relationship has been<br />
established, so T2 can change the state to RdEx T2<br />
<strong>and</strong> proceed.<br />
• Otherwise, thread T1 is “blocking,” e.g., waiting for synchronization<br />
or I/O. Rather than waiting for T1, T2 implicitly coordinates<br />
with T1 by atomically setting a flag that T1 will observe<br />
when it unblocks. This protocol establishes a happens-before<br />
relationship, so T2 can change the state to RdEx T2<br />
<strong>and</strong> proceed.<br />
Upgrading <strong>and</strong> fence transitions. Upgrading <strong>and</strong> fence transitions<br />
do not require coordination since it is safe for other threads to<br />
continue accessing the object under the old state. In Figure 2, T3<br />
atomically upgrades an object’s state from RdEx T2<br />
to RdSh c . The<br />
3 A barrier is instrumentation added to every program read <strong>and</strong> write [36].<br />
3
safe<br />
point<br />
time<br />
wr o.f<br />
(WrExT1)<br />
rd o.f<br />
(RdExT2)<br />
Ordered by gRdShCounter<br />
rd o.f<br />
(RdShc)<br />
rd o.f<br />
(fence)<br />
Upgrading or fence<br />
rd p.q<br />
(fence)<br />
rd o.f<br />
(no fence)<br />
T1 T2 T3 T4 T5 T6<br />
Conflicting<br />
rd p.q<br />
(RdShc+1)<br />
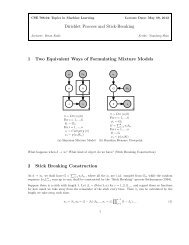
Figure 2. A possible interleaving of six concurrent threads accessing<br />
shared objects o <strong>and</strong> p, <strong>and</strong> the corresponding Octet state transitions (with<br />
new states shown) they trigger.<br />
value c is the new value of a global “read-shared counter” gRdShCnt<br />
that gets incremented atomically every time an object transitions to<br />
RdSh, establishing a global order of all transitions to RdSh. This<br />
state change establishes a happens-before relationship from the<br />
read on T2 to the current program point on T3, ensuring a transitive<br />
happens-before relationship from T1’s write to T3’s read.<br />
In Figure 2, T4 reads o in the RdSh c state. To ensure a happensbefore<br />
relationship from the last write to o (by T1) to this read in<br />
T4, a fence transition is triggered. The fence transition is triggered<br />
when a thread’s local counter T.rdShCnt is not up-to-date with the<br />
counter c in RdSh c . T4 issues a memory fence to ensure a happensbefore<br />
relationship from T3’s transition to RdSh c to T4’s read, <strong>and</strong><br />
T4 updates T4.rdShCnt to c.<br />
In Figure 2, T5 reads o but does not trigger a fence transition<br />
because T5 has already read an object (p) in the RdSh c+1<br />
state.<br />
There is a transitive happens-before relationship from T1’s write to<br />
T5’s read of o because there is a happens-before relationship from<br />
o’s state transition to RdSh c in T3 to p’s transition to RdSh c+1<br />
in T6<br />
(since both transitions update gRdShCnt atomically).<br />
Octet thus establishes happens-before edges that transitively imply<br />
all cross-thread dependences [3]. ICD can piggyback on Octet’s<br />
state transitions to identify potential cross-thread dependences.<br />
However, a key challenge is actually identifying the dependence<br />
edges that ICD should add to the IDG.<br />
2.2.2 Identifying Cross-Thread Dependences<br />
ICD uses Octet to help detect cross-thread dependences. While Octet<br />
establishes happens-before relationships that soundly imply all<br />
cross-thread dependences, it does not exactly identify the exact<br />
points in execution with which happens-before relationships are established.<br />
ICD addresses the challenge of how to identify these program<br />
points <strong>and</strong> add cross-thread edges to the IDG that soundly imply<br />
all cross-thread dependences, so that any true dependence cycle<br />
will lead to a cycle in the IDG. In this way, ICD detects atomicity<br />
violations soundly but imprecisely with substantially lower overhead<br />
than a fully precise approach.<br />
The challenge of identifying each cross-thread edge is in identifying<br />
its source; the sink is obvious since it is the current execution<br />
point on the thread triggering the state change. At a high level, ICD<br />
keeps track of a few “last transaction to do X” facts, to help identify<br />
sources of cross-thread edges later:<br />
T.lastRdEx – Per-thread variable that stores the last transaction of<br />
thread T to transition an object into the RdEx T<br />
state.<br />
gLastRdSh – Global variable that stores the last transaction among<br />
all threads to transition an object into the RdSh state.<br />
We also define the following helper function:<br />
currTX(T) – Returns the transaction currently executing on T.<br />
Creating cross-thread edges for conflicting transitions. A conflicting<br />
transition (last four rows of Table 1) involves one requesting<br />
thread reqT, which coordinates with each responding thread respT.<br />
ICD piggybacks on each invocation of coordination, using the procedure<br />
h<strong>and</strong>leConflictingTransition() in Algorithm 1, in order to add<br />
an edge to the IDG.<br />
Algorithm 1 ICD procedures called from Octet state transitions.<br />
procedure h<strong>and</strong>leConflictingTransition(respT, reqT, oldState,<br />
newState)<br />
IDG.addEdge(currTX(respT) → currTX(reqT))<br />
if newState = RdEx reqT<br />
then<br />
reqT.lastRdEx := currTX(reqT)<br />
end if<br />
end procedure<br />
procedure h<strong>and</strong>leUpgradingTransition(T, oldState, newState)<br />
Let rdExThread be the thread T such that oldState = RdEx T<br />
IDG.addEdge(rdExThread.lastRdEx → currTX(T))<br />
IDG.addEdge(gLastRdSh → currTX(T))<br />
gLastRdSh := currTX(T)<br />
end procedure<br />
procedure h<strong>and</strong>leFenceTransition(T)<br />
IDG.addEdge(gLastRdSh → currTX(T))<br />
end procedure<br />
Either reqT or respT will invoke the procedure as part of the coordination<br />
protocol, depending on whether the explicit or implicit<br />
protocol is used. For the explicit protocol, respT invokes the procedure<br />
before it responds, which is safe since both threads are stopped<br />
at that point. For the implicit protocol, reqT invokes the procedure<br />
since respT is blocked; reqT first temporarily atomically places a<br />
“hold” on respT so respT will not unblock until reqT is done.<br />
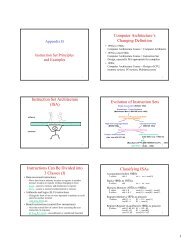
Figure 3 shows a possible thread interleaving among seven concurrent<br />
threads executing transactions. The edges among transactions<br />
are IDG edges that ICD adds. The access rd o.g in Tx 2j conflicts<br />
with the first write to object o in transaction Tx 1i . The h<strong>and</strong>leConflictingTransition()<br />
procedure creates a cross-thread edge in<br />
the IDG from Tx 1i (the transaction executing the responding safe<br />
point) to Tx 2j (the transaction triggering the conflicting transition).<br />
To help upgrading transitions (explained next), h<strong>and</strong>leConflictingTransition()<br />
updates the per-thread variable T.lastRdEx, the last<br />
transaction to put an object into RdEx T<br />
. In Figure 3, this procedure<br />
updates T2.lastRdEx to Tx 2j (not shown).<br />
Creating cross-thread edges for upgrading transitions. To see<br />
why ICD needs to add cross-thread edges for upgrading transitions<br />
(<strong>and</strong> not just for conflicting transitions), consider the upgrading<br />
transition from RdEx T2<br />
to RdSh c+1<br />
in Figure 3. Creating a crossthread<br />
edge is necessary to capture the dependence from T1’s write<br />
to o to T3’s read of o transitively. To create this edge, T3 invokes<br />
the procedure h<strong>and</strong>leUpgradingTransition() in Algorithm 1.<br />
This procedure also creates a second edge: from the last transaction<br />
to transfer an object to the RdSh state, referenced by gLastRdSh,<br />
to the current transaction. This edge orders all transitions to<br />
RdSh state, <strong>and</strong> is needed in order to capture dependences related<br />
to fence transitions, discussed next. For rd o.f in Tx 3k , the procedure<br />
creates an edge from gLastRdSh, which is Tx 5m , to the current<br />
4
Thread 1<br />
Thread 2 Thread 3 Thread 4 Thread 5<br />
Thread 6<br />
Thread 7<br />
time<br />
transaction<br />
wr o.f<br />
(WrExT1)<br />
Tx1i<br />
write barrier<br />
safe point<br />
read barrier<br />
rd o.g<br />
(RdExT2)<br />
Tx2j<br />
T2.lastRdEx<br />
Tx3k<br />
read barrier<br />
rd o.f<br />
(RdShc+1)<br />
gLastRdSh<br />
rd o.h<br />
(fence)<br />
rd p.q<br />
Tx4l<br />
read barrier<br />
read barrier<br />
(no fence)<br />
gLastRdSh<br />
T4.rdShCount < c<br />
rd p.r<br />
(RdShc)<br />
T4.rdShCount = c+1<br />
T4.rdShCount > c<br />
Tx5m<br />
read barrier<br />
T6.lastRdEx<br />
Tx6n<br />
read barrier<br />
rd p.r<br />
(RdExT6)<br />
Tx7y<br />
write barrier<br />
wr p.q<br />
(WrExT7)<br />
safe point<br />
write barrier<br />
wr o.f<br />
(WrExT1)<br />
safe point<br />
Cross-thread edge types<br />
conflicting<br />
upgrading/fence<br />
Figure 3. An example interleaving of threads executing atomic regions of code as transactions. The figure shows the Octet states after each access <strong>and</strong> the<br />
IDG edges added by ICD.<br />
transaction. Finally, the procedure updates gLastRdSh to point to<br />
the current transaction, Tx 3k .<br />
ICD safely ignores RdEx T<br />
→ WrEx T<br />
upgrading transitions. Any<br />
new dependences created by this transition are already captured<br />
transitively by existing intra-thread <strong>and</strong> cross-thread edges.<br />
Creating cross-thread edges for fence transitions. ICD also captures<br />
happens-before relationships transitively for fence transitions,<br />
in order to capture a possible write–read dependence for RdSh objects.<br />
Each fence transition calls h<strong>and</strong>leFenceTransition() (Algorithm<br />
1), which creates an edge from the last transaction to transition<br />
an object to RdSh (gLastRdSh) to the current transaction.<br />
In Figure 3, T4’s read of o.h triggers a fence transition <strong>and</strong> a call<br />
to h<strong>and</strong>leFenceTransition(), which creates an edge from gLastRdSh<br />
(Tx 3k ) to Tx 4l . This edge helps capture the possible dependence<br />
from T1’s write to T4’s read (in this case, no actual dependence<br />
exists since the fields accessed are different).<br />
After T4 reads o.h, it reads p.q, which does not trigger a fence<br />
transition because T4 has already read an object (o) with a more<br />
recent RdSh counter (c+1) than p’s RdSh counter (c). However, because<br />
RdEx → RdSh transitions create edges between all transactions<br />
that transition an object to RdSh (e.g., the edge from Tx 5m to<br />
Tx 3k ), all write–read dependences are captured by IDG edges even<br />
if they do not trigger a fence transition. In the figure, the IDG edges<br />
added by the procedures transitively capture the dependence from<br />
T7’s write to p.q to T4’s read of p.q.<br />
H<strong>and</strong>ling synchronization operations. Like Velodrome [13], <strong>DoubleChecker</strong><br />
captures dependences not only between reads <strong>and</strong><br />
writes to program variables, but also between synchronization operations:<br />
lock release–acquire, notify–wait, <strong>and</strong> thread fork <strong>and</strong><br />
join. ICD h<strong>and</strong>les these operations by simply treating acquire-like<br />
operations as reads <strong>and</strong> release-like operations as writes, on the<br />
object being synchronized on.<br />
2.2.3 Cycle detection<br />
Rather than triggering cycle detection each time it creates a crossthread<br />
edge (as Velodrome does [13]), ICD waits until a transaction<br />
ends to detect cycles. Consider the following example.<br />
slow path<br />
T1<br />
wr o.f (WrEx T1 )<br />
rd p.q (RdEx T1 )<br />
T2<br />
wr p.q (WrEx T2 )<br />
rd o.g (RdEx T2 )<br />
rd o.f (RdEx T2 )<br />
slow path<br />
fast path<br />
Even if T1 <strong>and</strong> T2 each can trigger cycle detection when they add<br />
cross-thread edges, no precise cycle yet exists until rd o.f executes.<br />
In single-run mode, to ensure that PCD sees the precise cycle,<br />
ICD should report the cycle only after the transaction finishes. By<br />
invoking cycle detection when transactions end, ICD is guaranteed<br />
to detect each cycle at least once. In the first run of multi-run mode,<br />
deferring cycle detection until transactions finish is not strictly<br />
necessary but leads to fewer invocations of cycle detection.<br />
Detecting strongly connected components. A side effect of delayed<br />
cycle detection is that a transaction might be involved in<br />
multiple cycles. ICD therefore computes the maximal strongly connected<br />
component (SCC) [7] starting from the transaction that just<br />
ended, which identifies the set of all transactions that are part of<br />
a cycle. The SCC computation explores a transaction tx only if tx<br />
has finished. This does not affect correctness since if tx is indeed<br />
involved in cycles, an SCC computation launched when tx finishes<br />
will detect those cycles. Avoiding processing unfinished transactions<br />
helps prevent identifying the same cycles multiple times, <strong>and</strong><br />
it avoids races with threads updating their own metadata (e.g., read-<br />
/write log updates by the fast path).<br />
In Figure 3, ICD detects an SCC (in this case, a simple cycle)<br />
of size four when transaction Tx 1i ends. In single-run mode or the<br />
second run of multi-run mode, ICD passes these transactions to<br />
PCD for further processing. Note that PCD will detect a precise<br />
cycle between Tx 1i <strong>and</strong> Tx 3k . In contrast, if Tx 3k did not execute rd<br />
o.f, ICD would still detect an imprecise cycle, but PCD would not<br />
detect a precise cycle since none exists.<br />
2.2.4 Maintaining Read/Write Logs<br />
In single-run mode or the second run of multi-run mode, when ICD<br />
detects a cycle, it passes the set of transactions involved in the cycle<br />
to PCD. PCD also needs to know the exact accesses that have<br />
executed as well as cross-thread ordering between them. To pro-<br />
5
vide this information, ICD records read/write logs [23] for every<br />
transaction: the exact memory accesses (e.g., object fields) read<br />
<strong>and</strong> written by the transaction. To accomplish this, ICD adds instrumentation<br />
before each program access but after Octet’s instrumentation<br />
that records the access in the current thread-local read/write<br />
log. Synchronization operations are recorded as reads or writes to<br />
synchronization objects. ICD provides cross-thread ordering of accesses<br />
by recording, for each IDG edge, not only the source <strong>and</strong><br />
sink transactions of the edge, but also the exact read/write log entries<br />
that correspond to the edge’s source <strong>and</strong> sink.<br />
2.2.5 <strong>Sound</strong>ness Argument<br />
We now argue that ICD is a sound first-pass filter. In particular, we<br />
show that for any actual (precise) cycle of dependences, there exists<br />
an (imprecise) IDG cycle that is a superset of the precise cycle.<br />
Let C be any set of executed nodes tx 1, tx 2, . . . , tx n whose<br />
(sound <strong>and</strong> precise) dependence edges form a (sound <strong>and</strong> precise)<br />
cycle tx 1 → tx 2 → . . . → tx n → tx 1.<br />
Let tx i → tx j be any dependence edge in C. Since ICD adds<br />
edges to the IDG that imply all dependences soundly, there must<br />
exist a path of edges from tx i to tx j in the IDG.<br />
Thus there exists a path tx 1 → tx 2 → . . . → tx n → tx 1 in the<br />
IDG. ICD will detect this as a cycle C ′ ⊇ C <strong>and</strong> pass C ′ to PCD.<br />
Since C ′ contains all nodes in C, <strong>and</strong> PCD computes all dependences<br />
between nodes in C ′ , PCD will compute the dependences<br />
tx 1 → tx 2 → . . . → tx n → tx 1, <strong>and</strong> it will thus detect the cycle C.<br />
2.3 <strong>Precise</strong> Cycle Detection<br />
<strong>Precise</strong> cycle detection (PCD) is a sound <strong>and</strong> precise analysis that<br />
identifies cycles of dependences on a set of transactions provided as<br />
input. <strong>DoubleChecker</strong> invokes PCD with the following input from<br />
ICD: (1) a set of transactions identified by ICD as being involved<br />
in an SCC, (2) the read/write logs of the transactions, <strong>and</strong> (3) the<br />
cross-thread edges added by ICD recorded relative to read/write log<br />
entries (to order conflicting accesses). PCD processes each SCC<br />
identified by ICD separately. Using these inputs, PCD essentially<br />
“replays” the subset of execution corresponding to the transactions<br />
in the IDG cycle, <strong>and</strong> performs a sound <strong>and</strong> precise analysis similar<br />
to Velodrome [13]. PCD uses the read/write ordering information to<br />
replay accesses in an order that reflects the actual execution order.<br />
As PCD simulates replaying execution from logs, it tracks the last<br />
access(es) to each field:<br />
• W(f) is the last transaction to write field f.<br />
• R(T,f) is the last transaction of thread T to read field f.<br />
PCD constructs a precise dependence graph (PDG) based on the<br />
last-access information. A helper function thread(tx) returns the<br />
thread that executes transaction tx. At each read or write of a<br />
field f, the analysis (1) adds a cross-thread edge to the PDG (if a<br />
dependence exists) <strong>and</strong> (2) updates the last-access information of f,<br />
as shown in Algorithm 2.<br />
PCD performs cycle detection on the PDG after adding each crossthread<br />
edge. A detected cycle indicates a precise atomicity violation.<br />
As part of the error log, PCD reports all the transactions <strong>and</strong><br />
edges involved in the precise PDG cycle. For example, in Figure 3,<br />
PCD processes an IDG cycle of size four, computes the PDG, <strong>and</strong><br />
identifies a precise cycle with just two transactions, Tx 1i <strong>and</strong> Tx 3k .<br />
PCD aids debugging by performing blame assignment [13],<br />
which “blames” a transaction for an atomicity violation if its outgoing<br />
edge is created earlier than its incoming edge, implying that<br />
the transaction completes a cycle. In Figure 3, PCD blames Tx 1i .<br />
3. Implementation<br />
We have implemented a prototype of <strong>DoubleChecker</strong> in Jikes RVM<br />
3.1.3 [1], a high-performance Java virtual machine (JVM) that has<br />
Algorithm 2 Rules to update last-access information for a read <strong>and</strong><br />
write of field f by a transaction tx.<br />
procedure READ(f, tx)<br />
if W(f) ≠ null <strong>and</strong> thread(tx) ≠ thread(W(f)) then<br />
Add PDG edge: W(f) → tx<br />
end if<br />
R(T,f) := tx<br />
⊲ Update last read for T<br />
end procedure<br />
procedure WRITE(f, tx)<br />
if W(f) ≠ null <strong>and</strong> thread(tx) ≠ thread(W(f)) then<br />
Add PDG edge: W(f) → tx<br />
end if<br />
for all T, R(T,f) ≠ null do<br />
if thread(R(T,f)) ≠ thread(tx) then<br />
Add PDG edge: R(T,f) → tx<br />
end if<br />
end for<br />
W(f) := tx<br />
⊲ Update last write<br />
∀ T, R(T,f) := null ⊲ Clear all reads<br />
end procedure<br />
performance competitive with commercial JVMs. 4 Our implementation<br />
uses the publicly available Octet implementation [3]. 5 For<br />
comparison purposes, we have also implemented Velodrome [13]<br />
in Jikes RVM since Flanagan et al.’s implementation [13] is not<br />
available (<strong>and</strong> in any case, it is implemented on top of the JVMindependent<br />
RoadRunner framework [11], so its performance characteristics<br />
could differ significantly). We will make our implementations<br />
of <strong>DoubleChecker</strong> <strong>and</strong> Velodrome publicly available.<br />
Specifying atomic regions. <strong>DoubleChecker</strong> takes as input an<br />
atomicity specification, which is currently specified as a list of<br />
methods to be excluded from the specification; all other methods<br />
are part of the specification, i.e., they are expected to execute atomically.<br />
<strong>DoubleChecker</strong> extends Jikes RVM’s dynamic compilers<br />
so each compiled method can statically be either transactional or<br />
non-transactional. Methods specified as atomic are always transactional,<br />
<strong>and</strong> non-atomic methods are compiled as transactional or<br />
non-transactional depending on their caller. The compilers compile<br />
separate versions of non-atomic methods called from both transactional<br />
<strong>and</strong> non-transactional contexts.<br />
Constructing the IDG. The dynamic compilers insert instrumentation<br />
in each atomic method called from a non-transactional context.<br />
At method start, instrumentation creates a new regular transaction.<br />
At method end, it creates a new unary transaction.<br />
Each access outside of a transaction conceptually executes in its<br />
own unary transaction. Following prior work’s optimization [13],<br />
the instrumentation merges consecutive unary transactions not interrupted<br />
by an incoming or outgoing cross-thread edge.<br />
Each transaction maintains (1) a list of its outgoing edges to<br />
other transactions <strong>and</strong>, (2) for single-run mode or the second run of<br />
multi-run mode, a read/write log that is an ordered list of precise<br />
memory access entries. Each read/write log entry corresponds to a<br />
program access; it records the base object reference, field address,<br />
<strong>and</strong> read versus write flag. The read/write log has special entries<br />
that correspond to incoming <strong>and</strong> outgoing cross-thread edges, since<br />
PCD needs to know access order with respect to cross-thread edges.<br />
Transactions (<strong>and</strong> their read/write logs) are regular Java objects<br />
in our implementation, so garbage collection (GC) naturally<br />
collects them as they become transitively unreachable from each<br />
thread’s current transaction reference. The implementation treats<br />
read/write log entries as weak references 6 to avoid memory leaks.<br />
When a reference in a read/write log entry dies, our modified GC<br />
4 http://dacapo.anu.edu.au/regression/perf/9.12-bach.html<br />
5 http://www.jikesrvm.org/Research+Archive<br />
6 http://www.ibm.com/developerworks/java/library/j-jtp11225/<br />
6
eplaces the reference with the old field address <strong>and</strong> the current GC<br />
number, distinguishing the field precisely.<br />
Instrumenting program accesses. The compilers add read <strong>and</strong><br />
write barriers at (object <strong>and</strong> static) field accesses in application<br />
methods. They do not currently instrument array accesses, nor any<br />
accesses in Java library methods, in order to imitate the closest related<br />
prior work [10, 13]. They instrument program synchronization<br />
by treating acquire operations like object reads, <strong>and</strong> release<br />
operations like object writes. ICD extends Octet’s slow path to perform<br />
the procedures in Algorithm 1 (Section 2.2.2).<br />
If PCD executes in the same run, ICD adds instrumentation to<br />
record read/write logs. Although logs are ordered, duplicate entries<br />
with no incoming or outgoing edges between them can be merged<br />
to save space. ICD tracks the last entry information using per-field<br />
metadata for WrEx <strong>and</strong> RdEx objects <strong>and</strong> per-thread hash tables for<br />
RdSh objects, in order to elide duplicate entries on the fly.<br />
Velodrome implementation. Our <strong>DoubleChecker</strong> <strong>and</strong> Velodrome<br />
implementations share features as much as possible: they instrument<br />
the same accesses, demarcate transactions the same way, <strong>and</strong><br />
represent transactional dependence graphs the same way. The Velodrome<br />
implementation does not use Octet. It adds two words for<br />
each object <strong>and</strong> static field: one references the transaction to write<br />
the field, <strong>and</strong> the other references the last transaction(s) (up to one<br />
per thread) to read the field since the last write. To capture release–<br />
acquire dependences, each object has an extra header word to track<br />
the last transaction to release the object’s lock.<br />
At each access, instrumentation detects cross-thread dependences,<br />
adds them to the transactional dependence graph, detects<br />
cycles (<strong>and</strong> reports a precise atomicity violation for each cycle),<br />
<strong>and</strong> updates the field’s last-access information. To provide check–<br />
access atomicity <strong>and</strong> thus track cross-thread dependences accurately,<br />
the instrumentation executes a small critical section around<br />
each check <strong>and</strong> access that “locks” the field’s last-writer metadata<br />
using an atomic operation (e.g., compare-<strong>and</strong>-swap instruction).<br />
4. Evaluation<br />
This section evaluates the correctness <strong>and</strong> performance of our prototype<br />
implementation of <strong>DoubleChecker</strong> in both single- <strong>and</strong> multirun<br />
modes <strong>and</strong> compares with Velodrome.<br />
4.1 Methodology<br />
Benchmarks. Our experiments run the following programs: the<br />
multithreaded DaCapo Benchmarks that Jikes RVM 3.1.3 executes<br />
[2]: eclipse6, hsqldb6, lusearch6, xalan6, avrora9, jython9, luindex9,<br />
lusearch9, 7 pmd9, sunflow9, <strong>and</strong> xalan9 (suffixes ‘6’ <strong>and</strong> ‘9’<br />
indicate benchmarks from versions 2006-10-MR2 <strong>and</strong> 9.12-bach,<br />
respectively). We also execute the following programs since they<br />
have been used in prior work [10, 13]: the microbenchmarks elevator,<br />
hedc, philo, sor, <strong>and</strong> tsp [32]; <strong>and</strong> moldyn, montecarlo, <strong>and</strong><br />
raytracer from the Java Gr<strong>and</strong>e benchmark suite [28].<br />
Experimental setup. We build a high-performance configuration<br />
of the VM (FastAdaptive) that adaptively optimizes the application<br />
<strong>and</strong> uses a high-performance generational garbage collector. We<br />
let the VM adjust the heap size automatically. Our experiments<br />
use the small workload size of the DaCapo benchmarks, since<br />
<strong>DoubleChecker</strong>’s single-run mode runs out of memory with larger<br />
workload sizes for a few benchmarks. For benchmarks other than<br />
DaCapo, we use the same input configurations as described in prior<br />
work [10, 13]. Since the VM targets the IA-32 platform, programs<br />
are limited to a heap of roughly 1.5–2 GB; a 64-bit implementation<br />
could avoid these out-of-memory errors.<br />
For <strong>DoubleChecker</strong>’s multi-run mode, we execute 10 trials of<br />
the first run, take the union of the transactions reported as part of<br />
ICD cycles, <strong>and</strong> use it as input for the second run. This methodol-<br />
7 We use a version of lusearch9 that fixes a serious memory leak [37].<br />
run, main,<br />
join, notify,<br />
wait, etc.<br />
<strong>DoubleChecker</strong> /<br />
Velodrome<br />
exclude from<br />
specification<br />
new violations<br />
reported?<br />
Yes<br />
No<br />
atomicity<br />
specification<br />
Figure 4. Iterative refinement methodology to generate an atomicity specification<br />
for a benchmark.<br />
ogy represents a point in the accuracy–performance tradeoff that we<br />
anticipate would be used in practice: combining information from<br />
multiple first runs should help a second run find more atomicity<br />
violations but also increase its overhead.<br />
Platform. The experiments execute on a workstation with a 3.30<br />
GHz 4-core Intel i5 processor, with 4 GB memory running 64-bit<br />
RedHat Enterprise Linux 6.4, kernel 2.6.32.<br />
Deriving atomicity specifications. <strong>Atomicity</strong> specifications for the<br />
benchmarks either have not been determined by prior work (Da-<br />
Capo) or are not publicly available (non-DaCapo). We derive specifications<br />
for all the programs using an iterative refinement methodology<br />
used successfully by prior work [10, 12, 13, 33]. Figure 4<br />
illustrates iterative refinement. First, all methods are assumed to be<br />
atomic with a few exceptions: top-level methods (e.g., main() <strong>and</strong><br />
Thread.run()) <strong>and</strong> methods that contain interrupting calls (e.g., to<br />
wait() or notify()). 8 Iterative refinement repeatedly removes methods<br />
from the specification when they are “blamed” for detected<br />
atomicity violations. We terminate iterative refinement only when<br />
no new atomicity violations are reported after 10 trials, which simulates<br />
the case of well-tested software with an accurate atomicity<br />
specification <strong>and</strong> few known atomicity violations.<br />
We use iterative refinement in two ways. First, we use it to<br />
evaluate the soundness of <strong>DoubleChecker</strong>’s single- <strong>and</strong> multirun<br />
modes by comparing the set of atomicity violations reported<br />
by Velodrome <strong>and</strong> <strong>DoubleChecker</strong>’s single- <strong>and</strong> multi-run modes<br />
(Section 4.2). For each of the three configurations, we perform iterative<br />
refinement to completion (Figure 4) <strong>and</strong> collect all methods<br />
blamed as non-atomic along the way.<br />
Second, we use iterative refinement to determine specifications<br />
that lead to few or no atomicity violations, in order to evaluate<br />
performance (Section 4.3). We take the intersection of the finalized<br />
specifications (no more violations reported) for both Velodrome<br />
<strong>and</strong> <strong>DoubleChecker</strong> (single-run mode, since it is fully sound by<br />
design), in order to eliminate any bias toward one approach.<br />
We adjust the specifications in a few cases because of implementation<br />
issues. raytracer <strong>and</strong> sunflow9 have one <strong>and</strong> two longrunning<br />
transactions, respectively, that execute atomically <strong>and</strong> that<br />
ICD passes to PCD, causing PCD to run out of memory, so we exclude<br />
the corresponding methods from the specifications. On the<br />
flip side, refining the specifications of xalan6 <strong>and</strong> avrora9 leads to<br />
so many transactions being created that <strong>DoubleChecker</strong> <strong>and</strong> Velodrome,<br />
9 respectively, run out of memory, so we use intermediate<br />
(not fully refined) specifications for these programs.<br />
4.2 <strong>Sound</strong>ness<br />
<strong>DoubleChecker</strong>’s single-run mode is sound <strong>and</strong> precise by design.<br />
By comparing it to Velodrome, we sanity-check our implementations<br />
while also measuring the effect of timing differences caused<br />
by the two algorithms. Multi-run mode is not fully sound, so by<br />
comparing it to Velodrome <strong>and</strong> single-run mode, we evaluate how<br />
sound it is in practice. A caveat of this comparison is that the first<br />
<strong>and</strong> second runs use the same program inputs, thus representing an<br />
upper bound on soundness guarantees.<br />
8 For simplicity, we also exclude the DaCapo benchmarks’ driver thread<br />
(which launches worker threads that actually run the benchmark program)<br />
from the atomicity specification, since we know it executes non-atomically.<br />
9 Velodrome may run out of memory if per-field metadata keeps otherwisedead<br />
transactions alive. We will investigate using weak references.<br />
7
Normalized execution time<br />
9<br />
8<br />
7<br />
6<br />
5<br />
4<br />
3<br />
2<br />
1<br />
0<br />
13.0<br />
9.2<br />
180.3<br />
avrora9<br />
xalan6<br />
lusearch6<br />
hsqldb6<br />
eclipse6<br />
13.1 11.3 211.2<br />
Unmodified Jikes RVM<br />
Velodrome<br />
Single-run (ICD+PCD)<br />
First run (ICD w/o logging)<br />
Second run (ICD+PCD)<br />
sor<br />
xalan9<br />
sunflow9<br />
pmd9<br />
lusearch9<br />
luindex9<br />
jython9<br />
9.7 9.6 10.3<br />
115.8<br />
tsp<br />
moldyn<br />
18.7<br />
62.2<br />
raytracer<br />
montecarlo<br />
geomean<br />
Figure 5. Run-time performance comparisons of Velodrome, <strong>DoubleChecker</strong> in the single-run mode, <strong>and</strong> the first <strong>and</strong> second runs of <strong>DoubleChecker</strong> in the<br />
multi-run mode. The sub-bars show GC time.<br />
Velodrome<br />
<strong>DoubleChecker</strong><br />
Total (Unique) Single-run Multi-run (Unique)<br />
eclipse6 230 (8) 244 190 (8)<br />
hsqldb6 10 (0) 56 56 (0)<br />
lusearch6 1 (0) 1 1 (0)<br />
xalan6 57 (0) 69 54 (0)<br />
avrora9 22 (0) 25 18 (0)<br />
jython9 0 (0) 0 0 (0)<br />
luindex9 0 (0) 0 0 (0)<br />
lusearch9 41 (1) 40 38 (0)<br />
pmd9 0 (0) 0 0 (0)<br />
sunflow9 13 (1) 13 13 (0)<br />
xalan9 78 (0) 82 69 (0)<br />
elevator 2 (0) 2 2 (0)<br />
hedc 3 (1) 3 2 (0)<br />
philo 0 (0) 0 0 (0)<br />
sor 0 (0) 0 0 (0)<br />
tsp 7 (0) 7 7 (0)<br />
moldyn 0 (0) 0 0 (0)<br />
montecarlo 2 (0) 2 2 (0)<br />
raytracer 0 (0) 0 0 (0)<br />
Total 466 (11) 544 452 (8)<br />
Table 2. Static atomicity violations reported by our implementations of<br />
Velodrome <strong>and</strong> <strong>DoubleChecker</strong>. For Velodrome <strong>and</strong> the multi-run mode,<br />
Unique counts how many violations were not reported by single-run mode.<br />
Table 2 shows the number of violations reported across all trials<br />
<strong>and</strong> all steps of iterative refinement, for each atomicity checker.<br />
Each violation is a method identified by blame assignment at least<br />
once. Overall, the violations reported by Velodrome <strong>and</strong> Double-<br />
Checker’s single-run mode match closely. In theory both implementations<br />
are sound <strong>and</strong> precise, hence the violations reported<br />
should match exactly, but timing effects can lead to different interleavings.<br />
The Unique value in parentheses counts violations reported<br />
by Velodrome but not by single-run mode; it is nonzero for<br />
just four programs, indicating single-run mode finds nearly all violations<br />
found by Velodrome. Similarly, single-run mode finds several<br />
more violations than Velodrome in a few cases. We investigated<br />
the program with the greatest discrepancy, hsqldb6. By inserting<br />
r<strong>and</strong>om timing delays in Velodrome, we were able to reproduce six<br />
violations reported by <strong>DoubleChecker</strong>, suggesting differences may<br />
be due to timing effects.<br />
Not surprisingly, multi-run mode does not quite detect as many<br />
violations as the sound single-run mode. Overall, multi-run modes<br />
detects 83% of all violations detected by single-run mode. Normalizing<br />
the detection rate across programs with at least one violation,<br />
multi-run mode detects 90% of a program’s violations on average.<br />
which may be worthwhile in exchange for multi-run mode’s lower<br />
run-time overhead (discussed next). Multi-run mode finds violations<br />
not found by single-run mode only for eclipse6; some but not<br />
all of these are the same violations found by Velodrome but not<br />
single-run mode.<br />
4.3 Performance<br />
This section compares the performance of Velodrome, Double-<br />
Checker’s single-run mode, <strong>and</strong> the first <strong>and</strong> second runs of <strong>DoubleChecker</strong>’s<br />
multi-run mode. We use refined specifications that<br />
lead to no atomicity violation reports (Section 4.1). We exclude<br />
elevator, philo, <strong>and</strong> hedc since they are not compute bound [13].<br />
Figure 5 shows the execution time of Jikes RVM running various<br />
configurations of the Velodrome <strong>and</strong> <strong>DoubleChecker</strong> implementations.<br />
Execution times are normalized to the first configuration,<br />
Unmodified Jikes RVM. Each bar is the median of 25 trials to<br />
minimize effects of any machine noise. We also show the mean as<br />
the center of 95% confidence intervals. Sub-bars show the fraction<br />
of time taken by stop-the-world GC.<br />
Our implementation of Velodrome slows programs by 8.7X on<br />
average. This result corresponds with the 12.7X slowdown reported<br />
in prior work [13], although they are hard to compare since we<br />
implement Velodrome in a JVM <strong>and</strong> use different benchmarks.<br />
Comparing results for the benchmarks evaluated by prior work,<br />
we find that our implementation adds substantially more overhead<br />
in several cases. In particular, the Velodrome paper reports 71.7X,<br />
4.5X, <strong>and</strong> 9.2X slowdowns for tsp, moldyn, <strong>and</strong> raytracer, respectively<br />
[13]. It is somewhat surprising that our implementation in a<br />
JVM would add more overhead than the dynamic bytecode instrumentation<br />
approach by the Velodrome authors [11, 13]. By running<br />
various partial configurations, we find that more than half (54%)<br />
of this overhead comes from synchronization required to provide<br />
analysis–access atomicity, which is unsurprising since atomic operations<br />
can lead to remote cache misses on otherwise mostly-readshared<br />
accesses. We have learned from the Velodrome authors that<br />
their implementation eschews synchronization when metadata does<br />
not actually need to change (i.e., the current transaction is already<br />
the last writer or reader). This optimization is unsound <strong>and</strong> can miss<br />
dependences in the presence of data races. To check the benefits of<br />
this unsound optimization, we have also implemented an unsound<br />
configuration of Velodrome, which slows programs by 5X on aver-<br />
8
Single-run mode (or first run of multi-run mode)<br />
Second run of multi-run mode<br />
# Instrumented # Instrumented<br />
Name<br />
Regular Regular Unary # IDG # ICD Regular Regular Unary # IDG # ICD<br />
transactions accesses accesses edges SCCs transactions accesses accesses edges SCCs<br />
eclipse6 2,000,000 165,000,000 6,050,000 235,000 155 1,720,000 62,200,000 5,400,000 112,000 101<br />
hsqldb6 86,300 13,400,000 147,000 26,100 80 85,700 10,100,000 147,000 25,700 76<br />
lusearch6 96,400 144,000,000 124,000 17 0 0 0 0 0 0<br />
xalan6 4,280,000 85,300,000 2,440,000 210,000 18,700 4,270,000 85,200,000 2,450,000 213,000 18,900<br />
avrora9 1,770,000 623,000,000 3,770,000 624,000 159,000 1,110,000 271,000,000 3,770,000 504,000 134,000<br />
jython9 8 53,200,000 29 0 0 0 0 0 0 0<br />
luindex9 7 8,550,000 25 0 0 0 0 0 0 0<br />
lusearch9 1,120,000 142,000,000 731,000 141 6 65,700 13,700,000 36,540 138 6<br />
pmd9 7 2,650,000 25 0 0 0 0 0 0 0<br />
sunflow9 35,200 265,000,000 129,000 1033 29 10,600 202,000,000 129,000 986 29<br />
xalan9 4,760,000 77,500,000 3,760,000 75,130 667 4,720,000 77,600,000 3,690,000 74,900 702<br />
elevator 3203 17,000 5,590 431 49 3,180 16,100 5,590 408 32<br />
hedc 79 38,400 114 87 4 25 38,400 114 85 3<br />
philo 6 16 459 140 0 0 0 0 0 0<br />
sor 2 16 18,700 303 0 0 0 0 0 0<br />
tsp 22,200 408,000 691,000,000 13,800 1 6,520 29,000 692,000,000 11,700 1<br />
moldyn 1,360,000 1,070,000,000 211,000,000 37 0 0 0 0 0 0<br />
montecarlo 170,000 272,000,000 230,000 31,100 3,910 160,000 252,000,000 230,000 31,100 3,880<br />
raytracer 90,000 3,100,000,000 422,000,000 278 1 4 113 0 9 1<br />
Table 3. Run-time characteristics of <strong>DoubleChecker</strong> for the single-run <strong>and</strong> the second run in the multi-run mode. Each average is rounded to a whole number<br />
with at most three significant digits, with ranges representing small integers that vary from run to run.<br />
age, providing the most help to the most afflicted programs. <strong>DoubleChecker</strong><br />
still outperforms this unsound variant of Velodrome.<br />
The remaining configurations in Figure 5 are for Double-<br />
Checker. All <strong>DoubleChecker</strong> configurations run ICD, which uses<br />
Octet. Octet alone adds 38% overhead on average (not shown).<br />
Single-run (ICD+PCD) shows the execution time of running<br />
ICD <strong>and</strong> PCD in the same execution. This configuration slows programs<br />
by 3.5X (250% overhead) on average. Using partial configurations,<br />
we find that around half (126%) of this overhead comes<br />
from Octet, building the IDG using Octet concurrency control protocol,<br />
<strong>and</strong> detecting IDG cycles. (This partial configuration is similar<br />
to the first run of multi-run mode, presented next.) Logging<br />
read <strong>and</strong> write accesses as part of ICD adds another 114% overhead.<br />
Figure 5 shows that a substantial amount of the slowdown<br />
(around 38%) comes from GC for several programs, largely because<br />
of the memory footprint of long-lived read/write logs. In all,<br />
ICD adds 240% overhead. Just 10% overhead on average comes<br />
from PCD, since ICD filters out most transactions. Overall Double-<br />
Checker’s single-run mode avoids much of Velodrome’s synchronization<br />
costs <strong>and</strong> adds 3.1 times less overhead than Velodrome.<br />
First run (ICD w/o logging) executes only ICD, without logging<br />
of read <strong>and</strong> write accesses. Its functionality is similar to a subset of<br />
single-run mode that we evaluated above, <strong>and</strong> its overhead is unsurprising:<br />
it slows programs by 2.2X (120% overhead) on average.<br />
The first run of multi-run mode is significantly faster than ICD in<br />
the single-run mode primarily because it avoids logging.<br />
Second run (ICD+PCD) executes both ICD <strong>and</strong> PCD (similar to<br />
single-run mode), except it only instruments transactions statically<br />
identified by the first run, <strong>and</strong> it instruments non-transactional accesses<br />
if <strong>and</strong> only if the first run identified any non-transactional accesses<br />
involved in cycles. The second run slows programs by 2.2X<br />
(120% overhead) on average (coincidentally the same as for the<br />
first run; the first <strong>and</strong> second runs’ speedups over single-run mode<br />
come from entirely different sources).<br />
Since the first run detects few imprecise cycles, one might<br />
expect the second run would have little work to do. However,<br />
the first run identifies transactions statically by method signature,<br />
leading to many more instrumented accesses in the second run than<br />
the total number of accesses identified as involved in cycles in the<br />
first run. The filter for unary accesses is even coarser; the second<br />
run must instrument all unary accesses in many cases. For this<br />
reason, <strong>DoubleChecker</strong>’s ICD <strong>and</strong> PCD analyses perform better<br />
than using Velodrome for the second run, i.e., ICD is still effective<br />
as a dynamic transaction filter in the second run. Using Velodrome<br />
for the second run (i.e., instrumenting only the transaction statically<br />
identified by the first run) slows programs by 3.2X.<br />
A promising direction for future work is to devise an effective<br />
way for the first run to more precisely communicate potentially<br />
imprecise cycles to the second run.<br />
Overall, <strong>DoubleChecker</strong> substantially outperforms prior art.<br />
The single-run mode is a fully sound <strong>and</strong> precise atomicity checker<br />
that adds 3.1 times less overhead than Velodrome. Multi-run mode<br />
does not guarantee soundness, since atomicity checking is split<br />
between two runs, but it avoids the need for logging all program<br />
accesses (which the single-run mode needs in order to perform a<br />
precise analysis). The first <strong>and</strong> second runs of the multi-run mode<br />
each add 6.4 times less overhead than Velodrome, providing a<br />
performance–accuracy tradeoff that is likely worthwhile in practice<br />
for providing more acceptable overhead for checking atomicity.<br />
<strong>DoubleChecker</strong>’s significant performance benefits justify our<br />
design’s key insights (Sections 1 <strong>and</strong> 2). Our experimental results<br />
show that it is indeed cheaper to track cross-thread dependences<br />
imprecisely in order to filter most of a program’s execution from<br />
processing by a precise analysis.<br />
4.4 Run-Time Characteristics<br />
Table 3 shows execution characteristics of ICD in single-run mode<br />
(the first run of multi-run mode provides the same results) <strong>and</strong> the<br />
second run of multi-run mode. Each value is the mean of 10 trials<br />
of a special statistics-gathering configuration of <strong>DoubleChecker</strong>;<br />
otherwise methodology is the same as Figure 5. For each of the<br />
two configurations, the table reports the number of transactions<br />
<strong>and</strong> (regular <strong>and</strong> unary) accesses instrumented, <strong>and</strong> the number of<br />
edges <strong>and</strong> SCCs in the IDG. Single-run mode instruments everything,<br />
while the second run instruments a subset of transactions. For<br />
several programs, the second run avoids instrumenting anything because<br />
the first run reports no SCCs. For one program (raytracer), the<br />
second run avoids instrumenting any unary accesses since no firstrun<br />
SCC contained a unary transaction, but other programs instrument<br />
all unary accesses. For programs where the second run instruments<br />
(nearly) all transactions <strong>and</strong> accesses, there is little benefit<br />
from multi-run mode’s optimization. Even when they should be the<br />
9
same, the counts sometimes differ across modes due to run-to-run<br />
nondeterminism.<br />
Compared to how many memory accesses execute, there are few<br />
ICD edges, justifying ICD’s approach that optimistically assumes<br />
accesses are not involved in cross-thread dependences. There are<br />
few ICD SCCs in most cases, justifying <strong>DoubleChecker</strong>’s dualanalysis<br />
approach <strong>and</strong> explaining why PCD adds low overhead.<br />
5. Related Work<br />
This section details other static <strong>and</strong> dynamic analyses besides the<br />
most closely related work, Velodrome [13].<br />
Statically checking atomicity. Static approaches can check all inputs<br />
soundly, but they are imprecise, <strong>and</strong> in practice they do not<br />
scale well to large programs nor to dynamic language features such<br />
as dynamic class loading. Type systems can help check atomicity<br />
but require a combination of type inference <strong>and</strong> programmer annotations<br />
[12, 14]. Model checking does not scale well to large programs<br />
because of state space explosion [8, 9, 16]. Static approaches<br />
are well suited to analyzing critical sections but not wait–notify<br />
synchronization.<br />
Dynamically checking atomicity. Wang <strong>and</strong> Stoller propose two<br />
dynamic analyses for checking atomicity based on detecting unserializable<br />
patterns [34]. These approaches aim to find potential violations<br />
in other executions, but this process is inherently imprecise, so<br />
they may report false positives. The authors also propose “commitnode”<br />
algorithms, which are more precise <strong>and</strong> check conflict serializability<br />
<strong>and</strong> view serializability [33]. Atomizer is a dynamic atomicity<br />
checker that uses a variation of the lockset algorithm [27] to<br />
determine shared variables that can have racy accesses, <strong>and</strong> monitors<br />
those variables for potential atomicity violations. Atomizer<br />
reports false positives since it relies on the locket algorithm. Like<br />
Velodrome, these dynamic approaches slow programs by an order<br />
of magnitude or more.<br />
Inferring atomicity specifications. Several approaches infer an<br />
atomicity specification automatically [6, 15, 21, 30, 35]. However,<br />
these approaches are inherently unsound <strong>and</strong> imprecise. Furthermore,<br />
many of these approaches add high overhead to track crossthread<br />
dependences accurately, e.g., AVIO slows programs by more<br />
than an order of magnitude [21].<br />
Alternatives. HAVE combines static <strong>and</strong> dynamic analysis to obtain<br />
benefits of both approaches [4]. Because HAVE speculates<br />
about untaken branches, it can report false positives. Prior work<br />
exposes atomicity violations [25, 26, 29], which is complementary<br />
to checking atomicity.<br />
Transactional memory enforces programmer-specified atomicity<br />
annotations by speculatively executing atomic regions as transactions,<br />
which are rolled back if a region conflict occurs [17].<br />
Atom-Aid relies on custom hardware to execute regions atomically<br />
<strong>and</strong> to detect some atomicity violations [22].<br />
<strong>Atomicity</strong> can be achieved using static analysis that infers<br />
needed locks automatically from an atomicity specification, but it<br />
is inherently imprecise, leading to overly conservative locking [5].<br />
In summary, most prior work gives up on soundness or precision<br />
or both, <strong>and</strong> dynamic approaches slow programs substantially. In<br />
contrast, <strong>DoubleChecker</strong> checks conflict serializability soundly <strong>and</strong><br />
precisely <strong>and</strong> significantly outperforms other dynamic approaches.<br />
6. Conclusion<br />
This paper presents a new direction for dynamic sound <strong>and</strong> precise<br />
atomicity checking that divides work into two cooperating analyses:<br />
a lightweight analysis that detects cross-thread dependences,<br />
<strong>and</strong> thus atomicity violations, soundly but imprecisely, <strong>and</strong> a precise<br />
second analysis that focuses on potential cycles <strong>and</strong> rules out<br />
false positives. These cooperating analyses can execute in a single<br />
run, or the imprecise analysis can first run by itself, providing a<br />
performance–soundness tradeoff. <strong>DoubleChecker</strong> outperforms existing<br />
sound <strong>and</strong> precise atomicity checking, reducing overhead by<br />
several times, suggesting that its new direction can provide substantially<br />
more efficient atomicity checking than existing work.<br />
Acknowledgments<br />
We thank Harry Xu <strong>and</strong> Jaeheon Yi for feedback on the paper<br />
text; <strong>and</strong> Cormac Flanagan, Stephen Freund, <strong>and</strong> Jaeheon Yi for<br />
discussions <strong>and</strong> advice.<br />
References<br />
[1] B. Alpern, S. Augart, S. M. Blackburn, M. Butrico, A. Cocchi,<br />
P. Cheng, J. Dolby, S. Fink, D. Grove, M. Hind, K. S. McKinley,<br />
M. Mergen, J. E. B. Moss, T. Ngo, <strong>and</strong> V. Sarkar. The Jikes Research<br />
Virtual Machine Project: Building an Open-Source Research Community.<br />
IBM Systems Journal, 44:399–417, 2005.<br />
[2] S. M. Blackburn, R. Garner, C. Hoffman, A. M. Khan, K. S. McKinley,<br />
R. Bentzur, A. Diwan, D. Feinberg, D. Frampton, S. Z. Guyer,<br />
M. Hirzel, A. Hosking, M. Jump, H. Lee, J. E. B. Moss, A. Phansalkar,<br />
D. Stefanović, T. VanDrunen, D. von Dincklage, <strong>and</strong> B. Wiedermann.<br />
The DaCapo Benchmarks: Java Benchmarking Development<br />
<strong>and</strong> Analysis. In OOPSLA, pages 169–190, 2006.<br />
[3] M. D. Bond, M. Kulkarni, M. Cao, M. Zhang, M. Fathi Salmi,<br />
S. Biswas, A. Sengupta, <strong>and</strong> J. Huang. Octet: Capturing <strong>and</strong> Controlling<br />
Cross-Thread Dependences <strong>Efficient</strong>ly. In OOPSLA, pages<br />
693–712, 2013.<br />
[4] Q. Chen, L. Wang, Z. Yang, <strong>and</strong> S. D. Stoller. HAVE: Detecting<br />
<strong>Atomicity</strong> Violations via Integrated Dynamic <strong>and</strong> Static Analysis. In<br />
FASE, pages 425–439, 2009.<br />
[5] S. Cherem, T. Chilimbi, <strong>and</strong> S. Gulwani. Inferring Locks for Atomic<br />
Sections. In PLDI, pages 304–315, 2008.<br />
[6] L. Chew <strong>and</strong> D. Lie. Kivati: Fast Detection <strong>and</strong> Prevention of <strong>Atomicity</strong><br />
Violations. In EuroSys, pages 307–320, 2010.<br />
[7] T. H. Cormen, C. E. Leiserson, R. L. Rivest, <strong>and</strong> C. Stein. Introduction<br />
to Algorithms, chapter 11. The MIT Press, McGraw-Hill Book<br />
Company, 2nd edition, 2001.<br />
[8] A. Farzan <strong>and</strong> P. Madhusudan. Causal <strong>Atomicity</strong>. In CAV, pages 315–<br />
328, 2006.<br />
[9] C. Flanagan. Verifying Commit-<strong>Atomicity</strong> Using Model-<strong>Checking</strong>. In<br />
SPIN, pages 252–266, 2004.<br />
[10] C. Flanagan <strong>and</strong> S. N. Freund. Atomizer: A Dynamic <strong>Atomicity</strong><br />
Checker for Multithreaded Programs. SCP, 71(2):89–109, 2008.<br />
[11] C. Flanagan <strong>and</strong> S. N. Freund. The RoadRunner Dynamic Analysis<br />
Framework for Concurrent Programs. In PASTE, pages 1–8, 2010.<br />
[12] C. Flanagan, S. N. Freund, M. Lifshin, <strong>and</strong> S. Qadeer. Types for <strong>Atomicity</strong>:<br />
Static <strong>Checking</strong> <strong>and</strong> Inference for Java. TOPLAS, 30(4):20:1–<br />
20:53, 2008.<br />
[13] C. Flanagan, S. N. Freund, <strong>and</strong> J. Yi. Velodrome: A <strong>Sound</strong> <strong>and</strong><br />
Complete Dynamic <strong>Atomicity</strong> Checker for Multithreaded Programs.<br />
In PLDI, pages 293–303, 2008.<br />
[14] C. Flanagan <strong>and</strong> S. Qadeer. A Type <strong>and</strong> Effect System for <strong>Atomicity</strong>.<br />
In PLDI, pages 338–349, 2003.<br />
[15] C. Hammer, J. Dolby, M. Vaziri, <strong>and</strong> F. Tip. Dynamic Detection of<br />
Atomic-Set-Serializability Violations. In ICSE, pages 231–240, 2008.<br />
[16] J. Hatcliff, Robby, <strong>and</strong> M. B. Dwyer. Verifying <strong>Atomicity</strong> Specifications<br />
for Concurrent Object-Oriented Software using Model-<br />
<strong>Checking</strong>. In VMCAI, pages 175–190, 2004.<br />
[17] M. Herlihy <strong>and</strong> J. E. B. Moss. Transactional Memory: Architectural<br />
Support for Lock-Free Data Structures. In ISCA, pages 289–300,<br />
1993.<br />
[18] L. Lamport. Time, Clocks, <strong>and</strong> the Ordering of Events in a Distributed<br />
System. CACM, 21(7):558–565, 1978.<br />
[19] B. R. Liblit. Cooperative Bug Isolation. PhD thesis, University of<br />
California at Berkeley, 2004.<br />
[20] S. Lu, S. Park, E. Seo, <strong>and</strong> Y. Zhou. Learning from Mistakes: A Comprehensive<br />
Study on Real World Concurrency Bug Characteristics. In<br />
ASPLOS, pages 329–339, 2008.<br />
[21] S. Lu, J. Tucek, F. Qin, <strong>and</strong> Y. Zhou. AVIO: Detecting <strong>Atomicity</strong><br />
Violations via Access-Interleaving Invariants. In ASPLOS, pages 37–<br />
48, 2006.<br />
10
[22] B. Lucia, J. Devietti, K. Strauss, <strong>and</strong> L. Ceze. Atom-Aid: Detecting<br />
<strong>and</strong> Surviving <strong>Atomicity</strong> Violations. In ISCA, pages 277–288, 2008.<br />
[23] K. E. Moore, J. Bobba, M. J. Moravan, M. D. Hill, <strong>and</strong> D. A. Wood.<br />
LogTM: Log-based Transactional Memory. In HPCA, pages 254–265,<br />
2006.<br />
[24] M. S. Papamarcos <strong>and</strong> J. H. Patel. A Low-Overhead Coherence<br />
Solution for Multiprocessors with Private Cache Memories. In ISCA,<br />
pages 348–354, 1984.<br />
[25] C.-S. Park <strong>and</strong> K. Sen. R<strong>and</strong>omized Active <strong>Atomicity</strong> Violation<br />
Detection in Concurrent Programs. In FSE, pages 135–145, 2008.<br />
[26] S. Park, S. Lu, <strong>and</strong> Y. Zhou. CTrigger: Exposing <strong>Atomicity</strong> Violation<br />
Bugs from Their Hiding Places. In ASPLOS, pages 25–36, 2009.<br />
[27] S. Savage, M. Burrows, G. Nelson, P. Sobalvarro, <strong>and</strong> T. Anderson.<br />
Eraser: A Dynamic Data Race Detector for Multi-Threaded Programs.<br />
In SOSP, pages 27–37, 1997.<br />
[28] L. A. Smith, J. M. Bull, <strong>and</strong> J. Obdrzálek. A Parallel Java Gr<strong>and</strong>e<br />
Benchmark Suite. In SC, pages 8–8, 2001.<br />
[29] F. Sorrentino, A. Farzan, <strong>and</strong> P. Madhusudan. PENELOPE: Weaving<br />
Threads to Expose <strong>Atomicity</strong> Violations. In FSE, pages 37–46, 2010.<br />
[30] W. N. Sumner, C. Hammer, <strong>and</strong> J. Dolby. Marathon: Detecting<br />
Atomic-Set Serializability Violations with Conflict Graphs. In RV,<br />
pages 161–176, 2012.<br />
[31] U.S.–Canada Power System Outage Task Force. Final Report on the<br />
August 14th Blackout in the United States <strong>and</strong> Canada. Technical<br />
report, Department of Energy, 2004.<br />
[32] C. von Praun <strong>and</strong> T. R. Gross. Static Conflict Analysis for Multi-<br />
Threaded Object-Oriented Programs. In PLDI, pages 115–128, 2003.<br />
[33] L. Wang <strong>and</strong> S. D. Stoller. Accurate <strong>and</strong> <strong>Efficient</strong> Runtime Detection<br />
of <strong>Atomicity</strong> Errors in Concurrent Programs. In PPoPP, pages 137–<br />
146, 2006.<br />
[34] L. Wang <strong>and</strong> S. D. Stoller. Runtime Analysis of <strong>Atomicity</strong> for Multithreaded<br />
Programs. IEEE TSE, 32:93–110, 2006.<br />
[35] M. Xu, R. Bodík, <strong>and</strong> M. D. Hill. A Serializability Violation Detector<br />
for Shared-Memory Server Programs. In PLDI, pages 1–14, 2005.<br />
[36] X. Yang, S. M. Blackburn, D. Frampton, <strong>and</strong> A. L. Hosking. Barriers<br />
Reconsidered, Friendlier Still! In ISMM, pages 37–48, 2012.<br />
[37] X. Yang, S. M. Blackburn, D. Frampton, J. B. Sartor, <strong>and</strong> K. S. McKinley.<br />
Why Nothing Matters: The Impact of Zeroing. In OOPSLA, pages<br />
307–324, 2011.<br />
11