FY 2011-12: Tables: Involuntary Detentions in California.pdf
FY 2011-12: Tables: Involuntary Detentions in California.pdf
FY 2011-12: Tables: Involuntary Detentions in California.pdf

You also want an ePaper? Increase the reach of your titles
YUMPU automatically turns print PDFs into web optimized ePapers that Google loves.
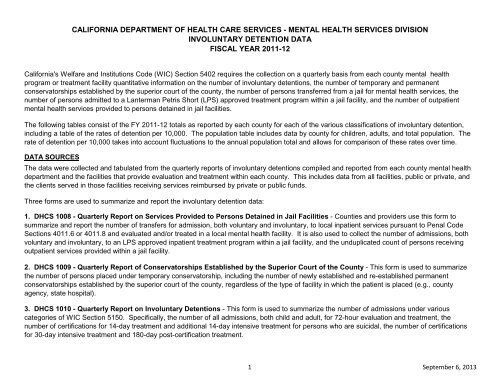
CALIFORNIA DEPARTMENT OF HEALTH CARE SERVICES - MENTAL HEALTH SERVICES DIVISION<br />
INVOLUNTARY DETENTION DATA<br />
FISCAL YEAR <strong>2011</strong>-<strong>12</strong><br />
<strong>California</strong>'s Welfare and Institutions Code (WIC) Section 5402 requires the collection on a quarterly basis from each county mental health<br />
program or treatment facility quantitative <strong>in</strong>formation on the number of <strong>in</strong>voluntary detentions, the number of temporary and permanent<br />
conservatorships established by the superior court of the county, the number of persons transferred from a jail for mental health services, the<br />
number of persons admitted to a Lanterman Petris Short (LPS) approved treatment program with<strong>in</strong> a jail facility, and the number of outpatient<br />
mental health services provided to persons deta<strong>in</strong>ed <strong>in</strong> jail facilities.<br />
The follow<strong>in</strong>g tables consist of the <strong>FY</strong> <strong>2011</strong>-<strong>12</strong> totals as reported by each county for each of the various classifications of <strong>in</strong>voluntary detention,<br />
<strong>in</strong>clud<strong>in</strong>g a table of the rates of detention per 10,000. The population table <strong>in</strong>cludes data by county for children, adults, and total population. The<br />
rate of detention per 10,000 takes <strong>in</strong>to account fluctuations to the annual population total and allows for comparison of these rates over time.<br />
DATA SOURCES<br />
The data were collected and tabulated from the quarterly reports of <strong>in</strong>voluntary detentions compiled and reported from each county mental health<br />
department and the facilities that provide evaluation and treatment with<strong>in</strong> each county. This <strong>in</strong>cludes data from all facilities, public or private, and<br />
the clients served <strong>in</strong> those facilities receiv<strong>in</strong>g services reimbursed by private or public funds.<br />
Three forms are used to summarize and report the <strong>in</strong>voluntary detention data:<br />
1. DHCS 1008 - Quarterly Report on Services Provided to Persons Deta<strong>in</strong>ed <strong>in</strong> Jail Facilities - Counties and providers use this form to<br />
summarize and report the number of transfers for admission, both voluntary and <strong>in</strong>voluntary, to local <strong>in</strong>patient services pursuant to Penal Code<br />
Sections 4011.6 or 4011.8 and evaluated and/or treated <strong>in</strong> a local mental health facility. It is also used to collect the number of admissions, both<br />
voluntary and <strong>in</strong>voluntary, to an LPS approved <strong>in</strong>patient treatment program with<strong>in</strong> a jail facility, and the unduplicated count of persons receiv<strong>in</strong>g<br />
outpatient services provided with<strong>in</strong> a jail facility.<br />
2. DHCS 1009 - Quarterly Report of Conservatorships Established by the Superior Court of the County - This form is used to summarize<br />
the number of persons placed under temporary conservatorship, <strong>in</strong>clud<strong>in</strong>g the number of newly established and re-established permanent<br />
conservatorships established by the superior court of the county, regardless of the type of facility <strong>in</strong> which the patient is placed (e.g., county<br />
agency, state hospital).<br />
3. DHCS 1010 - Quarterly Report on <strong>Involuntary</strong> <strong>Detentions</strong> - This form is used to summarize the number of admissions under various<br />
categories of WIC Section 5150. Specifically, the number of all admissions, both child and adult, for 72-hour evaluation and treatment, the<br />
number of certifications for 14-day treatment and additional 14-day <strong>in</strong>tensive treatment for persons who are suicidal, the number of certifications<br />
for 30-day <strong>in</strong>tensive treatment and 180-day post-certification treatment.<br />
1 September 6, 2013
CALIFORNIA DEPARTMENT OF HEALTH CARE SERVICES - MENTAL HEALTH SERVICES DIVISION<br />
INVOLUNTARY DETENTION DATA<br />
FISCAL YEAR <strong>2011</strong>-<strong>12</strong><br />
The report<strong>in</strong>g applies to all <strong>in</strong>stances of <strong>in</strong>voluntary treatment regardless of fund<strong>in</strong>g source. In other words, persons who are treated <strong>in</strong>voluntarily<br />
<strong>in</strong> private psychiatric facilities, or whose treatment is funded by private resources, must be reported along with persons whose treatment is funded<br />
through Medi-Cal or the county mental health program. The totals also <strong>in</strong>clude <strong>in</strong>voluntary detention data obta<strong>in</strong>ed from State Hospitals.<br />
Population projection data were obta<strong>in</strong>ed from the <strong>California</strong> Department of F<strong>in</strong>ance (DOF).<br />
PROGRAM NOTE<br />
WIC Section 5775(b) permits counties to jo<strong>in</strong>tly agree to deliver or subcontract for the delivery of mental health services. Sutter and Yuba<br />
counties are comb<strong>in</strong>ed under this jo<strong>in</strong>t agreement and their <strong>in</strong>voluntary detention data are displayed as Sutter/Yuba County. Population data for<br />
these two counties are comb<strong>in</strong>ed and presented as Sutter/Yuba County.<br />
DATA METHODOLOGY<br />
In November 1999, the Facility-Based Report<strong>in</strong>g (FBR) method was used to ensure more accurate <strong>in</strong>voluntary detention report<strong>in</strong>g. The FBR<br />
method places the responsibility upon the county <strong>in</strong> which the treatment facility, jail, or court is located to report the number of persons admitted<br />
and deta<strong>in</strong>ed <strong>in</strong>voluntarily. For example, if client "A" it taken to county "B" under WIC Section 5150, then the facility <strong>in</strong> county "B" is required to<br />
report that client as one 5150 admission. County "B" should obta<strong>in</strong> these data from all appropriate facilities with<strong>in</strong> their county. Next, county "B"<br />
is responsible for submitt<strong>in</strong>g a s<strong>in</strong>gle report, quarterly, for each of the three <strong>in</strong>voluntary detention report<strong>in</strong>g areas.<br />
The rate per 10,000 population is an expression of the number of persons <strong>in</strong>voluntarily committed when compared to a segment of the population.<br />
For example, <strong>in</strong> Table Rates for Every 10,000 by Category and County, approximately 38.7 adults were <strong>in</strong>voluntarily committed for 72-hour<br />
evaluation and treatment services. Each range was calculated by divid<strong>in</strong>g the number of persons <strong>in</strong> an <strong>in</strong>voluntary detention classification by an<br />
appropriate population total, either adult, child, or total population and then multiply<strong>in</strong>g the result by 10,000.<br />
DATA LIMITATIONS<br />
The DHCS has learned that some counties have contracted with an outside entity, such as the local Sheriff's Office or a private medical company,<br />
to provide mental health outpatient services <strong>in</strong> jail. In many cases, the contract<strong>in</strong>g agency does not report data on the services provided. Thus,<br />
the count of persons receiv<strong>in</strong>g mental health outpatient services <strong>in</strong> jail is limited by those counties not report<strong>in</strong>g mental health outpatient services<br />
<strong>in</strong> jail.<br />
Additionally, the quarterly unduplicated counts of persons receiv<strong>in</strong>g outpatient services have been summed to represent the count of persons<br />
receiv<strong>in</strong>g outpatient services dur<strong>in</strong>g the fiscal year. Unduplicated means that <strong>in</strong>dividuals are counted only once <strong>in</strong> a quarter, regardless of the<br />
number of times or types of outpatient services they receive <strong>in</strong> jail facilities.<br />
2 September 6, 2013
CALIFORNIA DEPARTMENT OF HEALTH CARE SERVICES - MENTAL HEALTH SERVICES DIVISION<br />
SUMMARY OF INVOLUNTARY DETENTIONS<br />
FISCAL YEAR <strong>2011</strong>-<strong>12</strong><br />
72-Hour 72-Hour Additional 180-Day<br />
Number of Admissions to Local Inpatient<br />
Unduplicated Count of<br />
Number of Admissions to an LPS<br />
Evaluation Evaluation 14-Day Post<br />
Services Pursuant to PC 4011.6 or 4011.8,<br />
Persons Receiv<strong>in</strong>g<br />
Approved Inpatient Program Treated<br />
and and 14-Day Intensive 30-Day Certification Temporary Permanent Evaluated and/or Treated <strong>in</strong> a Local Mental<br />
Outpatient Services<br />
With<strong>in</strong> a Jail Facility<br />
Treatment Treatment Intensive Treatment Intensive Intensive Conserva- Conserva-<br />
Health Facility<br />
Provided With<strong>in</strong> a Jail<br />
(Children) (Adults) Treatment (Suicidal) Treatment Treatment torships torships <strong>Involuntary</strong> Voluntary <strong>Involuntary</strong> Voluntary<br />
Facility<br />
STATEWIDE 16,115 109,583 51,948 203 3,461 13 4,191 7,<strong>12</strong>1 851 23 1,694 360 156,003<br />
1<br />
01 ALAMEDA<br />
552 5,433 1,702 2 0 0 554 345 50 0 0 0 7,167<br />
02 ALPINE 0 0 0 0 0 0 0 10 0 0 0 0 0<br />
03 AMADOR 0 0 0 0 0 0 3 32 0 0 0 0 0<br />
04 BUTTE 0 659 204 36 1 0 8 106 8 0 0 0 0<br />
05 CALAVERAS 2, 3 0 0 0 0 0 0 6 4 0 0 0 0 176<br />
06 COLUSA 0 0 0 0 0 0 0 14 0 0 0 0 83<br />
07 CONTRA COSTA 1, 2, 3 0 0 0 0 0 0 90 92 0 0 0 0 0<br />
08 DEL NORTE 2, 3 0 0 0 0 0 0 0 6 0 0 0 0 100<br />
09 EL DORADO 0 315 104 0 13 0 15 188 9 0 0 0 21<br />
10 FRESNO 1, 2, 3 0 2,656 368 0 34 1 0 0 0 0 0 0 0<br />
11 GLENN 0 0 0 0 0 0 1 14 0 0 0 0 5<br />
<strong>12</strong> HUMBOLDT 1 509 187 0 0 0 27 91 0 0 0 0 1,668<br />
13 IMPERIAL 0 0 0 0 0 0 19 64 0 0 0 0 0<br />
14 INYO 0 0 0 0 0 0 5 3 0 0 0 0 19<br />
15 KERN 1,029 3,752 1,036 3 <strong>12</strong> 8 66 97 0 0 0 0 2,009<br />
16 KINGS 0 0 0 0 0 0 10 69 0 0 0 0 0<br />
17 LAKE 2, 3 0 0 0 0 0 0 0 0 0 0 0 0 0<br />
18 LASSEN 0 0 0 0 0 0 3 0 204 0 0 0 452<br />
19 LOS ANGELES 1, 2, 3 5,250 39,895 25,389 0 2,606 0 978 1,763 0 0 154 2 4,908<br />
20 MADERA 0 0 0 0 0 0 10 47 0 0 0 0 1,502<br />
21 MARIN 1, 2, 3 130 1,007 132 0 0 0 48 77 13 0 <strong>12</strong> 0 983<br />
22 MARIPOSA 0 0 0 0 0 0 2 9 0 0 0 0 45<br />
23 MENDOCINO 2, 3 0 0 0 0 0 0 0 0 0 0 0 0 0<br />
24 MERCED 0 387 88 0 10 1 4 0 0 0 0 0 0<br />
25 MODOC 3 0 0 0 0 0 0 2 14 0 0 0 0 32<br />
26 MONO 0 0 0 0 0 0 0 0 0 0 0 0 1<br />
27 MONTEREY 4 870 376 0 0 0 <strong>12</strong> 56 23 0 0 0 0<br />
28 NAPA 0 32 0 0 0 0 14 63 5 0 0 0 930<br />
29 NEVADA 0 0 0 0 0 0 5 13 0 0 0 0 109<br />
30 ORANGE 3 486 7,160 2,895 3 2 0 480 907 0 0 1 25 3,311<br />
31 PLACER 1 0 515 313 5 14 0 10 84 1 1 0 0 0<br />
32 PLUMAS 2 0 0 0 0 0 0 0 0 0 0 0 0 95<br />
33 RIVERSIDE 1, 2, 3 0 0 0 0 0 0 0 0 0 0 0 0 0<br />
34 SACRAMENTO 3,233 9,506 3,745 96 483 0 56 27 0 0 595 0 17,165<br />
35 SAN BENITO 0 0 0 0 0 0 0 3 0 0 0 0 175<br />
36 SAN BERNARDINO 1, 2,3 2,150 6,611 3,227 0 0 0 24 389 5 0 0 0 9,835<br />
37 SAN DIEGO 1 1,798 11,797 2,233 36 86 1 719 1,068 0 0 11 333 15,301<br />
38 SAN FRANCISCO 1 770 5,781 2,819 0 0 0 382 96 396 0 0 0 7,440<br />
39 SAN JOAQUIN 27 861 584 0 57 0 67 40 7 0 0 0 17,729<br />
40 SAN LUIS OBISPO 1, 2,3 0 0 0 0 0 0 0 0 32 0 0 0 1,273<br />
41 SAN MATEO 186 982 602 2 0 0 <strong>12</strong>6 374 3 0 0 0 680<br />
42 SANTA BARBARA 2,3 0 329 215 0 55 0 20 78 0 0 0 0 0<br />
43 SANTA CLARA 1, 2 0 1,989 935 0 0 0 246 419 0 22 921 0 40,114<br />
44 SANTA CRUZ 0 715 443 1 0 0 42 28 2 0 0 0 971<br />
45 SHASTA 2,3 0 0 0 0 0 0 0 0 0 0 0 0 67<br />
46 SIERRA 0 0 0 0 0 0 0 0 0 0 0 0 7<br />
47 SISKIYOU 2,3 0 0 0 0 0 0 0 3 0 0 0 0 0<br />
48 SOLANO 1, 2,3 0 0 0 0 0 0 46 77 21 0 0 0 8,086<br />
49 SONOMA 0 0 0 0 0 0 45 106 0 0 0 0 5,785<br />
50 STANISLAUS 0 3,934 2,062 9 0 0 21 98 <strong>12</strong> 0 0 0 0<br />
52 TEHAMA 0 0 0 0 0 0 4 39 0 0 0 0 358<br />
53 TRINITY 2,3 0 0 0 0 0 0 0 4 0 0 0 0 4<br />
54 TULARE 2,3 0 1,562 1,307 4 77 0 19 89 55 0 0 0 1,824<br />
55 TUOLUMNE 2,3 0 0 0 0 0 0 0 0 0 0 0 0 170<br />
56 VENTURA 1, 2,3 499 2,280 925 4 0 2 0 0 5 0 0 0 3,956<br />
57 YOLO 1, 2,3 0 0 0 0 0 0 0 0 0 0 0 0 1,267<br />
63 SUTTER/YUBA 1, 2,3 0 46 57 2 11 0 2 15 0 0 0 0 180<br />
1 DHCS 1010 (Quarterly Report on <strong>Involuntary</strong> <strong>Detentions</strong>) <strong>in</strong>complete data submitted<br />
2 DHCS 1009 (Quarterly Report of Conservatorship) <strong>in</strong>complete data submitted<br />
3 DHCS 1008 (Quarterly Report on Persons Deta<strong>in</strong>ed <strong>in</strong> Jail Facilities) <strong>in</strong>complete data submitted<br />
September 6, 2013
CALIFORNIA DEPARTMENT OF HEALTH CARE SERVICES - MENTAL HEALTH SERVICES DIVISION<br />
RATES PER 10,000 BY CATEGORY AND COUNTY<br />
FISCAL YEAR <strong>2011</strong>-<strong>12</strong><br />
72-Hour 72-Hour Additional 180-Day<br />
Evaluation Evaluation 14-Day Post<br />
and and 14-Day Intensive 30-Day Certification Temporary Permanent<br />
Treatment Treatment Intensive Treatment Intensive Intensive Conserva- Conserva-<br />
(Children) (Adults) Treatment (Suicidal) Treatment Treatment torships torships<br />
STATEWIDE 17.1 38.7 18.4 0.1 0.9 0.0 1.1 1.9<br />
01 ALAMEDA 1 16.0 45.9 14.4 0.0 0.0 0.0 3.6 2.3<br />
02 ALPINE 0.0 0.0 0.0 0.0 0.0 0.0 0.0 84.1<br />
03 AMADOR 0.0 0.0 0.0 0.0 0.0 0.0 0.8 8.3<br />
04 BUTTE 0.0 37.5 11.6 1.6 0.0 0.0 0.4 4.8<br />
05 CALAVERAS 2 0.0 0.0 0.0 0.0 0.0 0.0 1.3 0.9<br />
06 COLUSA 0.0 0.0 0.0 0.0 0.0 0.0 0.0 6.5<br />
07 CONTRA COSTA 1,2 0.0 0.0 0.0 0.0 0.0 0.0 0.8 0.9<br />
08 DEL NORTE 2 0.0 0.0 0.0 0.0 0.0 0.0 0.0 2.1<br />
09 EL DORADO 0.0 22.3 7.3 0.0 0.7 0.0 0.8 10.3<br />
10 FRESNO 1, 2 0.0 40.2 5.6 0.0 0.4 0.0 0.0 0.0<br />
11 GLENN 0.0 0.0 0.0 0.0 0.0 0.0 0.4 4.9<br />
<strong>12</strong> HUMBOLDT 0.4 46.8 17.2 0.0 0.0 0.0 2.0 6.7<br />
13 IMPERIAL 0.0 0.0 0.0 0.0 0.0 0.0 1.1 3.6<br />
14 INYO 0.0 0.0 0.0 0.0 0.0 0.0 2.7 1.6<br />
15 KERN 40.0 63.3 17.5 0.0 0.1 0.1 0.8 1.1<br />
16 KINGS 0.0 0.0 0.0 0.0 0.0 0.0 0.6 4.5<br />
17 LAKE 2 0.0 0.0 0.0 0.0 0.0 0.0 0.0 0.0<br />
18 LASSEN 0.0 0.0 0.0 0.0 0.0 0.0 0.8 0.0<br />
19 LOS ANGELES 1, 2 21.6 53.2 33.8 0.0 2.6 0.0 1.0 1.8<br />
20 MADERA 0.0 0.0 0.0 0.0 0.0 0.0 0.7 3.1<br />
21 MARIN 1, 2 24.6 49.7 6.5 0.0 0.0 0.0 1.9 3.0<br />
22 MARIPOSA 0.0 0.0 0.0 0.0 0.0 0.0 1.1 4.9<br />
23 MENDOCINO 2 0.0 0.0 0.0 0.0 0.0 0.0 0.0 0.0<br />
24 MERCED 0.0 21.8 5.0 0.0 0.4 0.0 0.2 0.0<br />
25 MODOC 0.0 0.0 0.0 0.0 0.0 0.0 2.0 14.3<br />
26 MONO 0.0 0.0 0.0 0.0 0.0 0.0 0.0 0.0<br />
27 MONTEREY 0.4 28.3 <strong>12</strong>.2 0.0 0.0 0.0 0.3 1.3<br />
28 NAPA 0.0 3.0 0.0 0.0 0.0 0.0 1.0 4.6<br />
29 NEVADA 0.0 0.0 0.0 0.0 0.0 0.0 0.5 1.3<br />
30 ORANGE 6.5 31.1 <strong>12</strong>.6 0.0 0.0 0.0 1.6 3.0<br />
31 PLACER 1 0.0 19.3 11.7 0.1 0.4 0.0 0.3 2.4<br />
32 PLUMAS 2 0.0 0.0 0.0 0.0 0.0 0.0 0.0 0.0<br />
33 RIVERSIDE 1,2 0.0 0.0 0.0 0.0 0.0 0.0 0.0 0.0<br />
34 SACRAMENTO 88.0 89.0 35.1 0.7 3.4 0.0 0.4 0.2<br />
35 SAN BENITO 0.0 0.0 0.0 0.0 0.0 0.0 0.0 0.5<br />
36 SAN BERNARDINO 1,2 35.7 45.3 22.1 0.0 0.0 0.0 0.1 1.9<br />
37 SAN DIEGO 1 24.5 49.2 9.3 0.1 0.3 0.0 2.3 3.4<br />
38 SAN FRANCISCO 1 70.8 81.9 39.9 0.0 0.0 0.0 4.7 1.2<br />
39 SAN JOAQUIN 1.3 17.6 11.9 0.0 0.8 0.0 1.0 0.6<br />
40 SAN LUIS OBISPO 1,2 0.0 0.0 0.0 0.0 0.0 0.0 0.0 0.0<br />
41 SAN MATEO 11.5 17.4 10.6 0.0 0.0 0.0 1.7 5.1<br />
42 SANTA BARBARA 2 0.0 10.0 6.5 0.0 1.3 0.0 0.5 1.8<br />
43 SANTA CLARA 1,2 0.0 14.5 6.8 0.0 0.0 0.0 1.4 2.3<br />
44 SANTA CRUZ 0.0 34.1 21.2 0.0 0.0 0.0 1.6 1.1<br />
45 SHASTA 2 0.0 0.0 0.0 0.0 0.0 0.0 0.0 0.0<br />
46 SIERRA 0.0 0.0 0.0 0.0 0.0 0.0 0.0 0.0<br />
47 SISKIYOU 2 0.0 0.0 0.0 0.0 0.0 0.0 0.0 0.7<br />
48 SOLANO 1,2 0.0 0.0 0.0 0.0 0.0 0.0 1.1 1.8<br />
49 SONOMA 0.0 0.0 0.0 0.0 0.0 0.0 0.9 2.2<br />
50 STANISLAUS 0.0 105.8 55.5 0.2 0.0 0.0 0.4 1.9<br />
52 TEHAMA 0.0 0.0 0.0 0.0 0.0 0.0 0.6 6.1<br />
53 TRINITY 2 0.0 0.0 0.0 0.0 0.0 0.0 0.0 2.9<br />
54 TULARE 2 0.0 51.8 43.3 0.1 1.7 0.0 0.4 2.0<br />
55 TUOLUMNE 2 0.0 0.0 0.0 0.0 0.0 0.0 0.0 0.0<br />
56 VENTURA 1,2 23.3 36.9 15.0 0.0 0.0 0.0 0.0 0.0<br />
57 YOLO 1,2 0.0 0.0 0.0 0.0 0.0 0.0 0.0 0.0<br />
63 SUTTER/YUBA 1,2 0.0 3.8 4.7 0.1 0.7 0.0 0.1 0.9<br />
1 DHCS 1010 (Quarterly Report on <strong>Involuntary</strong> <strong>Detentions</strong>) <strong>in</strong>complete data submitted<br />
2 DHCS 1009 (Quarterly Report of Conservatorship) <strong>in</strong>complete data submitted<br />
September 6, 2013