development and verification of a material model for prediction of ...
development and verification of a material model for prediction of ...
development and verification of a material model for prediction of ...

Create successful ePaper yourself
Turn your PDF publications into a flip-book with our unique Google optimized e-Paper software.
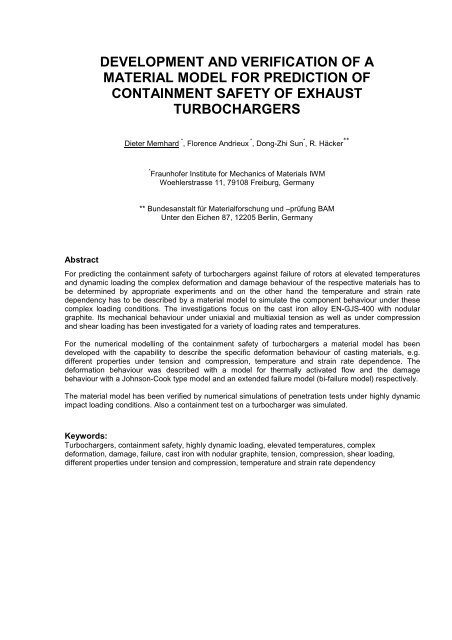
DEVELOPMENT AND VERIFICATION OF A<br />
MATERIAL MODEL FOR PREDICTION OF<br />
CONTAINMENT SAFETY OF EXHAUST<br />
TURBOCHARGERS<br />
Dieter Memhard * , Florence Andrieux * , Dong-Zhi Sun * , R. Häcker **<br />
* Fraunh<strong>of</strong>er Institute <strong>for</strong> Mechanics <strong>of</strong> Materials IWM<br />
Woehlerstrasse 11, 79108 Freiburg, Germany<br />
** Bundesanstalt für Material<strong>for</strong>schung und –prüfung BAM<br />
Unter den Eichen 87, 12205 Berlin, Germany<br />
Abstract<br />
For predicting the containment safety <strong>of</strong> turbochargers against failure <strong>of</strong> rotors at elevated temperatures<br />
<strong>and</strong> dynamic loading the complex de<strong>for</strong>mation <strong>and</strong> damage behaviour <strong>of</strong> the respective <strong>material</strong>s has to<br />
be determined by appropriate experiments <strong>and</strong> on the other h<strong>and</strong> the temperature <strong>and</strong> strain rate<br />
dependency has to be described by a <strong>material</strong> <strong>model</strong> to simulate the component behaviour under these<br />
complex loading conditions. The investigations focus on the cast iron alloy EN-GJS-400 with nodular<br />
graphite. Its mechanical behaviour under uniaxial <strong>and</strong> multiaxial tension as well as under compression<br />
<strong>and</strong> shear loading has been investigated <strong>for</strong> a variety <strong>of</strong> loading rates <strong>and</strong> temperatures.<br />
For the numerical <strong>model</strong>ling <strong>of</strong> the containment safety <strong>of</strong> turbochargers a <strong>material</strong> <strong>model</strong> has been<br />
developed with the capability to describe the specific de<strong>for</strong>mation behaviour <strong>of</strong> casting <strong>material</strong>s, e.g.<br />
different properties under tension <strong>and</strong> compression, temperature <strong>and</strong> strain rate dependence. The<br />
de<strong>for</strong>mation behaviour was described with a <strong>model</strong> <strong>for</strong> thermally activated flow <strong>and</strong> the damage<br />
behaviour with a Johnson-Cook type <strong>model</strong> <strong>and</strong> an extended failure <strong>model</strong> (bi-failure <strong>model</strong>) respectively.<br />
The <strong>material</strong> <strong>model</strong> has been verified by numerical simulations <strong>of</strong> penetration tests under highly dynamic<br />
impact loading conditions. Also a containment test on a turbocharger was simulated.<br />
Keywords:<br />
Turbochargers, containment safety, highly dynamic loading, elevated temperatures, complex<br />
de<strong>for</strong>mation, damage, failure, cast iron with nodular graphite, tension, compression, shear loading,<br />
different properties under tension <strong>and</strong> compression, temperature <strong>and</strong> strain rate dependency
8 th European LS-DYNA Users Conference, Strasbourg - May 2011<br />
Introduction<br />
For modern diesel engines more <strong>and</strong> more bigger <strong>and</strong> faster spinning turbochargers are employed to<br />
enhance the power <strong>of</strong> the engines. As a consequence, the higher rotational energies <strong>of</strong> the turbine<br />
wheel <strong>and</strong> the compressor wheel respectively must be absorbed by the containment in case <strong>of</strong><br />
bursting <strong>of</strong> the spinning wheels.<br />
To prove the safety <strong>of</strong> the turbochargers containment tests are carried out at specific testing facilities.<br />
These tests are highly expensive <strong>and</strong> deliver only in<strong>for</strong>mation <strong>for</strong> the specific turbocharger <strong>and</strong> testing<br />
condition. Thus, there is dem<strong>and</strong> <strong>for</strong> appropriate numerical tools to reduce the <strong>development</strong> costs <strong>for</strong><br />
turbochargers. There<strong>for</strong>e the manufacturers are interested in <strong>material</strong> <strong>model</strong>s to describe the<br />
de<strong>for</strong>mation <strong>and</strong> failure behaviour <strong>of</strong> the containment under their specific loading conditions.<br />
For the numerical <strong>model</strong>ling <strong>of</strong> the containment safety <strong>of</strong> turbochargers a <strong>material</strong> <strong>model</strong> has been<br />
developed with the capability to describe the specific de<strong>for</strong>mation behaviour <strong>of</strong> casting <strong>material</strong>s, e.g.<br />
different properties under tension <strong>and</strong> compression as a function <strong>of</strong> stress triaxiality, temperature <strong>and</strong><br />
strain rate dependence under large plastic de<strong>for</strong>mations. The parameters <strong>for</strong> <strong>model</strong>ling the <strong>material</strong><br />
behaviour <strong>of</strong> the cast iron alloy EN-GJS-400 have been determined <strong>for</strong> a variety <strong>of</strong> small scale<br />
specimen geometries with different triaxialities <strong>for</strong> a variety <strong>of</strong> strain rates <strong>and</strong> temperatures und then<br />
the <strong>model</strong> has been validated by tests under impact loading <strong>and</strong> a burst test respectively. The<br />
<strong>material</strong> <strong>model</strong> has been implemented as User <strong>material</strong> subroutine in the finite element code LS-<br />
DYNA<br />
1. Characterization <strong>of</strong> the <strong>material</strong> behaviour<br />
The cast iron alloy EN-GJS-400 with nodular graphite was in the focus <strong>of</strong> the investigations. A variety<br />
<strong>of</strong> tests on different specimens under compression, uniaxial <strong>and</strong> multiaxial tension as well as shear<br />
loading have been per<strong>for</strong>med to characterize the de<strong>for</strong>mation <strong>and</strong> failure behaviour.<br />
1.1. Material characterization<br />
The casting <strong>material</strong> was delivered in plates with a thickness <strong>of</strong> 25 mm. The microstructural<br />
investigations <strong>of</strong> the alloy EN-GJS-400 show a ferritic matrix with nodular graphite <strong>and</strong> small fractions<br />
<strong>of</strong> pearlite.<br />
1.2. Tension tests on smooth round bars<br />
In Figure 1Figure 1Figure 1 the yield strength R p0,2 , the tensile strength R m <strong>and</strong> the flow curves are<br />
illustrated as a function <strong>of</strong> strain rate from 0,0006 1/s (quasi static) up to 500 1/s <strong>for</strong> 23 °C.<br />
strength [MPa]<br />
600<br />
500<br />
400<br />
300<br />
200<br />
EN-GJS-400<br />
qs - 500 1/s, 23 °C<br />
small symbols: single values<br />
large symbols: average values<br />
true stress [MPa]<br />
800<br />
600<br />
400<br />
EN-GJS-400<br />
quasistatic to 500 1/s; 23 °C<br />
250 1/s<br />
500 1/s<br />
strain rate<br />
90 1/s<br />
4 1/s<br />
0,02 1/s<br />
qs<br />
100<br />
tensile strength Rm<br />
yield strength Rp02<br />
200<br />
0<br />
0,0001 0,01 1 100 10000<br />
strain rate [1/s]<br />
a) b)<br />
0<br />
0 0,05 0,1 0,15 0,2<br />
true strain<br />
Figure 1: Casting <strong>material</strong> EN-GJS-400, a) strength values <strong>and</strong> b) flow curves as a function <strong>of</strong> strain<br />
rate from 0,0006 1/s to 500 1/s, 23 °C [1]
8 th European LS-DYNA Users Conference, Strasbourg - May 2011<br />
For high strain rates, e.g. 250 1/s, that are rather representative <strong>for</strong> the impact loading <strong>of</strong> the<br />
containment, strength values are decreasing with increasing temperature (Figure 2Figure 2Figure 2).<br />
600<br />
500<br />
EN-GJS-400<br />
strain rate 250 1/s, 23…400°C<br />
800<br />
600<br />
EN-GJS-400<br />
strain rate 250 1/s; 100…400 °C<br />
strength [MPa]<br />
400<br />
300<br />
200<br />
100<br />
small symbols: single values<br />
large symbols: average values<br />
tensile strength Rm<br />
yield strength Rp0.2<br />
0<br />
0 100 200 300 400 500<br />
temperature [°C]<br />
a) b)<br />
true stress [MPa]<br />
400<br />
200<br />
0<br />
116-06; 23°C<br />
117-32; 100 °C<br />
120-28; 100 °C<br />
120-03; 200 °C<br />
120-13; 200 °C<br />
120-33; 200 °C<br />
117-16; 300 °C<br />
120-01; 300 °C<br />
120-22; 300 °C<br />
117-27; 400 °C<br />
120-10; 400 °C<br />
120-12; 400 °C<br />
0,00 0,05 0,10 0,15 0,20<br />
true strain<br />
Figure 2: Casting <strong>material</strong> EN-GJS-400, a) strength <strong>and</strong> fracture strain values <strong>and</strong> b) flow curves as a<br />
function <strong>of</strong> temperature between 23 °C <strong>and</strong> 400 °C, s train rate 250 1/s [1]<br />
1.3. Compression tests on cylindrical specimens<br />
Compression tests on cylindrical specimens have been per<strong>for</strong>med in the temperature range between<br />
23 °C <strong>and</strong> 400 °C under quasi static conditions. Figure 3Figure 3Figure 3a shows the flow curves<br />
from tests at 23 °C, making clear that there were s ome surface cracks but no total failure <strong>of</strong> the entire<br />
specimen. For the failure curve the conservative assumption was made, that failure would occur as a<br />
consequence <strong>of</strong> these surface cracks.<br />
1.4. Tension tests on notched specimens<br />
Tests on notched tension specimens were carried out to deliver fracture strain values at higher<br />
triaxialities. As an example the curves in Figure 3Figure 3Figure 3b show a decrease <strong>of</strong> specimen<br />
elongation with decreasing notch radius (R3 → R1) in comparison with the unnotched specimen.<br />
20<br />
15<br />
EN-GJS-400<br />
23 C; v = 0,025 mm/s<br />
Durchmesser 6 mm<br />
R=1mm<br />
R=3mm<br />
load Kraft [kN] in kN<br />
10<br />
unnotched ungekerbt<br />
5<br />
a)<br />
0<br />
0 1 2 3<br />
Probenverlängerung elongation [mm] in mm<br />
Figure 3: Casting <strong>material</strong> EN-GJS-400,<br />
a) flow curves from compression tests at 23 °C unde r quasi static conditions<br />
b) load-displacement records from tension tests on notched round bars [1]<br />
b)
8 th European LS-DYNA Users Conference, Strasbourg - May 2011<br />
1.5. Torsion tests on notched round bars<br />
Since shear tension tests on notched tension bars failed to achieve shear dominated failure, torsion<br />
load was imposed on a notched round bar, relying on a proposal from Barsoum und Faleskog [2],<br />
who investigated notched pipes under torsion loading. Results are shown in chapter 4.1.1.<br />
2. Analysis <strong>of</strong> the de<strong>for</strong>mation <strong>and</strong> failure behaviour <strong>of</strong> the cast iron <strong>material</strong> <strong>and</strong><br />
the consequences <strong>for</strong> numerical <strong>model</strong>ling<br />
The microstructure <strong>of</strong> the cast iron <strong>material</strong> is characterized by a ferritic matrix with embedded<br />
nodular graphite particles that have an impact on the de<strong>for</strong>mation <strong>and</strong> failure behaviour <strong>of</strong> the<br />
respective <strong>material</strong>. Figure 4Figure 4Figure 4 shows the final stage <strong>of</strong> <strong>material</strong> behaviour in the<br />
tension (a) <strong>and</strong> the compression (2) test.<br />
a) b)<br />
Figure 4: De<strong>for</strong>mation <strong>of</strong> the nodular graphite under tension <strong>and</strong> compression loading<br />
a) void decohesion from the base metal <strong>and</strong> void growth under tension [3],<br />
b) large de<strong>for</strong>mation <strong>of</strong> the graphite particles under compression without decohesion<br />
This cast iron behaves like a porous <strong>material</strong> under tension load whereas under compression it is<br />
almost incompressible.<br />
3. Development <strong>of</strong> a <strong>material</strong> <strong>model</strong> <strong>for</strong> de<strong>for</strong>mation <strong>and</strong> failure <strong>of</strong> cast iron with<br />
strain rate <strong>and</strong> temperature dependence<br />
The constitutive <strong>model</strong> described below is intended <strong>for</strong> <strong>model</strong>ling the elastic-plastic behaviour <strong>of</strong> cast<br />
iron characterized by following macroscopic properties:<br />
- different yield strengths in tension <strong>and</strong> compression with the yield stress under compression<br />
being then the yield stress under tension,<br />
- different hardening behaviour under tension <strong>and</strong> compression (Figure 5Figure 5Figure 5a),<br />
- inelastic volume change in tension (dilatation) but no inelastic volume change in compression,<br />
- decreasing ductility with increasing triaxiality, but at zero mean stress (obtained from a shear<br />
test) the fracture strain can be below the one obtained at significantly higher mean stress,<br />
- strain-rate <strong>and</strong> temperature dependence <strong>of</strong> yield strength <strong>and</strong> failure strain,<br />
- temperature dependent elastic modulus.
8 th European LS-DYNA Users Conference, Strasbourg - May 2011<br />
1000<br />
800<br />
1.5<br />
uniaxial<br />
compression<br />
uniaxial<br />
tension<br />
true stress [MPa]<br />
600<br />
400<br />
extrapolation<br />
fracture<br />
200<br />
compression<br />
tension<br />
0<br />
0,00 0,25 0,50 0,75 1,00<br />
true plastic strain<br />
a) b)<br />
σe/σc<br />
1<br />
0.5<br />
initial yield<br />
0<br />
-1 -0.5 0 0.5 1<br />
σ m /σ c<br />
current yield<br />
Figure 5: a) Flow behaviour <strong>of</strong> the cast iron <strong>material</strong> EN-GJS-400 under uniaxial stress <strong>and</strong><br />
compression load<br />
b) Normalized yield surface <strong>of</strong> the cast iron <strong>material</strong> in the (σ e , σ m )-space at the beginning<br />
<strong>of</strong> yielding <strong>and</strong> after strain hardening<br />
The asymmetric yield function Φ in the (σ e , σ m )-space is a half-ellipse in the region from the uniaxial<br />
compression to hydrostatic tension <strong>and</strong> the Mises straight line in the region to the hydrostatic<br />
compression to the uniaxial compression (Figure 5Figure 5Figure 5b). σ m denotes the mean stress<br />
<strong>and</strong> σ e the von Mises stress. The triaxiality is defined as T=σ m /σ e.<br />
Φ = σ~<br />
− σ c<br />
≤<br />
with<br />
e<br />
3<br />
2<br />
0<br />
'<br />
ij<br />
'<br />
ij<br />
~<br />
σ<br />
2<br />
⎪⎧<br />
σ<br />
= ⎨<br />
⎪⎩ σ<br />
2<br />
e<br />
2<br />
c<br />
+ α<br />
2<br />
1<br />
( σ + σ )<br />
1<br />
σ = σ σ , σ<br />
m<br />
= σkk<br />
;T =σ m /σ e<br />
3<br />
m<br />
3<br />
c<br />
2<br />
T ≥ -<br />
T < -<br />
1<br />
3<br />
1<br />
3<br />
(1)<br />
In (1) α is the parameter governing the shape <strong>of</strong> the half-ellipse centred at -σ c /3. The asymmetry in the<br />
yield shape with respect to the mean stress accounts <strong>for</strong> different yield strength under uniaxial<br />
compression σ c <strong>and</strong> uniaxial tension σ t . The shape <strong>of</strong> the yield surface α is deduced from the initial<br />
yield stresses in compression <strong>and</strong> tension, σ c 0 <strong>and</strong> σ t 0 .<br />
To describe the fracture behaviour a Johnson-Cook type fracture criterion was incorporated into the<br />
<strong>model</strong>, it means the strain at failure ε f is given as a function <strong>of</strong> the stress triaxiality T=σ m /σ e , the<br />
equivalent plastic strain rate <strong>and</strong> the temperature. For the description <strong>of</strong> the failure behaviour three<br />
different types <strong>of</strong> failure curve have been investigated und are shown in Figure 6Figure 6Figure 6:<br />
a) Fracture strain independent <strong>of</strong> triaxiality T (ε F = const.), data from tension tests on smooth round<br />
bars,<br />
b) Fracture strain deceases monotonically with triaxiality T (Johnson-Cook), data from tests on<br />
specimens with different triaxiality (e.g. compression, uniaxial <strong>and</strong> multiaxial tension),<br />
c) Fracture strain with two regions <strong>of</strong> different failure mechanisms (T < T trans <strong>and</strong> T > T trans ) as well as<br />
a minimum <strong>for</strong> pure shear (bi-failure) [5, 6], data from tests on specimens with different triaxiality<br />
values (e.g. compression, shear as well as uniaxial <strong>and</strong> multiaxial tension).<br />
Fracture occurs when the cumulative damage parameter D defined by (2) reaches the critical value <strong>of</strong> 1.<br />
Johnson-Cook proposed a linear damage accumulation. In this <strong>for</strong>mulation a more general non linear<br />
damage accumulation is used:<br />
& n 1−<br />
1<br />
D = D n ε& p<br />
ε<br />
(2)<br />
f<br />
In (2) ε p denotes the equivalent plastic strain <strong>and</strong> the exponent n is a parameter.
8 th European LS-DYNA Users Conference, Strasbourg - May 2011<br />
The use <strong>of</strong> two distinct functions <strong>for</strong> failure strain is justified by the fact that different mechanisms lead<br />
to failure at low <strong>and</strong> high triaxialities. At high triaxialities failure is due to void growth <strong>and</strong> coalescence.<br />
The failure curve proposed by Johnson-Cook [4] <strong>for</strong> instance is relevant in this region. At low<br />
triaxialities shear failure is observed <strong>of</strong>ten at low failure strains.<br />
Johnson-Cook: ε F = f(T)<br />
failure strain εF<br />
bi-f ailure: ε F = f(T)<br />
T trans<br />
Johnson-Cook: ε F = const<br />
-0,5 0 0,5 1 1,5<br />
stress triaxiality T<br />
Figure 6: Schematic drawing <strong>for</strong> different types <strong>of</strong> failure curves with fracture strain as a function <strong>of</strong><br />
triaxiality T = σ m /σ e<br />
4. Finite element calculations <strong>of</strong> tests on small scale specimens <strong>for</strong> the<br />
determination <strong>of</strong> <strong>model</strong> parameters<br />
4.1. Quasi-static und dynamic tension tests on smooth round bars<br />
By numerical simulation <strong>of</strong> tension tests on smooth round bars at temperatures from 23 °C to 400 °C<br />
under quasi-static <strong>and</strong> dynamic loading up to strain rates <strong>of</strong> 500 s -1 the parameters <strong>for</strong> the temperature<br />
<strong>and</strong> strain rate dependence <strong>of</strong> the flow behaviour have been determined. Under tension loading a<br />
plastic Poisson’s ratio <strong>of</strong> ν pl = 0.4 <strong>material</strong>ises in the wake <strong>of</strong> plastic de<strong>for</strong>mation giving evidence that<br />
the <strong>material</strong> is plastically compressible under tension loading.<br />
nominal stress [MPa]<br />
500<br />
400<br />
300<br />
200<br />
100<br />
Exp. 10205<br />
Simulation<br />
specimen dimensions<br />
ø = 6 mm, L 0 = 25 mm<br />
0<br />
0,00 0,05 0,10 0,15 0,20 0,25 0,30<br />
nominal strain<br />
Exp. 10103<br />
0<br />
0 0,1 0,2 0,3 0,4 0,5<br />
a)<br />
b)<br />
Figure 7: a) Upper <strong>and</strong> lower bound <strong>of</strong> engineering stress strain curves <strong>of</strong> the casting <strong>material</strong><br />
EN-GJS-400 under quasi static loading <strong>and</strong> simulation <strong>of</strong> the lower bound test<br />
b) Calibration <strong>of</strong> the strain-rate dependency <strong>for</strong> quasi static loading up to 500 s -1<br />
true stress [MPa]<br />
1000<br />
800<br />
600<br />
400<br />
200<br />
Johnson-Cook<br />
strain rate<br />
Exp. 0.005/s<br />
Exp. 500/s<br />
Macherauch-Vöhringer<br />
true plastic strain
8 th European LS-DYNA Users Conference, Strasbourg - May 2011<br />
Figure 7Figure 7Figure 7a shows the global response <strong>of</strong> the smooth tension bars under quasi static<br />
loading from experiment <strong>and</strong> numercal calculation. Two different <strong>model</strong>s to describe the temperature<br />
<strong>and</strong> strain rate dependence <strong>of</strong> plastic flow <strong>and</strong> hardening have been investigated. Unlike the Johnson-<br />
Cook equation (4), the proposal from Macherauch <strong>and</strong> Vöhringer [7] proved to be a better approach<br />
<strong>for</strong> the flow behaviour <strong>of</strong> bcc metals. It relies on the micro mechanisms <strong>of</strong> thermally activated flow that<br />
proved to be a good approach <strong>for</strong> most ferritic steels. It separates the flow stress in a thermally<br />
activated part σ a<br />
*<br />
<strong>and</strong> a thermally inactive part σ i (Eq. 3).<br />
temperature <strong>and</strong><br />
strain rate<br />
dependence <strong>of</strong><br />
flow stress after<br />
Macherauch-<br />
Vöhringer [7]<br />
*<br />
σ = σ + σ<br />
C<br />
i<br />
mel<br />
a<br />
⎡<br />
* m<br />
⎡ kT & ε ⎤<br />
a<br />
= Σc(<br />
ε<br />
C<br />
) ( 1−T<br />
) + σ<br />
a<br />
⎢1<br />
− ⎢ ln ⎥<br />
⎢ G<br />
c<br />
⎣ ⎣∆<br />
&<br />
0<br />
ε ⎦<br />
<strong>and</strong><br />
*<br />
T −Tref<br />
T =<br />
<strong>for</strong> T ref
8 th European LS-DYNA Users Conference, Strasbourg - May 2011<br />
4.2. Determination <strong>of</strong> the failure curve from numerical analyses <strong>of</strong> the experiments<br />
Figure 9Figure 9Figure 9 shows the different types <strong>of</strong> failure curves determined from the available<br />
experiments. A statistically relevant set <strong>of</strong> <strong>material</strong> does only exist <strong>for</strong> the smooth tension bars.<br />
1,5<br />
fa ilure strain εF<br />
1,2<br />
0,9<br />
0,6<br />
0,3<br />
c ra c k initia tion<br />
T tra ns<br />
Johnson Cook, epl = c onst.<br />
Johnson Cook ep l = f(T)<br />
b i-fa ilure (T < T trans)<br />
b i-fa ilure (T > T trans)<br />
transition<br />
smooth tension ba r<br />
notc hed tension, R = 3mm<br />
notc hed tension, R = 1mm<br />
notc hed tension, R = 0.25mm<br />
c omp ression spec imen<br />
notc hed torsion, R = 1mm<br />
0<br />
-0,5 0 0,5 1 1,5<br />
stress tria xiality T<br />
Figure 9: Failure curve options <strong>of</strong> the cast iron <strong>material</strong> EN-GJS-400 <strong>for</strong> numerical calculation <strong>of</strong><br />
structures under complex loading; experimental data <strong>and</strong> approximated failure curve<br />
4.3. Regularization<br />
As the failure parameters are mesh size dependent <strong>and</strong> were determined above all on notched<br />
specimens, that necessarily had a fine mesh <strong>for</strong> accurate mapping <strong>of</strong> the notch geometry, a<br />
regularization <strong>of</strong> the failure strain has been per<strong>for</strong>med <strong>for</strong> component simulations. A calibration<br />
function has been compiled <strong>for</strong> element sizes from 0.1 up to 16 mm by simulating the tests on flat<br />
tensile bars with the different element sizes.<br />
5. Finite element simulations <strong>of</strong> experiments on bending specimens <strong>and</strong> assembly like<br />
structures <strong>for</strong> the validation <strong>of</strong> the <strong>material</strong> <strong>model</strong><br />
5.1. Notched bending specimens<br />
As a first attempt <strong>for</strong> validation <strong>of</strong> the <strong>model</strong> quasi static experiments on notched bending specimens<br />
(Figure 10Figure 10Figure 10a) have been chosen. Figure 10Figure 10Figure 10b illustrates that the<br />
Johnson-Cook-failure curve (JC=f(T)) delivers a good approach <strong>for</strong> the global response <strong>of</strong> the<br />
specimen. A comparable result is achieved <strong>for</strong>t the bi-failure-curve since failure is starting from the<br />
notch root, a high triaxiality region. The assumption <strong>of</strong> a constant failure strain (JC = const.) however,<br />
leads to an overestimation <strong>of</strong> the load bearing capacity <strong>of</strong> the specimen due to the neglect <strong>of</strong> the<br />
difference in fracture strain between tension <strong>and</strong> compression<br />
5.2. Dynamic impact loading <strong>of</strong> plates<br />
The containment safety <strong>of</strong> a turbocharger under the impact <strong>of</strong> fragments from a bursting rotor wheel<br />
was approached by an impact test with a high speed projectile hitting a plate. Figure 11Figure<br />
11Figure 11 shows the back side <strong>of</strong> the plate that was penetrated by a cylindrical target with an initial<br />
velocity <strong>of</strong> 499 m/s [1] <strong>and</strong> the corresponding finite element <strong>model</strong>.<br />
Calculations with all the three failure curves yielded failure velocities close to 500 m/s. The bi-failure<br />
<strong>model</strong> however yielded the best agreement with the impact tests, <strong>for</strong> the penetration velocity as well<br />
as <strong>for</strong> the appearance <strong>of</strong> the damage
8 th European LS-DYNA Users Conference, Strasbourg - May 2011<br />
10<br />
8<br />
EN-GJS-400<br />
quasi static, 23 °C<br />
load [kN]<br />
6<br />
4<br />
2<br />
Exp. 107-24<br />
Exp. 107-27<br />
Exp. 107-21<br />
Sim. JC=f(T)<br />
Sim. JC=const.<br />
a) b)<br />
0<br />
0 1 2 3<br />
deflection [mm]<br />
Figure 10: Numerical <strong>model</strong> <strong>of</strong> a notched bending specimen (a) <strong>and</strong> load-deflection curves (b) <strong>of</strong> the<br />
EN-GJS-400 <strong>material</strong> from experiments <strong>and</strong> numerical simulations<br />
a)<br />
projectile<br />
b)<br />
Figure 11: Damage <strong>of</strong> the plate after penetration <strong>of</strong> the projectile in the experiment (a) <strong>and</strong> the<br />
numerical simulation with the bi-failure-<strong>model</strong> (b)<br />
Figure 12Figure 12Figure 12 illustrates the various phases <strong>of</strong> damage in the wake <strong>of</strong> the clash <strong>of</strong> the<br />
projectile on the plate <strong>and</strong> the following penetration <strong>of</strong> the plate. Damage <strong>and</strong> failure are initiated by<br />
the compression wave that is reflected <strong>and</strong> converted into a tension wave at the lower surface <strong>of</strong> the<br />
plate (1). As there is approximately biaxial loading in the contact zone with triaxialities > 0.5 failure in<br />
this region is triggered at low fracture strains (2). This failure zone spreads out over the whole<br />
thickness <strong>of</strong> the plate up to the lower surface <strong>of</strong> the projectile (3)-(4). The final phase <strong>of</strong> failure is<br />
dominated by the penetration <strong>of</strong> the projectile by shearing (5)-(6).<br />
5.3. Simulation <strong>of</strong> a containment test <strong>of</strong> a fast spinning rotor<br />
As an industrial application <strong>of</strong> the experimental <strong>and</strong> numerical investigations the simulation <strong>of</strong> a<br />
containment test [[[8] was carried out. For preparation <strong>of</strong> the test sample three notches were cut into<br />
the compressor wheel spaced 120 degrees apart. The compressor wheel would then burst during<br />
operation at the weakened sections due to high local stresses caused by the centrifugal <strong>for</strong>ces.<br />
Figure 13<br />
Figure 13<br />
Figure 13 shows the results <strong>for</strong> the insert piece. Cracks can be observed in regions <strong>of</strong> plastic strains<br />
greater than 35-40%.
8 th European LS-DYNA Users Conference, Strasbourg - May 2011<br />
~ 500 m/s<br />
1) Impact <strong>of</strong> the projectile on<br />
the plate<br />
2) Spalling <strong>of</strong> fragments on the<br />
lower side <strong>of</strong> the plate<br />
3) Extension <strong>of</strong> the damaged<br />
zone over the plate thickness<br />
4) Extension <strong>of</strong> the damaged<br />
zone in the plane<br />
5) Intrusion <strong>of</strong> the projectile by shearing<br />
<strong>of</strong> the brink <strong>of</strong> the damaged zone<br />
6) Penetration <strong>of</strong> the projectile<br />
through the plate<br />
Figure 12: EN-GJS-400, penetration test, ~500 m/s, 23 °C, phases <strong>of</strong> damage <strong>and</strong> failure in the<br />
contact zone; simulation with the Johnson-Cook-<strong>model</strong>, JC=f(T)<br />
Figure 13: Insert piece <strong>of</strong> the compressor housing <strong>of</strong> cast iron EN-GJS-400 after the impact <strong>of</strong> the<br />
rotor segment, left the damage appearance (a) <strong>and</strong> right the corresponding numerical<br />
<strong>model</strong> with a plastic strain plot (b)
8 th European LS-DYNA Users Conference, Strasbourg - May 2011<br />
6. Summary<br />
In this research project the ductile cast iron alloy EN-GJS-400 with nodular graphite was investigated.<br />
Its mechanical behaviour under uniaxial <strong>and</strong> multiaxial tension as well as under compression <strong>and</strong><br />
shear loading has been examined <strong>for</strong> a variety <strong>of</strong> loading rates <strong>and</strong> temperatures. Since the<br />
investigations only concerned the containment but not the rotor <strong>of</strong> the turbocharger the loading <strong>of</strong> the<br />
whole device was approached by the impact <strong>of</strong> a plate by a projectile made <strong>of</strong> the same <strong>material</strong>.<br />
A new <strong>material</strong> <strong>model</strong> was developed to <strong>model</strong> the special de<strong>for</strong>mation <strong>and</strong> fracture behaviour <strong>of</strong><br />
ductile cast iron alloys. The <strong>material</strong> parameters <strong>for</strong> the <strong>model</strong> have been determined by numerical<br />
<strong>model</strong>ling <strong>of</strong> small scale tests under different loading conditions. The <strong>material</strong> <strong>model</strong> has first been<br />
applied to numerical simulations <strong>of</strong> tests on notched specimens under bending load, then to the<br />
simulation <strong>of</strong> penetration tests under highly dynamic impact loading conditions <strong>and</strong> last to the<br />
containment test <strong>of</strong> a turbocharger. The loading conditions in the dynamic tests are comparable to the<br />
impact <strong>of</strong> a broken turbine blade on the containment <strong>of</strong> a turbocharger. The main purpose <strong>of</strong> these<br />
tests hence was to prove the <strong>prediction</strong> capability <strong>of</strong> the <strong>material</strong> <strong>model</strong>.<br />
The calculated results agreed quite well with the experimental data. The <strong>model</strong> has been implemented<br />
in a commercial finite element code with explicit integration. In the actual version <strong>of</strong> the user<br />
subroutine the application is limited to solid elements.<br />
7. Literatur<br />
[1] R. Häcker, E. Knothe, P. Wossidlo: Experimentelle Untersuchungen für die Anwendung von<br />
Material<strong>model</strong>len zur numerische Auslegung des Containments von Abgasturboladern,<br />
Proceedings der Tagung Werkst<strong>of</strong>fprüfung, Dezember 2010 in Neu-Ulm, Hrsg. M. Pohl, S.<br />
317-322.<br />
[2] J. Barsoum, J. Faleskog, Rupture mechanisms in combined tension <strong>and</strong> shear--Experiments,<br />
International Journal <strong>of</strong> Solids <strong>and</strong> Structures, 44, 2007, 5481-5498.<br />
[3] Dong, M.J., Prioul, C., François, D., Metallurgical <strong>and</strong> Material Transactions A 28A, 2245-<br />
2254, 1997.<br />
[4] G.R. Johnson <strong>and</strong> W.H. Cook, Fracture characteristics <strong>of</strong> three metals subjected to various<br />
strains, strain rates, temperatures <strong>and</strong> pressures, Engineering Fracture Mechanics, 21, No.1,<br />
(1985) 31-48.<br />
[5] Wierzbickie, T., Bao, Y., Lee, Y.-W., Bai, Y., Calibration <strong>and</strong> evaluation <strong>of</strong> seven fracture<br />
<strong>model</strong>s, Int. Journal <strong>of</strong> Mechanical Sciences, 47 (2005), 719-743.<br />
[6] F. Andrieux, D.-Z. Sun, Damage <strong>model</strong>ling <strong>for</strong> simulation <strong>of</strong> process chain from <strong>for</strong>ming to<br />
crash, Int. J. Mat. Res. 2010, 101, 8.<br />
[7] E. Macherauch, O. Vöhringer, Das Verhalten metallischer Werkst<strong>of</strong>fe unter mechanischer<br />
Beanspruchung, Z. für Werkst<strong>of</strong>ftechnik, 9, 1978, 370-391.<br />
[8] T. Winter, A. Huß, H. Beck, Simulation <strong>of</strong> Containment-Tests <strong>of</strong> fast-spinning rotors by explicit<br />
FEM, 22 nd CAD-FEM Users’ Meeting, Nov. 2004.