Student Perceptions of Teaching Effectiveness - Harvard Graduate ...
Student Perceptions of Teaching Effectiveness - Harvard Graduate ...
Student Perceptions of Teaching Effectiveness - Harvard Graduate ...

Create successful ePaper yourself
Turn your PDF publications into a flip-book with our unique Google optimized e-Paper software.
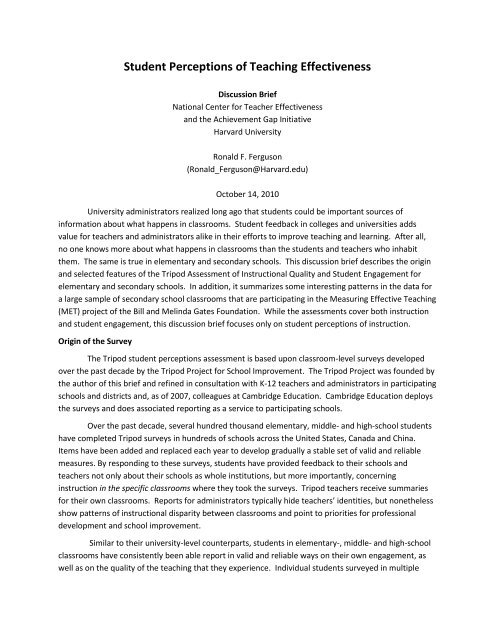
<strong>Student</strong> <strong>Perceptions</strong> <strong>of</strong> <strong>Teaching</strong> <strong>Effectiveness</strong><br />
Discussion Brief<br />
National Center for Teacher <strong>Effectiveness</strong><br />
and the Achievement Gap Initiative<br />
<strong>Harvard</strong> University<br />
Ronald F. Ferguson<br />
(Ronald_Ferguson@<strong>Harvard</strong>.edu)<br />
October 14, 2010<br />
University administrators realized long ago that students could be important sources <strong>of</strong><br />
information about what happens in classrooms. <strong>Student</strong> feedback in colleges and universities adds<br />
value for teachers and administrators alike in their efforts to improve teaching and learning. After all,<br />
no one knows more about what happens in classrooms than the students and teachers who inhabit<br />
them. The same is true in elementary and secondary schools. This discussion brief describes the origin<br />
and selected features <strong>of</strong> the Tripod Assessment <strong>of</strong> Instructional Quality and <strong>Student</strong> Engagement for<br />
elementary and secondary schools. In addition, it summarizes some interesting patterns in the data for<br />
a large sample <strong>of</strong> secondary school classrooms that are participating in the Measuring Effective <strong>Teaching</strong><br />
(MET) project <strong>of</strong> the Bill and Melinda Gates Foundation. While the assessments cover both instruction<br />
and student engagement, this discussion brief focuses only on student perceptions <strong>of</strong> instruction.<br />
Origin <strong>of</strong> the Survey<br />
The Tripod student perceptions assessment is based upon classroom-level surveys developed<br />
over the past decade by the Tripod Project for School Improvement. The Tripod Project was founded by<br />
the author <strong>of</strong> this brief and refined in consultation with K-12 teachers and administrators in participating<br />
schools and districts and, as <strong>of</strong> 2007, colleagues at Cambridge Education. Cambridge Education deploys<br />
the surveys and does associated reporting as a service to participating schools.<br />
Over the past decade, several hundred thousand elementary, middle- and high-school students<br />
have completed Tripod surveys in hundreds <strong>of</strong> schools across the United States, Canada and China.<br />
Items have been added and replaced each year to develop gradually a stable set <strong>of</strong> valid and reliable<br />
measures. By responding to these surveys, students have provided feedback to their schools and<br />
teachers not only about their schools as whole institutions, but more importantly, concerning<br />
instruction in the specific classrooms where they took the surveys. Tripod teachers receive summaries<br />
for their own classrooms. Reports for administrators typically hide teachers’ identities, but nonetheless<br />
show patterns <strong>of</strong> instructional disparity between classrooms and point to priorities for pr<strong>of</strong>essional<br />
development and school improvement.<br />
Similar to their university-level counterparts, students in elementary-, middle- and high-school<br />
classrooms have consistently been able report in valid and reliable ways on their own engagement, as<br />
well as on the quality <strong>of</strong> the teaching that they experience. Individual students surveyed in multiple
classes—say, English, math and science—tend to respond differently in different classes, reflecting<br />
variation in what they experience. Response patterns indicate that individuals <strong>of</strong>ten experience great<br />
teaching in one subject, but then mediocre teaching another.<br />
Measures <strong>of</strong> <strong>Teaching</strong> Quality<br />
The primary measures <strong>of</strong> instructional quality in the Tripod surveys are gathered under seven<br />
headings called the Seven C’s. The seven are: Care, Control, Clarify, Challenge, Captivate, Confer and<br />
Consolidate. The Seven C’s are grounded upon a great deal <strong>of</strong> education research by many researchers<br />
over the past several decades. They capture much <strong>of</strong> what researchers have suggested is important in<br />
determining how well teachers teach and how much students learn. Each <strong>of</strong> the C’s is measured using<br />
multiple survey items. The following are brief descriptions <strong>of</strong> each concept.<br />
The Seven C’s<br />
1. Care pertains to teacher behaviors that help students to feel emotionally safe and to rely on the<br />
teacher to be a dependable ally in the classroom. Caring reduces anxiety and provides a sense<br />
<strong>of</strong> positive affiliation and belonging. Caring goes beyond “niceness”; caring teachers work hard,<br />
and they go out <strong>of</strong> their way to help. They signal to their students, “I want you to be happy and<br />
successful, and I will work hard to serve your best interest; your success is an important source<br />
<strong>of</strong> my personal satisfaction.” An example <strong>of</strong> a MET survey item measuring Care is: “My teacher<br />
really tries to understand how students feel about things.”<br />
2. Control pertains to classroom management. Teachers need skills to manage student<br />
propensities towards <strong>of</strong>f-task or out-<strong>of</strong>-order behaviors, in order to foster conditions in the<br />
classroom that allow for effective communication and focus. Effective control helps to maintain<br />
order and supplements caring in making the classroom calm and emotionally safe from such<br />
things as negative peer pressures. An example <strong>of</strong> a MET survey item measuring Control is: “Our<br />
class stays busy and doesn’t waste time.”<br />
3. Clarify concerns teacher behaviors that promote understanding. Interactions that clear up<br />
confusion and help students persevere are especially important. Each student comes with<br />
particular gaps in understanding and with both correct and incorrect interpretations <strong>of</strong> the<br />
world around them. To be most effective, teachers should be able to diagnose students’ skills<br />
and knowledge, and they need multiple ways <strong>of</strong> explaining ideas that are likely to be difficult for<br />
students to grasp. Teachers also must judge how much information students can absorb at any<br />
one time, and they should differentiate instruction according to individual maturity and interest.<br />
An example <strong>of</strong> a MET survey item measuring Clarify is: “My teacher has several good ways to<br />
explain each topic that we cover in this class.”<br />
4. Challenge concerns both effort and rigor -- pressing students to work hard and to think hard. .<br />
Challenging teachers tend to monitor student effort and to confront students if their effort is<br />
unsatisfactory. <strong>Student</strong>s who do not devote enough time to their work or who give up too easily<br />
in the face <strong>of</strong> difficulty are pushed to do more. Similarly, students who do not think deeply or to<br />
reason their way through challenging questions are both supported and pushed. The teacher<br />
may ask a series <strong>of</strong> follow-up questions intended to elicit deeper, more thorough reasoning. An<br />
example <strong>of</strong> a MET survey question measuring Challenge for effort is: “In this class, my teacher<br />
2 | P a g e
accepts nothing less than our full effort.” A question measuring Challenge for rigorous thinking<br />
is: “My teacher wants us to use our thinking skills, not just memorize things.”<br />
5. Captivate concerns teacher behaviors that make instruction stimulating, instead <strong>of</strong> boring.<br />
Captivating teachers make the material interesting, <strong>of</strong>ten by making it seem relevant to things<br />
about which students already care. Brain research establishes clearly that stimulating learning<br />
experiences and relevant material make lessons easier to remember than when the experience<br />
is boring and the material seems irrelevant. Examples <strong>of</strong> questions concerning stimulation and<br />
relevance are: “My teacher makes lessons interesting,” and “[negatively worded] I <strong>of</strong>ten feel like<br />
this class has nothing to do with real life outside school.”<br />
6. Confer concerns seeking students’ points <strong>of</strong> view by asking them questions and inviting them to<br />
express themselves. When students expect that the teacher might call on them to speak in<br />
class, they have an incentive to stay alert. In addition, believing that the teacher values their<br />
points <strong>of</strong> view provides positive reinforcement for the effort that it takes to formulate a<br />
perspective in the first place. Further, if students are asked to respond not only to the teacher,<br />
but to one another as well, a learning community may develop in the classroom, with all <strong>of</strong> the<br />
attended social reinforcements. An example <strong>of</strong> a question concerning Confer is: “My teacher<br />
gives us time to explain our ideas.”<br />
7. Consolidate is the seventh C. Consolidation concerns how teachers help students to organize<br />
material for more effective encoding in memory and for more efficient reasoning. These<br />
practices include reviewing and summarizing material at the end <strong>of</strong> classes and connecting ideas<br />
to material covered in previous lessons. Teachers who excel at consolidation talk about the<br />
relationships between ideas and help students to see patterns. There is a large body <strong>of</strong><br />
evidence supporting the hypothesis that these types <strong>of</strong> instructional activities enhance retention<br />
by building multiple brain pathways for retrieving knowledge and for combining disparate bits <strong>of</strong><br />
knowledge in effective reasoning. An example <strong>of</strong> a question concerning Consolidation is: “My<br />
teacher takes the time to summarize what we learn each day.”<br />
There are between four and eight survey items associated with each particular C. The result is seven<br />
composite measures, one for each <strong>of</strong> the Seven C’s. Each item in a given Seven C’s index represents a<br />
different way <strong>of</strong> measuring that particular one <strong>of</strong> the Seven C’s.<br />
There is a useful distinction in the teaching quality literature between “support” and “press.”<br />
Support refers to ways <strong>of</strong> serving and communicating with students that the students are likely to<br />
perceive as helpful and welcome. Conversely, press imposes some degree <strong>of</strong> stress. It refers to<br />
communication that students may experience as pressure to move outside <strong>of</strong> their comfort zones.<br />
Below, we distinguish the Five Support C’s—i.e., Care, Clarify, Captivate, Confer and Consolidate—from<br />
the two C’s that entail a higher degree <strong>of</strong> press, i.e. Control and Challenge. Challenge and Control<br />
strongly connote teacher demandingness. However, Challenge is not so easy to classify. Our findings<br />
indicate that Challenge may entail aspects <strong>of</strong> both support and press.<br />
Quality <strong>of</strong> the Measures<br />
Stephen Raudenbush <strong>of</strong> the University <strong>of</strong> Chicago has helped develop a multi-level<br />
measurement model for the Tripod surveys. The model takes account <strong>of</strong> multiple types <strong>of</strong><br />
3 | P a g e
measurement error in calibrating reliability statistics. Recall that there are several survey items for each<br />
student in each composite index for each <strong>of</strong> the Seven C’s. The Seven C’s indices defined at the student<br />
level are used to create classroom-level measures that aggregate across students. Classroom-level<br />
measures, in turn, are embedded inside schools. The measurement model assumes that random factors<br />
introduce measurement error at each level <strong>of</strong> this system. Calculations that calibrate the measurement<br />
errors are the basis <strong>of</strong> reliability measures. For each Seven C’s index, the reliability represents the<br />
fraction <strong>of</strong> variation in that index that is true variation, not due to measurement error.<br />
Using this measurement model, indices for the Seven C’s constructed from MET survey data<br />
have proven highly reliable—in the range <strong>of</strong> 0.80 and above. They are also remarkably stable during the<br />
school year. To examine this stability, a special sample <strong>of</strong> 141 classrooms was surveyed in December<br />
2009 and again in March 2010. Classroom-level indices were constructed for each month and<br />
compared. Corrected for measurement error, the correlations for given classroom quality indices,<br />
comparing the December and March values, ranged between 0.70 and 0.85.<br />
A more intuitive way to analyze the stability is the following. For each month, we used the<br />
survey responses for all 7 <strong>of</strong> the Seven C’s to form a single composite quality measure. Then, we used<br />
this measure to rank order the classrooms and form deciles. The bottom ten percent <strong>of</strong> classrooms in<br />
the ranking comprises the first decile, and so on. There is one set <strong>of</strong> deciles defined using the December<br />
data and another set defined using the March data.<br />
For the 141 classrooms in the analysis, 78 percent moved no more than one decile up or down<br />
between December and March. Ninety-three percent moved no more than two. Hence, there was<br />
great stability. At the same time, some classrooms did get better and some got worse. We know this<br />
because consistency between student responses within-classrooms at each point in time was sufficient<br />
to distinguish classrooms that changed from those that did not. In other words, for a minority <strong>of</strong><br />
classrooms, we are able to reject the null-hypothesis that students perceived quality to be the same in<br />
March as in December.<br />
Dimensions <strong>of</strong> <strong>Teaching</strong> Quality<br />
We analyzed data from 1264 English Language Arts (ELA) classrooms and 1094 math classrooms<br />
to examine how strongly the Seven C’s distinguish dimensions <strong>of</strong> teaching quality. 1 The data were<br />
classroom averages <strong>of</strong> student survey responses. The goal was to learn more about what combinations<br />
<strong>of</strong> survey responses most strongly distinguish classrooms from one another. In addition to the Seven Cs,<br />
we included two other constructs in the analysis reported in Panel A <strong>of</strong> Exhibit 1. One was a three-item<br />
measure <strong>of</strong> how much time the class spent preparing for the state accountability exams (referred to as<br />
Test-Prep Emphasis on Exhibit 1). The other was a three item measure <strong>of</strong> Class Emotional Climate,<br />
measuring the degree to which students felt nervous, stressed or angry in the classrooms where they<br />
completed the MET survey.<br />
Panels A and B <strong>of</strong> Exhibit 1 summarize two distinct analyses. Each sheds light from a distinct<br />
vantage point (which we explain) on dimensions <strong>of</strong> classroom quality. The analysis summarized in Panel<br />
A included all <strong>of</strong> the survey items for each <strong>of</strong> the Seven C’s, as well as the Test Prep Emphasis and the<br />
1 This is what researchers call “factor analysis.” Here, we explain the findings in nontechnical language.<br />
4 | P a g e
Class Emotional Climate items. The analysis for Panel B included all <strong>of</strong> the items for six <strong>of</strong> the Seven C’s,<br />
excluding Control.<br />
Panel A: The Helicopter Vantage Point. Imagine sitting 300 feet above the ground in a<br />
helicopter looking down at a row <strong>of</strong> apartment buildings. You are trying to describe what you see.<br />
Some <strong>of</strong> the variation you observe—say, twenty percent <strong>of</strong> it—entails different styles <strong>of</strong> chimneys.<br />
Another ten percent entails different sized air conditioning units on the ro<strong>of</strong>tops. Twenty percent is flat<br />
ro<strong>of</strong>s and constituent materials. The remaining fifty percent might be the sides <strong>of</strong> the various buildings;<br />
but because <strong>of</strong> the angle <strong>of</strong> vision and the light, the features (e.g., windows, doors, siding materials, etc.)<br />
blur together and are difficult to distinguish.<br />
Exhibit 1: Dimensions <strong>of</strong> <strong>Teaching</strong> Distinguished by <strong>Student</strong> Survey Responses<br />
Secondary School <strong>Student</strong>s in English Language Arts/Reading and Math<br />
PANEL A: Dimensional Analysis <strong>of</strong> Classroom Conditions<br />
English Language Arts (ELA)<br />
Math<br />
Dimensions: 1 2 3 4 5 1 2 3 4 5<br />
The Five “Support” Cs<br />
Control (Press)<br />
Test-Prep Emphasis<br />
Challenge (Press)<br />
Class Emotional Climate<br />
Proportion <strong>of</strong> Variance 0.52 0.22 0.09 0.08 0.05 0.52 0.23 0.09 0.07 0.05<br />
PANEL B: Dimensional Analysis <strong>of</strong> Six C’s other than Control.<br />
English Language Arts (ELA)<br />
Math<br />
Dimensions: 1 2 3 1 2 3 4<br />
Care<br />
Clarify<br />
Challenge A: Effort<br />
Challenge B: Rigor<br />
Captivate<br />
Confer<br />
Consolidate<br />
Proportion <strong>of</strong> Variance 0.47 0.33 0.12 0.31 0.29 0.23 0.13<br />
Classrooms with no fewer than 10 and no more than 35 students. Based upon principal factors<br />
analysis with orthogonal varimax rotation, using classroom-level means as the units <strong>of</strong> analysis.<br />
Separately for each subject (i.e., ELA and math), the initial factor analysis distinguished the Control<br />
index from the other six; Control loaded on one factor while the other six loaded on another. A<br />
second factor analysis using only items for the other six indices produced the distinctions shown in<br />
columns 1, 2 and 3. N=1264 Classrooms for ELA; N=1090 Classrooms for math.<br />
Panel A is like the view from the helicopter. First, just as the vantage point <strong>of</strong> the helicopter<br />
makes it difficult to distinguish windows, doors and textures on the sides <strong>of</strong> the buildings, the vantage<br />
point for Panel A makes it difficult to distinguishing the Five Support C’s from one another and also from<br />
5 | P a g e
Challenge. Nonetheless, the Five Support Cs and Challenge as an amorphous group (like the non-distinct<br />
features on the sides <strong>of</strong> buildings) account for half <strong>of</strong> the classroom-to-classroom variation that we see<br />
in this collection <strong>of</strong> variables (specifically, 52 percent). Like helicopter views <strong>of</strong> chimneys and air<br />
conditioning units on ro<strong>of</strong>tops, classroom-to-classroom differences in Test-Prep Emphasis and<br />
Classroom Emotional Climate are easy to distinguish even though they do not account for much <strong>of</strong> the<br />
observable variation between classrooms (9 percent and 5 percent, respectively). Of the two “press”<br />
C’s, which are distinguishable from this view, Control is the most distinguishable and accounts for 22<br />
percent <strong>of</strong> the between-classroom variation in student responses. Finally in Panel A, Challenge appears<br />
both as a distinct dimension <strong>of</strong> classroom quality (Column 4)—a measure <strong>of</strong> press distinct from<br />
Control—and also as part <strong>of</strong> the amorphous group with the other Five Support Cs (Column 1). 2<br />
There is almost no difference between ELA and Math in the distinctions that Panel A highlights.<br />
For both ELA and math, the major dimensions that distinguish classrooms from one another are Five<br />
Support Cs and Challenge as an amorphous group, classroom Control, Challenge, Test-Prep Emphasis and<br />
Classroom Emotional Climate.<br />
Panel B: The Ground-Level View. Imagine now standing on the ground where all you can see is<br />
the sides <strong>of</strong> the same buildings, not the tops. The chimneys and air conditioning units are hidden from<br />
view, but features on the sides <strong>of</strong> the buildings are much more discernable than they were from the<br />
helicopter. The analysis in Panel B omits the “ro<strong>of</strong>top” measures—Control, Test-Prep Emphasis and<br />
Classroom Emotional Climate—that were most distinguishable in Panel A, but it includes Challenge<br />
because it was part <strong>of</strong> the amorphous group with the Five Support C’s. Observing “from the ground<br />
level”—as though looking up at windows, doors and siding materials—we can see that classrooms are<br />
distinguished by different combinations <strong>of</strong> Care, Clarify, Challenge, Captivate, Confer and Consolidate.<br />
We learn in Panel B that the Seven C’s function a bit differently for ELA as compared with math.<br />
For ELA, the quality in that most strongly distinguishes classes from one another appears to be<br />
Captivation (hence the blackened rectangle for Captivation in Column 1). But Care, Clarify, Confer and<br />
Consolidate are associated with this dimension as well (thus shaded in grey), as though in support <strong>of</strong><br />
Captivation. One interpretation is that English teachers make lessons captivating when they connect<br />
with students through caring, explaining lessons clearly, conferring with students about their views and<br />
summarizing lessons to make them coherent. However, the second most distinguishing dimension for<br />
ELA is Challenge (for both effort and rigor), with supporting roles for Clarify and Consolidate. An<br />
interpretation here is that English teachers make lessons more challenging when they also make them<br />
clear and coherent. The only additional distinguishing dimension for ELA is Confer. ELA teachers are<br />
distinguished from one another by their tendency to confer with students, for example, by inviting them<br />
to share ideas.<br />
Math is different. Survey items for Care and Captivate dominate two major dimensions <strong>of</strong><br />
classroom quality, each <strong>of</strong> which strongly distinguishes math classrooms from one another. Perhaps<br />
caring is more important for math than for ELA because math is a more difficult subject and caring<br />
teachers are more effective at reducing math anxiety. Clarify does not dominate any dimension, but<br />
2 In other words, the items in the Challenge index load heavily on the factor for the Five Support C’s and also on a<br />
separate factor, where the Challenge items are the only ones with heavy loadings.<br />
6 | P a g e
instead shows up in a supporting role on both the Care and Captivate dimensions. Apparently, the<br />
capacity to clarify difficult math concepts supports the communication <strong>of</strong> caring and the ability to make<br />
lessons captivating. A frustrated teacher may communicate less care; and math that is confusing is<br />
unlikely to be captivating. Finally, for math but not for ELA, Challenge for effort and Challenge for rigor<br />
appear as two separate dimensions. The math teachers that challenge students to work hard—for<br />
example, to do a lot <strong>of</strong> homework—are not necessarily the same teachers that challenge them to think<br />
hard. The two types <strong>of</strong> Challenge constitute separate ways <strong>of</strong> distinguishing among math teachers.<br />
Classrooms Differ Tremendously<br />
Finally, recall the discussion above where we used a composite index <strong>of</strong> survey items to consider<br />
stability <strong>of</strong> classroom rankings from December to March. Here in this section, we use a similar ranking,<br />
but we employ the data for all <strong>of</strong> the 1094 math and 1264 ELA classrooms from the analysis directly<br />
above. This produces a ranking with 2358 classrooms that range from the lowest to the highest rated<br />
overall. The ranking can be broken into deciles and we can examine the differences in levels <strong>of</strong><br />
agreement with survey items in different parts <strong>of</strong> the quality distribution. With 2358 classrooms, there<br />
are roughly 236 classrooms and almost twenty times that many students in each decile.<br />
How much do classrooms differ? Exhibit 2 shows average levels <strong>of</strong> agreement with each <strong>of</strong> the<br />
Seven C’s in the first, fifth and tenth deciles <strong>of</strong> the overall composite teaching quality distribution. The<br />
disparity is massive. Fewer than 20 percent <strong>of</strong> students in the first decile <strong>of</strong> the quality distribution<br />
agree with statements in the Care index, while almost 80 percent in the tenth decile agree with the<br />
same statements. Captivate follows a similar pattern to Care, except that the level <strong>of</strong> agreement is<br />
somewhat higher, especially in the tenth decile, where 85 percent agree with statements in the<br />
Captivate index. Items in the Challenge index generate the highest levels <strong>of</strong> agreement for all three<br />
segments—at the bottom, middle and top <strong>of</strong> the quality ranking. Imagine how different life must be in<br />
these three segments <strong>of</strong> the classroom quality distribution!<br />
Conclusion<br />
Researchers over many decades have suggested that students will engage more deeply and<br />
master their lessons more thoroughly when their teachers care about them, control the classroom well,<br />
clarify complex ideas, challenge them to work hard and think hard, deliver lessons in ways that<br />
captivate, confer with them about their ideas and consolidate lessons to make learning coherent.<br />
Building upon Tripod surveys developed over the past decade, MET student perception surveys are<br />
giving students in thousands <strong>of</strong> classrooms the opportunity to demonstrate that they can distinguish<br />
their classrooms on these key dimensions. <strong>Student</strong> responses are reliable, valid and stable over time at<br />
the classroom level. MET constitutes an unprecedented opportunity to combine these student<br />
perceptions with information collected by other methods and to measure how together they predict<br />
learning outcomes. Classroom-level student surveys are a high-potential mechanism for incorporating<br />
students’ voices in massive numbers into school, district, state and national efforts to improve teaching<br />
and learning in elementary, middle and high schools.<br />
7 | P a g e
1. Care<br />
2. Control<br />
3. Clarify<br />
4. Challenge<br />
5. Captivate<br />
6. Confer<br />
7. Consolidate<br />
Exhibit 2: Mean percentage agreement with items in each Seven Cs<br />
index, in the first, fifth and ninth deciles <strong>of</strong> the composite measure.<br />
First Decile Fifth Decile Tenth Decile<br />
0 10 20 30 40 50 60 70 80 90 100<br />
8 | P a g e