Student Perceptions of Teaching Effectiveness - Harvard Graduate ...
Student Perceptions of Teaching Effectiveness - Harvard Graduate ...
Student Perceptions of Teaching Effectiveness - Harvard Graduate ...

You also want an ePaper? Increase the reach of your titles
YUMPU automatically turns print PDFs into web optimized ePapers that Google loves.
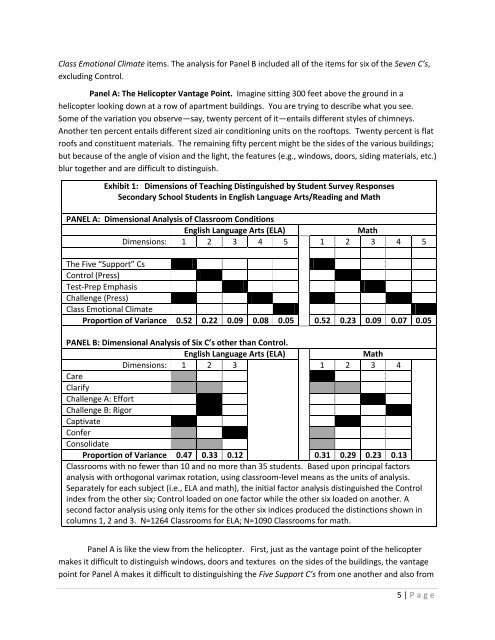
Class Emotional Climate items. The analysis for Panel B included all <strong>of</strong> the items for six <strong>of</strong> the Seven C’s,<br />
excluding Control.<br />
Panel A: The Helicopter Vantage Point. Imagine sitting 300 feet above the ground in a<br />
helicopter looking down at a row <strong>of</strong> apartment buildings. You are trying to describe what you see.<br />
Some <strong>of</strong> the variation you observe—say, twenty percent <strong>of</strong> it—entails different styles <strong>of</strong> chimneys.<br />
Another ten percent entails different sized air conditioning units on the ro<strong>of</strong>tops. Twenty percent is flat<br />
ro<strong>of</strong>s and constituent materials. The remaining fifty percent might be the sides <strong>of</strong> the various buildings;<br />
but because <strong>of</strong> the angle <strong>of</strong> vision and the light, the features (e.g., windows, doors, siding materials, etc.)<br />
blur together and are difficult to distinguish.<br />
Exhibit 1: Dimensions <strong>of</strong> <strong>Teaching</strong> Distinguished by <strong>Student</strong> Survey Responses<br />
Secondary School <strong>Student</strong>s in English Language Arts/Reading and Math<br />
PANEL A: Dimensional Analysis <strong>of</strong> Classroom Conditions<br />
English Language Arts (ELA)<br />
Math<br />
Dimensions: 1 2 3 4 5 1 2 3 4 5<br />
The Five “Support” Cs<br />
Control (Press)<br />
Test-Prep Emphasis<br />
Challenge (Press)<br />
Class Emotional Climate<br />
Proportion <strong>of</strong> Variance 0.52 0.22 0.09 0.08 0.05 0.52 0.23 0.09 0.07 0.05<br />
PANEL B: Dimensional Analysis <strong>of</strong> Six C’s other than Control.<br />
English Language Arts (ELA)<br />
Math<br />
Dimensions: 1 2 3 1 2 3 4<br />
Care<br />
Clarify<br />
Challenge A: Effort<br />
Challenge B: Rigor<br />
Captivate<br />
Confer<br />
Consolidate<br />
Proportion <strong>of</strong> Variance 0.47 0.33 0.12 0.31 0.29 0.23 0.13<br />
Classrooms with no fewer than 10 and no more than 35 students. Based upon principal factors<br />
analysis with orthogonal varimax rotation, using classroom-level means as the units <strong>of</strong> analysis.<br />
Separately for each subject (i.e., ELA and math), the initial factor analysis distinguished the Control<br />
index from the other six; Control loaded on one factor while the other six loaded on another. A<br />
second factor analysis using only items for the other six indices produced the distinctions shown in<br />
columns 1, 2 and 3. N=1264 Classrooms for ELA; N=1090 Classrooms for math.<br />
Panel A is like the view from the helicopter. First, just as the vantage point <strong>of</strong> the helicopter<br />
makes it difficult to distinguish windows, doors and textures on the sides <strong>of</strong> the buildings, the vantage<br />
point for Panel A makes it difficult to distinguishing the Five Support C’s from one another and also from<br />
5 | P a g e