Construction and Demolition Waste Minimization - Nctcog
Construction and Demolition Waste Minimization - Nctcog
Construction and Demolition Waste Minimization - Nctcog

Create successful ePaper yourself
Turn your PDF publications into a flip-book with our unique Google optimized e-Paper software.
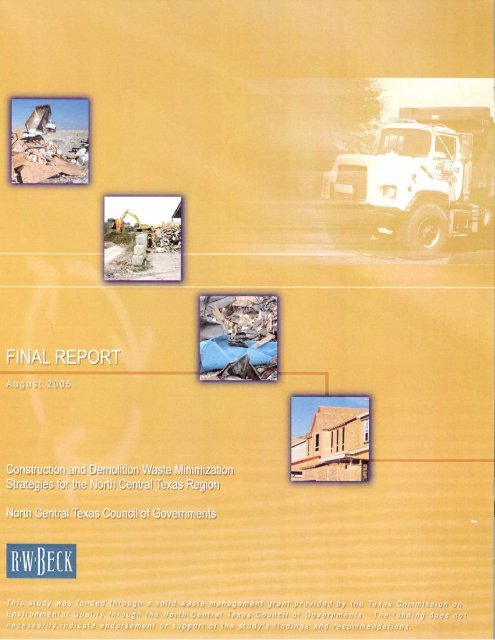
<strong>Construction</strong> <strong>and</strong> <strong>Demolition</strong> <strong>Waste</strong> <strong>Minimization</strong><br />
Strategies for the North Central Texas Region<br />
Table of Contents<br />
Letter of Transmittal<br />
Table of Contents<br />
List of Tables<br />
List of Figures<br />
Section 1 Executive Summary.................................................................................. 1-1<br />
1.1 Background.............................................................................................. 1-1<br />
1.2 Purpose..................................................................................................... 1-2<br />
1.3 Case Study/Cost Benefit Analysis ........................................................... 1-2<br />
1.4 Elements of Successful <strong>Waste</strong> <strong>Minimization</strong> Strategies.......................... 1-8<br />
1.5 Strategic Approach................................................................................. 1-10<br />
Section 2 Green Building Case Study...................................................................... 2-1<br />
2.1 General Description ................................................................................. 2-1<br />
2.2 Implementation ........................................................................................ 2-1<br />
2.3 Keys <strong>and</strong> Impediments to Success........................................................... 2-6<br />
2.4 Cost Benefit Analysis .............................................................................. 2-7<br />
2.5 Key Findings <strong>and</strong> Recommendations .................................................... 2-10<br />
Section 3 C&D Material Recovery Facility Case Study ........................................ 3-1<br />
3.1 General Description ................................................................................. 3-1<br />
3.2 Implementation ........................................................................................ 3-1<br />
3.3 Keys <strong>and</strong> Impediments to Success........................................................... 3-9<br />
3.4 Cost Benefit Analysis ............................................................................ 3-10<br />
3.5 Key Findings <strong>and</strong> Recommendations .................................................... 3-12<br />
Section 4 On-Site Grinding Case Study .................................................................. 4-1<br />
4.1 General Description ................................................................................. 4-1<br />
4.2 Implementation ........................................................................................ 4-1<br />
4.3 Keys <strong>and</strong> Impediments to Success........................................................... 4-6<br />
4.4 Cost Benefit Analysis .............................................................................. 4-7<br />
4.5 Key Findings <strong>and</strong> Recommendations .................................................... 4-13<br />
Section 5 LEED Deconstruction Case Study .......................................................... 5-1<br />
5.1 General Description ................................................................................. 5-1<br />
5.2 Implementation ........................................................................................ 5-1<br />
9/14/05
Table of Contents<br />
5.3 Keys <strong>and</strong> Impediments to Success......................................................... 5-11<br />
5.4 Cost Benefit Analysis ............................................................................ 5-11<br />
5.5 Key Findings <strong>and</strong> Recommendations .................................................... 5-14<br />
Section 6 LEED Renovation Case Study ................................................................ 6-1<br />
Section 7 Best Management Practices..................................................................... 7-1<br />
7.1 Practical Application of <strong>Waste</strong> <strong>Minimization</strong> Practices.......................... 7-1<br />
7.2 Efficient Building Practices..................................................................... 7-3<br />
7.3 Technical Assistance Resources............................................................ 7-10<br />
Section 8 Public Sector Initiatives ........................................................................... 8-1<br />
8.1 C&D <strong>Waste</strong> Diversion Programs............................................................. 8-1<br />
8.2 Increasing Participation through Incentives ............................................ 8-7<br />
8.3 Increasing Participation through Ordinance .......................................... 8-12<br />
Section 9 Legal Summary......................................................................................... 9-1<br />
9.1 Temporary Crushing Rules...................................................................... 9-1<br />
9.2 “Sham” Recycling ................................................................................... 9-2<br />
9.3 Green Building Legislation...................................................................... 9-3<br />
9.4 Clean-Air Legislation .............................................................................. 9-4<br />
9.5 Opportunities for Additional Legislation................................................. 9-4<br />
Section 10 Funding Mechanisms ........................................................................... 10-1<br />
10.1 C&D <strong>Waste</strong> <strong>Minimization</strong> Funding Opportunities................................ 10-1<br />
10.2 Green Building Funding Opportunities ................................................. 10-3<br />
Section 11 Strategic Approach............................................................................... 11-1<br />
11.1 Regional Government - NCTCOG ........................................................ 11-2<br />
11.2 Local Governments................................................................................ 11-7<br />
11.3 Recycling <strong>and</strong> <strong>Construction</strong> Industries.................................................. 11-8<br />
Appendix A: Local Government Assistance Documents<br />
Appendix B: C&D Materials Summary<br />
Appendix C: Hensley Site Phase I Material Diversion Analysis<br />
Appendix D: Hensley Site Phase II Material Diversion Analysis<br />
Appendix E: <strong>Waste</strong> Management Plan <strong>and</strong> Reporting Template<br />
Appendix F: Public Awareness Materials<br />
ii 9/14/05
Table of Contents<br />
This study was funded through a solid waste management grant provided by the Texas<br />
Commission on Environmental Quality through the North Central Texas Council of<br />
Governments. This funding does not necessarily indicate endorsement or support of<br />
the study’s findings <strong>and</strong> recommendations.<br />
This report has been prepared for the use of the client for the specific purposes identified in the<br />
report. The conclusions, observations <strong>and</strong> recommendations contained herein attributed to<br />
R. W. Beck, Inc. (R. W. Beck) constitute the opinions of R. W. Beck. To the extent that<br />
statements, information <strong>and</strong> opinions provided by the client or others have been used in the<br />
preparation of this report, R. W. Beck has relied upon the same to be accurate, <strong>and</strong> for which no<br />
assurances are intended <strong>and</strong> no representations or warranties are made. R. W. Beck makes no<br />
certification <strong>and</strong> gives no assurances except as explicitly set forth in this report.<br />
Copyright 2005, R. W. Beck, Inc.<br />
All rights reserved.<br />
9/14/05 iii
Table of Contents<br />
List of Tables<br />
Table 2-1 Green Building Program Staffing Recommendations.................................2-3<br />
Table 2-2 Funding Methods for Green Building Programs.......................................2-10<br />
Table 3-1 Source of C&D Debris ................................................................................3-2<br />
Table 3-2 Source of C&D Debris ................................................................................3-3<br />
Table 3-4 Distribution of C&D Disposal.....................................................................3-7<br />
Table 3-5 Model Facility Capital Expenses...............................................................3-10<br />
Table 3-6 Model Facility Operating <strong>and</strong> Maintenance Expenses..............................3-11<br />
Table 3-7 Cost per Ton Comparison..........................................................................3-11<br />
Table 3-8 Model Facility Revenue <strong>and</strong> Expenses......................................................3-11<br />
Table 3-9 Tipping Fees with Co-Located Facility.....................................................3-13<br />
Table 4-1 Major <strong>Waste</strong> Generating Periods.................................................................4-2<br />
Table 4-2 Custom Home Cost Benefit Analysis Based on 10 Homes<br />
Annually ......................................................................................................4-9<br />
Table 4-3 Production Home Cost Benefit Analysis Based on 50 Homes<br />
Annually ....................................................................................................4-10<br />
Table 5-1 Phase One – Material Recovery Results .....................................................5-3<br />
Table 5-2 HVAC System Component Disposal Summary..........................................5-5<br />
Table 5-3 Electrical System Component Disposal Summary......................................5-6<br />
Table 5-4 Plumbing System Component Disposal Summary......................................5-7<br />
Table 5-5 Deconstruction Related Labor Hours by Material.......................................5-8<br />
Table 5-6 Salvaged Materials ......................................................................................5-9<br />
Table 5-7 Recycled Materials ......................................................................................5-9<br />
Table 5-8 Deconstruction Cost Analysis ...................................................................5-12<br />
Table 5-9 Cost Comparison of Solid <strong>Waste</strong> Management Methods..........................5-12<br />
Table 10-1 C&D Recycling Grant Information.........................................................10-6<br />
Table 10-2 C&D Recycling Grant Information.........................................................10-7<br />
Table 11-1 Public Awareness Campaign Examples ..................................................11-3<br />
Table 11-2 Five-year Action Plan – Strategic Approach...........................................11-9<br />
List of Figures<br />
Figure 3-1: Process Flow Diagram .............................................................................3-4<br />
Figure 4-1: On-Site Grinding Process.......................................................................4-14<br />
iv 9/14/05
Section 1<br />
Executive Summary<br />
1.1 Background<br />
Through its SEE Less Trash Regional Solid <strong>Waste</strong> Management Plan, the North<br />
Central Texas Council of Governments (NCTCOG) identified construction <strong>and</strong><br />
demolition (C&D) recycling, reuse <strong>and</strong> reduction as an objective under one of its<br />
primary goals, which is Time to Recycle. The NCTCOG recognized the need to<br />
evaluate C&D waste minimization strategies as an opportunity to increase overall<br />
waste diversion efforts in the North Central Texas region.<br />
Traditionally, waste diversion efforts in North Central Texas have focused on the<br />
municipal solid waste (MSW) stream. After implementing recycling programs that<br />
focus on residential <strong>and</strong> commercial sources of MSW, many communities <strong>and</strong> private<br />
companies within the region have recognized a need to explore additional options to<br />
increase their diversion rates. Several communities <strong>and</strong> private companies have<br />
started evaluating the feasibility to increase diversion efforts by implementing<br />
effective C&D waste minimization strategies. This concept follows trends in other<br />
parts of the U. S. where communities <strong>and</strong> private companies have successfully<br />
developed waste minimization strategies that focus on the C&D stream.<br />
By evaluating opportunities to increase the diversion of C&D debris, NCTCOG also<br />
has the opportunity to positively impact the other two primary regional solid waste<br />
management goals: Assure Capacity for Trash <strong>and</strong> Stop Illegal Dumping.<br />
From a l<strong>and</strong>fill capacity perspective, the North Central Texas region faces a potential<br />
long-term l<strong>and</strong>fill capacity shortage. 1 By evaluating options to increase the diversion<br />
of C&D materials, the opportunity exists to prolong the life of existing facilities <strong>and</strong> to<br />
delay the need for future expansions or new facilities.<br />
Additionally, as identified in the NCTCOG’s 2001 Targeted Illegal Dumper Study,<br />
C&D waste represents a significant type of illegal dumping in the North Central Texas<br />
region. Contractors <strong>and</strong> builders often dispose of C&D waste illegally to avoid<br />
tipping fees. Local governments throughout the region dedicate thous<strong>and</strong>s of dollars<br />
to cleaning up these dumpsites annually. 2 By developing effective C&D waste<br />
minimization strategies, there may be an opportunity to reduce the illegal disposal of<br />
C&D debris.<br />
1 Source: Metroplex Area Sub-Regional Solid <strong>Waste</strong> Study. Dallas County. 2004.<br />
2 Source: Stop Illegal Dumping Cost/Benefit Analysis, NCTCOG, 2003.<br />
9/14/05
Section 1<br />
1.2 Purpose<br />
In 2004, the NCTCOG <strong>and</strong> the Time to Recycle Subcommittee (TTR Subcommittee)<br />
retained R. W. Beck, Inc. (R. W. Beck) to conduct this study. The primary goal of the<br />
study is to evaluate what C&D waste minimization programs <strong>and</strong> practices are<br />
currently in place or may be feasible in the North Central Texas region.<br />
R. W. Beck focused on examining three fundamental questions about C&D waste<br />
minimization in the region.<br />
• What emerging or existing C&D waste minimization programs <strong>and</strong> practices are<br />
economically <strong>and</strong> operationally feasible for implementation in the North Central<br />
Texas region?<br />
• What specific elements would comprise a successful C&D waste minimization<br />
program or practice for communities or businesses in the North Central Texas<br />
region?<br />
• If C&D waste minimization is feasible in the North Central Texas region, how<br />
can it be implemented throughout the entire region?<br />
To answer these questions, R. W. Beck completed case study analyses of five C&D<br />
waste minimization programs. Each case study included a cost benefit analysis that<br />
focused on evaluating the feasibility of the program in the North Central Texas region.<br />
R. W. Beck also researched best management practices that could be employed by the<br />
construction <strong>and</strong> recycling industries, as well as a review of programs that local<br />
governments could implement to foster C&D waste minimization programs <strong>and</strong><br />
practices.<br />
Based on the results of this analysis, R. W. Beck assisted NCTCOG staff <strong>and</strong> members<br />
of the TTR Subcommittee to develop a strategic approach for C&D waste<br />
minimization efforts in the North Central Texas region. The goal of the strategic<br />
approach is to determine specific roles, responsibilities <strong>and</strong> timelines for the<br />
NCTCOG, local governments, <strong>and</strong> the construction <strong>and</strong> recycling industry to<br />
coordinate implementing C&D waste minimization efforts.<br />
1.3 Case Study/Cost Benefit Analysis<br />
With significant input from NCTCOG staff <strong>and</strong> the TTR subcommittee, R. W. Beck<br />
selected the five case studies based on concepts that are innovative <strong>and</strong> could provide<br />
an opportunity for meaningful future C&D waste minimization results in the future<br />
within the North Central Texas region. For each case study, R. W. Beck developed a<br />
cost benefit analysis, key findings <strong>and</strong> recommendations. The five case studies<br />
include:<br />
• Green Building<br />
• C&D MRF<br />
• On-Site Grinding<br />
• LEED Deconstruction<br />
1-2 R. W. Beck 9/14/05
Executive Summary<br />
• LEED Renovation<br />
Included below is a brief description of each case study, <strong>and</strong> the key findings <strong>and</strong><br />
recommendations.<br />
1.3.1 Green Building<br />
Green building is an environmentally responsible approach to l<strong>and</strong> development <strong>and</strong><br />
housing construction in an effort to conserve natural resources. A green building<br />
approach can involve virtually every aspect of design <strong>and</strong> construction. For the case<br />
study, R. W. Beck focused on the C&D waste minimization aspect of green building.<br />
The case study/cost benefit analysis focused on two programs located in Texas, the<br />
cities of Austin <strong>and</strong> Frisco. For each program, R. W. Beck interviewed City staff to<br />
underst<strong>and</strong> the various components of their program. Based on our analysis of these<br />
programs, a series of key findings <strong>and</strong> recommendations for green building programs<br />
was developed. Section 2 includes the complete case study.<br />
Key Findings <strong>and</strong> Recommendations<br />
1. Based on existing green building programs, waste minimization is often one of<br />
several key components with others being energy efficiency, water conservation,<br />
sustainable site planning <strong>and</strong> indoor environmental quality.<br />
2. Changes within the building industry may occur gradually over time; provided<br />
builders have an assurance that green building will have a positive impact on<br />
profitability <strong>and</strong> market share.<br />
3. Communities in the United States, including North Central Texas, already have<br />
energy conservation programs through their electric utility. Efforts could be made<br />
with the electric utilities to make their programs more comprehensive by<br />
addressing additional green building approaches that would include waste<br />
minimization.<br />
4. When implemented during the preliminary stages of a construction project, green<br />
building programs can be implemented with minimal or no cost increases. In fact,<br />
over the life-cycle of a building, green building can provide an opportunity to<br />
reduce costs. Cost increases will occur when new technologies are used or poor<br />
planning during the design stages takes place, from 0-2 percent to up to 8-10<br />
percent.<br />
5. Providing builders with multiple options to implement waste minimization efforts<br />
provides the best opportunity for success. Green building programs can assign<br />
varying points within a rating system to provide incentives for builders to achieve<br />
greater waste minimization results. A waste management plan can be an effective<br />
tool for evaluating opportunities for waste minimization. The management plan<br />
should be a specific part of the rating system.<br />
6. In order to recycle significant quantities of material from construction sites,<br />
supporting infrastructure such as on-site grinders <strong>and</strong> C&D MRFs ideally need to<br />
be in place.<br />
9/14/05 R. W. Beck 1-3
Section 1<br />
7. Given that C&D recycling infrastructure is still developing in the North Central<br />
Texas region, green building programs should identify multiple, voluntary<br />
opportunities to achieve waste minimization within a rating system.<br />
8. Since there are approximately 20 to 30 established green building programs across<br />
the country, communities developing new programs can research these other<br />
programs concerning the best approaches to developing <strong>and</strong> implementing a<br />
program.<br />
9. To achieve cost efficiencies in green building, careful planning during the design<br />
phase of the project as well as marketing to consumers must be in place during the<br />
initiation of the project.<br />
10. While individual communities can develop successful green building programs,<br />
consideration should be given to the development of regional (i.e. NCTCOG) or<br />
sub-regional (i.e. multiple cities in a common geographic area) green building<br />
programs in the North Central Texas region. A regional program could provide<br />
economies of scale to more efficiently fund public awareness <strong>and</strong> technical<br />
assistance needs.<br />
11. End markets for materials as well as affordable recycled building materials should<br />
be established or available to decrease the cost of using these materials for<br />
builders.<br />
12. There is an opportunity for green building to have a greater presence in the North<br />
Central Texas region in the future. However, to achieve this change a major shift<br />
must occur in how builders <strong>and</strong> consumers perceive green building. In order for<br />
change to occur, a builder will need to incorporate green building into their<br />
business model, which could influence consumers <strong>and</strong> force competitors to adjust<br />
accordingly.<br />
1.3.2 C&D MRF<br />
A C&D Materials Recovery Facility (MRF) is a processing center that accepts mixed<br />
C&D waste, <strong>and</strong> then sorts it by material type. The concept is similar to MRFs that<br />
process recyclable material from the MSW stream. While several C&D MRFs exist in<br />
the U. S., none are in Texas. R. W. Beck evaluated the feasibility of a C&D MRF<br />
based on data from the region (e.g. l<strong>and</strong>fill tipping fees, waste flow) <strong>and</strong> fiscally<br />
conservative assumptions. Based on our analysis, a series of key findings <strong>and</strong><br />
recommendations for a C&D MRF was developed. Section 3 includes the complete<br />
case study.<br />
Key Findings <strong>and</strong> Recommendations<br />
1. Based on the results of the cost benefit analysis included in this section,<br />
preliminary findings indicate that a C&D MRF would be feasible in the North<br />
Central Texas region. However, this analysis should be considered preliminary as<br />
several key assumptions were made regarding the quantity <strong>and</strong> composition of inbound<br />
materials, end markets, facility size, equipment <strong>and</strong> location.<br />
1-4 R. W. Beck 9/14/05
Executive Summary<br />
2. NCTCOG should consider a more detailed examination of the feasibility of<br />
locating a C&D MRF in the region. The conduct of this analysis should focus on<br />
evaluating the quantity <strong>and</strong> composition of materials, identifying a potential<br />
facility location, estimating facility size <strong>and</strong> processing equipment, <strong>and</strong> identifying<br />
end markets for processed materials.<br />
3. Although the markets exist for materials from a C&D MRF, C&D waste<br />
minimization efforts is relatively new to the North Central Texas region. Any<br />
local government or other entity should complete a more thorough analysis of the<br />
market before deciding to implement a C&D MRF. The potential operator should<br />
develop confidence that haulers will bring mixed C&D debris to the facility <strong>and</strong><br />
that there would be buyers for the sorted material. As mentioned earlier, markets<br />
can vary by region <strong>and</strong> what can be sold in one area may have to be given away in<br />
another.<br />
4. As discussed in Section 3.2.1, it is important to locate a C&D MRF as close to the<br />
sources of C&D debris as possible. Combined with competitive tipping fees, this<br />
will increase the incentive for haulers to choose the C&D MRF over other<br />
alternatives. As noted in Table 3-1, it is estimated that only 8 percent of total<br />
C&D generated is from new construction. Although evidence of new residential<br />
construction is easily noticeable, R. W. Beck recommends that all sources of C&D<br />
be considered when doing an analysis of C&D generation.<br />
5. In 2003, Dallas, Ellis, Johnson, Kaufman, <strong>and</strong> Tarrant Counties retained<br />
R. W. Beck to conduct a Metroplex Area Sub-Regional Solid <strong>Waste</strong> Study<br />
(Study). This study analyzed the projected l<strong>and</strong>fill capacity in this five-county<br />
region. One of the conclusions of this study was that the five-county sub-region<br />
faces a potential long-term l<strong>and</strong>fill capacity shortage. To address this shortage, the<br />
most likely scenarios include increased l<strong>and</strong>fill tipping fees or the construction of<br />
new l<strong>and</strong>fills. With the continued population growth of the sub-region, these new<br />
l<strong>and</strong>fills would likely have to be located further away from the developing areas,<br />
thus increasing the transportation costs to <strong>and</strong> from the l<strong>and</strong>fills. In either case, the<br />
cost to dispose of C&D debris would increase, thus improving the feasibility of a<br />
C&D MRF in the North Central Texas region.<br />
6. Co-location of the C&D MRF with another permitted MSW facility can provide<br />
synergies that will help reduce the incremental cost of a C&D MRF. If the C&D<br />
MRF is co-located with another MSW facility, the costs associated with the scale<br />
house, support building, l<strong>and</strong>, labor, <strong>and</strong> possibly some rolling stock may all be<br />
reduced or eliminated. For comparison purposes, R. W. Beck assumed that the<br />
C&D MRF could be co-located with a l<strong>and</strong>fill in the tri-county area of Collin,<br />
Dallas, or Denton Counties. Table 3-9 provides the cost per ton if the scale house,<br />
support building, <strong>and</strong> l<strong>and</strong> costs are all eliminated. R. W. Beck also assumed that<br />
would be some overlap in labor <strong>and</strong> rolling stock <strong>and</strong> reduced some the associated<br />
expenses.<br />
9/14/05 R. W. Beck 1-5
Section 1<br />
Table 1-9<br />
Tipping Fees with Co-Located Facility<br />
Facility<br />
Cost per Ton<br />
C&D MRF $17.14 - $22.36<br />
Weighted Average L<strong>and</strong>fill Disposal $19.83<br />
An additional benefit, which is not reflected in the MRF costs listed in Table 3-9,<br />
is that if the facilities are co-located, the MRF could dispose of residual at the<br />
l<strong>and</strong>fill at a reduced rate <strong>and</strong> reduced transfer costs.<br />
Lastly, locating a C&D MRF at a currently permitted MSW facility will reduce the<br />
permitting costs associated with the facility since a separate MSW permit is not<br />
required by TCEQ when the facilities are co-located.<br />
7. The NCTCOG <strong>and</strong> the communities within the region should support policies,<br />
regulations or legislation that will increase the requirements for recycling C&D<br />
debris. If contractors have incentives or are required to divert a certain level of<br />
C&D debris from construction <strong>and</strong> demolition projects, then there would be a<br />
greater dem<strong>and</strong> for C&D waste minimization options.<br />
8. The NCTCOG <strong>and</strong> the communities within the region should also support other<br />
C&D waste minimization efforts. Although this may create some level of<br />
competition for the C&D MRF, increased awareness of C&D waste minimization<br />
should benefit all C&D waste minimization efforts.<br />
1.3.3 On-Site Grinding<br />
On-site grinding is the practice of grinding <strong>and</strong> crushing building materials <strong>and</strong><br />
depositing them onsite as a soil amendment or for use in erosion control. From a<br />
waste minimization perspective, on-site grinding can effectively divert C&D waste<br />
generated from new home construction.<br />
This case study examined on-site grinding for custom <strong>and</strong> production home builders in<br />
the North Central Texas region, based on scenarios where a builder would (1) own <strong>and</strong><br />
operate an on-site grinder; <strong>and</strong> (2) contract with another company for on-site grinding<br />
services. Based on our analysis, a series of key findings <strong>and</strong> recommendations for a<br />
on-site grinding was developed. Section 4 includes the complete case study.<br />
Key Findings <strong>and</strong> Recommendations<br />
1. Contracting on-site grinding services may be a cost-effective alternative compared<br />
to traditional waste disposal for production home builders in the North Central<br />
Texas region. From a financial perspective, the cost-effectiveness of this may<br />
depend on cost of the service <strong>and</strong> implementation of cost-avoidance strategies.<br />
2. Based on R. W. Beck’s analysis of on-site grinding for production homes, a<br />
superintendent who chooses to subcontract on-site grinding services may see a<br />
reduction in waste related costs of approximately $180 per home.<br />
1-6 R. W. Beck 9/14/05
Executive Summary<br />
3. Using on-site grinding as a means of C&D waste reduction for custom homes is<br />
currently not a cost-effective method of reducing waste <strong>and</strong> may cost<br />
approximately $1,200 to $1,800 more per home than disposal.<br />
4. The indirect benefits of on-site grinding may have a substantial impact on the<br />
likelihood that home builders will use on-site grinding as a means of waste<br />
disposal in the future.<br />
5. Production home builders subcontracting on-site grinding services is the most<br />
economically feasible option for this solid waste management method.<br />
6. With the widespread use of waste minimization strategies such as on-site grinding,<br />
the long-term benefits of diverting C&D waste from l<strong>and</strong>fills in the North Central<br />
Texas region will continue to benefit the North Central Texas region.<br />
1.3.4 LEED Deconstruction<br />
Deconstruction is the selective dismantlement or removal of materials from buildings<br />
for reuse or recycling. 3 As an alternative to demolition, deconstruction can serve as an<br />
effective way of reducing a significant amount of waste from l<strong>and</strong>fills. The LEED<br />
rating system is a scale on which projects are judged based on their environmental<br />
friendliness. A component of LEED is C&D waste minimization.<br />
The case study examined the partial deconstruction of the Hensley Field Operations<br />
Site under the direction of the City of Dallas. R. W. Beck visited the site on several<br />
occasions throughout the process <strong>and</strong> collected tonnage <strong>and</strong> cost data from the<br />
contracting firm. Based on our analysis, a series of key findings <strong>and</strong> recommendations<br />
for a deconstruction was developed. Section 5 includes the complete case study.<br />
Key Findings <strong>and</strong> Recommendations<br />
1. The deconstruction of commercial buildings in the North Central Texas region is<br />
feasible for implementation based on the economic <strong>and</strong> indirect benefits achieved<br />
through this process.<br />
2. R. W. Beck’s recommends based on its initial analysis of the C&D waste stream<br />
<strong>and</strong> deconstruction in the North Central Texas region, developing infrastructure<br />
<strong>and</strong> a market for C&D materials is imperative in the region for the continued<br />
expansion of C&D waste minimization efforts. To accomplish this, the region<br />
should pursue the development of a C&D MRF. Prior to establishing a C&D<br />
MRF in the region, a more thorough <strong>and</strong> detailed analysis should be conducted.<br />
The conduct of this analysis should focus on identifying the location, size <strong>and</strong><br />
market for the C&D MRF.<br />
3. From an operational perspective, deconstruction may require additional training of<br />
low-skilled <strong>and</strong> semi-skilled labor to ensure that the maximum amount of C&D<br />
waste is diverted from the waste stream.<br />
3<br />
“A Report on the Feasibility of Deconstruction.” U.S. Department of Housing <strong>and</strong> Urban<br />
Development – Office of Policy Development <strong>and</strong> Research.<br />
9/14/05 R. W. Beck 1-7
Section 1<br />
4. The establishment of a waste management plan helps to ensure that contractors<br />
have a set of established goals <strong>and</strong> guidelines which they can follow throughout<br />
the course of the deconstruction process. In conjunction with LEED building<br />
m<strong>and</strong>ates, the institution of a waste management planning policy prior to the<br />
construction or deconstruction process may improve future projects the City of<br />
Dallas undertakes.<br />
5. Deconstruction has many indirect benefits, including risk mitigation, waste<br />
reduction <strong>and</strong> jobsite cleanliness, which contribute to its feasibility for<br />
implementation on a greater scale in the North Central Texas region.<br />
1.3.5 LEED Renovation<br />
Renovation is generally defined as the modification or rehabilitation of the interior<br />
<strong>and</strong>/or exterior of an existing structure. Green building practices may be applied to<br />
renovation activities through recycling, reusing or recovering the various building<br />
materials generated during a renovation project. This process can serve as an effective<br />
way of reducing the amount of recoverable materials from entering the waste stream.<br />
The LEED rating system is a scale on which projects are judged based on their<br />
environmental friendliness. A component of LEED is C&D waste minimization.<br />
The case study examined the renovation phase of the Hensley Field Operations Site<br />
under the direction of the City of Dallas. The case study focused solely on the<br />
reconstruction of the interior of the building. R. W. Beck conducted site visits <strong>and</strong><br />
interviews with key staff to collect all the tonnage <strong>and</strong> tonnage data. Based on our<br />
analysis, a series of key findings <strong>and</strong> recommendations for a renovation was<br />
developed. Section 6 includes the complete case study.<br />
Key Findings <strong>and</strong> Recommendations<br />
1. On a cost per ton basis, the labor <strong>and</strong> disposal costs associated with waste<br />
minimization activities is approximately $79. The $79 per ton includes labor <strong>and</strong><br />
disposal associated with the removal <strong>and</strong> processing of waste. The cost per ton is<br />
competitive with the $65 per ton rate for the traditional method of renovation<br />
2. Labor costs for LEED certified projects may increase compared to traditional<br />
renovation projects, however these costs can be offset by avoiding tipping fees at<br />
the l<strong>and</strong>fill <strong>and</strong> the sale of recoverable materials.<br />
3. Revenue generated from the sale of recyclable material is significantly lower in<br />
Phase II of the project since much of the material generated is considered<br />
packaging or excess material. The economic benefit in LEED renovations is the<br />
cost avoidance associated with tipping fees.<br />
4. Based on input provided by HWH <strong>and</strong> Mart, the overall project time associated<br />
with the completion of Phase II was not affected significantly by the waste<br />
minimization strategies required by the City of Dallas.<br />
5. Through the use of source separating techniques, renovation projects have the<br />
ability to divert a significant amount of the project’s total waste from the l<strong>and</strong>fill.<br />
In Phase II of the Hensley Field Project, HWH <strong>and</strong> Mart was able to divert nearly<br />
75 percent of the total waste by weight.<br />
1-8 R. W. Beck 9/14/05
Executive Summary<br />
6. In projects seeking LEED accreditation, provisions in subcontractor’s legal<br />
agreements should include clauses designating that wastes generated on-site<br />
should be recycled or reused on-site. This would provide general contractors with<br />
more control of subcontractor’s disposal methods.<br />
7. General contractors should educate their subcontractors on C&D waste<br />
minimization strategies prior to beginning work on a LEED renovation project.<br />
8. R. W. Beck’s recommendation based on its initial analysis of the C&D waste<br />
stream <strong>and</strong> construction projects in the North Central Texas region, developing<br />
infrastructure <strong>and</strong> a market for C&D materials is imperative in the region for the<br />
continued expansion of C&D waste minimization efforts. To accomplish this, the<br />
region should pursue the development of a C&D MRF. Prior to establishing a<br />
C&D MRF in the region, a more thorough <strong>and</strong> detailed analysis should be<br />
conducted. The conduct of this analysis should focus on identifying the location,<br />
size <strong>and</strong> market for the C&D MRF.<br />
9. R. W. Beck would like to stress that Phase II of the Hensley Field Project was<br />
solely focused on the renovation of the building. All deconstruction of the interior<br />
of the building was accomplished as a part of Phase I. This case study may not<br />
completely compare with other renovation or complete demolition projects, since<br />
they may encompass tasks outside the scope of this project. R. W. Beck<br />
recommends that a contractor or a city use this case study as a planning tool <strong>and</strong><br />
each project must be assessed on a case-by-case basis.<br />
1.4 Elements of Successful <strong>Waste</strong> <strong>Minimization</strong><br />
Strategies<br />
Based on the key findings <strong>and</strong> recommendations included in the case study/cost<br />
benefit analysis, R. W. Beck evaluated the various key components of successful C&D<br />
waste minimization programs or practices. This phase of the study describes feasible<br />
strategies that can be implemented by both the public <strong>and</strong> private sector.<br />
In addition, R. W. Beck researched legal issues that affect C&D waste minimization as<br />
well as funding sources available to the public <strong>and</strong> private sector. This was included<br />
in the study as a tool <strong>and</strong> resource to serve both the public <strong>and</strong> private sector.<br />
1.4.1 Best Management Practices<br />
Participation in C&D waste minimization activities within the construction <strong>and</strong><br />
recycling industry is fundamentally necessary to achieve success. The best<br />
management practices, which are included in Section 7, focus on providing the<br />
construction <strong>and</strong> recycling industry with the tools, resources <strong>and</strong> information to<br />
successfully implement C&D waste minimization strategies.<br />
Based on field <strong>and</strong> literature research, R. W. Beck identified C&D waste minimization<br />
strategies that can be cost-effectively employed in a variety of manners for the three<br />
major areas of construction: new construction, deconstruction <strong>and</strong> renovation projects.<br />
9/14/05 R. W. Beck 1-9
Section 1<br />
In addition, this section focuses on efforts that can provide more efficient building<br />
practices. These include:<br />
• <strong>Waste</strong> management planning<br />
• On-site grinding <strong>and</strong> crushing<br />
• Materials collection methods<br />
• Material hauling <strong>and</strong> recovery<br />
• Alternative erosion control measures<br />
This section concludes with a review of several technical resources available to the<br />
construction <strong>and</strong> recycling industries. These resources include governmental technical<br />
assistance programs, internet websites <strong>and</strong> industry associations <strong>and</strong> organizations.<br />
1.4.2 Public Sector Initiatives<br />
In conjunction with participation from the private sector, local governments have the<br />
ability to foster increased involvement in C&D waste minimization activities. R. W.<br />
Beck has provided a number of options that the public sector can incorporate into their<br />
community plan in Section 8. This includes:<br />
• Green Building<br />
• LEED Rating System<br />
• <strong>Waste</strong> Management Planning <strong>and</strong> Reporting<br />
• Reuse Facility Program<br />
The discussion of the practical application of public sector incentives <strong>and</strong> ordinances<br />
provides local governments with examples of programs <strong>and</strong> initiatives developed in<br />
Texas <strong>and</strong> around the nation. These programs, ordinances <strong>and</strong> incentives for<br />
participation include:<br />
• Rebates for Contractors<br />
• Government Grants for the Private Sector<br />
• Contractor Education Programs<br />
• Fast Track Permitting<br />
• First Choice Programs<br />
• Deposit Requirements<br />
• Franchise Fees for C&D <strong>Waste</strong> Disposed at L<strong>and</strong>fills<br />
• Fines <strong>and</strong> Penalties<br />
It is important to note that some of the topics discussed may not be appropriate for all<br />
communities. However, they have been included to provide local governments with a<br />
comprehensive of a list of possible options.<br />
1-10 R. W. Beck 9/14/05
Executive Summary<br />
1.4.3 Legal Summary<br />
As local governments <strong>and</strong> the private sector consider C&D waste minimization<br />
strategies, it is necessary to underst<strong>and</strong> the governing laws. R. W. Beck has<br />
researched various state laws regulating recyclers, local government programs <strong>and</strong><br />
construction <strong>and</strong> recycling firms. Issues discussed in Section 9 include temporary<br />
crushing <strong>and</strong> grinding, air quality, C&D recyclers, <strong>and</strong> relevant green building<br />
legislation.<br />
1.4.4 Funding Mechanisms<br />
Like many new <strong>and</strong> emerging fields within the solid waste industry, implementing<br />
C&D waste minimization programs <strong>and</strong> activities can benefit from additional shortterm<br />
funding. This funding may come through a grant from a foundation or a lowinterest<br />
loan. There are several foundations <strong>and</strong> organizations throughout Texas <strong>and</strong><br />
the nation that could provide funding to C&D waste minimization efforts. Many of<br />
these programs are described in Section 10.<br />
1.5 Strategic Approach<br />
Throughout this study, R. W. Beck provides specific information regarding C&D<br />
waste minimization strategies that can be implemented in the North Central Texas<br />
region. C&D waste minimization represents a relatively new focus for the North<br />
Central Texas region. Therefore, effectively implementing these strategies requires a<br />
strategic approach to implementing both the programs <strong>and</strong> the public awareness<br />
campaign.<br />
To assist in implementing C&D waste minimization activities through the region, R.<br />
W. Beck worked with NCTCOG staff <strong>and</strong> members of the TTR Subcommittee to<br />
develop a strategic planning approach for regional <strong>and</strong> local governments <strong>and</strong> the<br />
construction <strong>and</strong> recycling industry. In addition, R. W. Beck has developed a fiveyear<br />
action plan for use in facilitating the strategic approach.<br />
1.5.1 Regional Government<br />
NCTCOG as the regional association of local governments should take a lead role in<br />
implementing the strategic approach for waste minimization programs <strong>and</strong> the public<br />
awareness campaign. Additional roles <strong>and</strong> responsibilities include:<br />
• Become the regional coordinator for C&D waste minimization strategies.<br />
• Establish a subcommittee for coordination of C&D waste minimization programs<br />
<strong>and</strong> public awareness campaigns.<br />
• Further Investigate the Feasibility of a C&D MRF in the North Central Texas<br />
region.<br />
• Provide outreach <strong>and</strong> technical assistance activities for local governments.<br />
• Develop a regional public awareness campaign.<br />
9/14/05 R. W. Beck 1-11
Section 1<br />
• Provide grant assistance to local governments for development of waste<br />
minimization programs.<br />
• Develop a website that promotes C&D waste minimization efforts in the North<br />
Central Texas region.<br />
• Develop <strong>and</strong> implement regional green building program.<br />
1.5.2 Local Governments<br />
Local governments who have an interest in implementing waste minimization<br />
programs in their community should participate in all aspects of the regional C&D<br />
waste minimization efforts. The roles of the local government should include:<br />
• Participate in NCTCOG waste minimization subcommittee, if established.<br />
• Develop methods for increasing participation from the recycling <strong>and</strong> construction<br />
industries.<br />
• Work with NCTCOG in developing <strong>and</strong> distributing public awareness materials<br />
focused on the recycling <strong>and</strong> construction industries.<br />
• Work with NCTCOG in developing <strong>and</strong> distributing public awareness materials<br />
focused on the consumers.<br />
1.5.3 <strong>Construction</strong> <strong>and</strong> Recycling Industry<br />
In order to implement waste minimization strategies, builders will need to “buy into”<br />
the concept that these strategies will benefit them. It is imperative that the<br />
construction industry underst<strong>and</strong> that their participation in waste minimization efforts<br />
will drive the success of the programs. Some of the roles <strong>and</strong> responsibilities of the<br />
recycling <strong>and</strong> construction industry include:<br />
• Participate in NCTCOG waste minimization subcommittee, if established.<br />
• Utilize Builders’ Associations as primary resource for construction industry.<br />
• <strong>Construction</strong> industry needs to recognize the value of <strong>and</strong> begin the<br />
implementation of waste minimization strategies.<br />
• Recycling industry must be proactive in marketing services.<br />
• Incorporate the benefits of waste minimization strategies in marketing campaigns.<br />
1-12 R. W. Beck 9/14/05
Section 2<br />
Green Building Case Study<br />
2.1 General Description<br />
Green building is an environmentally responsible approach to l<strong>and</strong> development <strong>and</strong><br />
housing construction in an effort to conserve natural resources. A green building<br />
approach can involve virtually every aspect of design <strong>and</strong> construction. The following<br />
summarizes approaches that are typically included in green building:<br />
• <strong>Waste</strong> minimization during construction <strong>and</strong> throughout the life of the home.<br />
• Selection of materials based on recyclability, durability <strong>and</strong> the amount of energy<br />
used to create the material.<br />
• Sustainable site planning.<br />
• Safeguarding water <strong>and</strong> water conservation.<br />
• Energy efficiency.<br />
• Indoor environmental quality.<br />
Green building programs are usually administered by a local/regional government,<br />
local utilities <strong>and</strong>/or a home builders’ association. Communities with green building<br />
programs are typically responsible for developing evaluation criteria <strong>and</strong> certifying<br />
whether a building meets the criteria. Many green building efforts occur based on<br />
voluntary programs developed to encourage the use of green building practices in the<br />
construction industry. Denver, Colorado <strong>and</strong> Austin, Texas are often sited as having<br />
the largest <strong>and</strong> most established green building programs in the United States. Some<br />
cities, such as Frisco, Texas <strong>and</strong> Boulder, Colorado, have m<strong>and</strong>atory programs that<br />
require builders to comply with their green building programs in order to obtain<br />
building permits.<br />
Today, there are 20 to 30 established green building programs across the country;<br />
however, more cities are developing green building programs on a regular basis.<br />
Nationwide, there were 18,887 homes built to local green building program guidelines<br />
from 1990 - 2001. In 2002 alone, there were 13,224 green homes built. It appears that<br />
the number of new green building homes will increase going forward given recent<br />
increases in the number of newly established programs across the United States.<br />
2.2 Implementation<br />
R. W. Beck focused its implementation research on the two green building programs<br />
in place in Texas, the cities of Austin <strong>and</strong> Frisco. R. W. Beck researched two green<br />
9/14/05
Section 2<br />
building case studies in an effort to provide different approaches to developing <strong>and</strong><br />
implementing a program. As a part of this research, R. W. Beck conducted a literature<br />
review as well as conducted interviews with City staff <strong>and</strong> industry experts. The<br />
primary difference between the two case studies is based on the Austin program being<br />
voluntary <strong>and</strong> the Frisco program being m<strong>and</strong>atory.<br />
2.2.1 City of Austin<br />
The City of Austin, through its electric utility (Austin Energy), developed the first<br />
green building program in the United States in 1990. Austin Energy originally piloted<br />
this program in order to promote energy conservation. The initial idea was to work<br />
with builders to identify <strong>and</strong> develop opportunities to improve energy code<br />
compliance. Based on the success of this effort, Austin Energy exp<strong>and</strong>ed the program<br />
to include other factors such as water conservation, waste management, site<br />
development <strong>and</strong> impact on the community. While the program is primarily<br />
voluntary, it is required in the downtown district <strong>and</strong> for affordable housing projects. 1<br />
2.2.1.1 Program Requirements<br />
Austin Energy has a five-level certification system, ranging from one to five stars. To<br />
determine the level of certification, Austin Energy uses a comprehensive, weighted<br />
checklist. All buildings must meet certain m<strong>and</strong>atory requirements, as well as attain<br />
points from specific requirements in categories that include energy, materials, water<br />
<strong>and</strong> health/safety. The materials category includes waste management issues. The<br />
m<strong>and</strong>atory requirements primarily focus on energy conservation issues, but also<br />
include limited water conservation measures. A copy of the certification sheet is<br />
located in Appendix A.<br />
2.2.1.2 Solid <strong>Waste</strong> Management<br />
As discussed in the “Program Requirements” section, waste management is a<br />
component of the program’s rating system. Builders have an option of deciding which<br />
of the following waste management alternatives they would like to accomplish:<br />
• At least one 50 percent recycled-content material used.<br />
• Lumber longer than two feet is used or recycled.<br />
• Jobsite garbage is recycled according to the City of Austin Solid <strong>Waste</strong> Services<br />
guidelines including: paper, plastic bottles, glass bottles <strong>and</strong> jars, <strong>and</strong> metal cans<br />
(no paint cans, no hazardous materials).<br />
• <strong>Construction</strong> waste: the following construction waste is separated <strong>and</strong> re-used or<br />
recycled:<br />
• Stone, concrete <strong>and</strong> masonry rubble;<br />
1 Austin Energy staff stated green building is required for affordable housing projects in an effort to<br />
reduce future, long-term utility costs. Furthermore, their research has indicated that green building can<br />
occur for these projects without added costs to the four star level in their rating system (see the<br />
following section for further details concerning the rating system).<br />
2-2 R. W. Beck 9/14/05
Green Building Case Study<br />
• Metal scraps; <strong>and</strong><br />
• Corrugated cardboard.<br />
Staff from Austin Energy stated that having a waste management plan as a part of the<br />
construction process is very important, as it specifically guides how waste will be<br />
managed. Staff also stated that on-site grinders have been used successfully in the<br />
Austin area. Based on discussions with an on-site grinder subcontractor in the Austin<br />
area, some home builders were initially skeptical about using on-site grinding due to<br />
their unfamiliarity with this approach. However, since the subcontractor was able to<br />
provide their service at the same cost as disposal, the builder chose to try the on-site<br />
grinding. In addition, the builder has been very pleased with many of the<br />
consequential benefits including site maintenance <strong>and</strong> increased marketability.<br />
From a long-term perspective, Austin Energy recommends using materials that will be<br />
more durable over time, as this will eliminate or delay the need for replacement, which<br />
will increase disposal quantities. For example, masonry is preferred over siding.<br />
Also, roofs using high quality shingles are recommended.<br />
2.2.1.3 Staffing<br />
Austin Energy has a green building staff of approximately 14 full-time employees<br />
(FTEs). This staffing level is significantly higher than typical staffing levels at other<br />
green building programs in other cities. Austin Energy is able to fund <strong>and</strong> support its<br />
staffing level due to its focus on energy conservation initiatives. During interviews,<br />
Austin Energy staff recognized that the Austin Energy program has more FTEs than a<br />
typical green building program. Based on this observation, Austin Energy staff<br />
provided R. W. Beck with staffing recommendations <strong>and</strong> job descriptions for a more<br />
typical program as described in Table 2-1.<br />
Table 2-1<br />
Green Building Program Staffing Recommendations<br />
Title<br />
Recommended<br />
Staffing Level<br />
Job Duties/Description<br />
Program Administration 1-2 FTE Oversees program management <strong>and</strong> program<br />
development<br />
Administrative Staff 1 FTE Markets to building industry <strong>and</strong> consumers<br />
Monitoring Staff 1-2 FTE Provides technical assistance to builders as<br />
well as addresses any compliance issues in<br />
the field 2<br />
2 Austin Energy staff also mentioned another option for programs that do not have the ability to fund<br />
positions for monitoring <strong>and</strong> conducting plan reviews. This option would be to have builders retain<br />
independent inspectors during the building process to review compliance.<br />
9/14/05 R. W. Beck 2-3
Section 2<br />
2.2.1.4 Public Awareness<br />
Austin Energy focuses its public awareness efforts on the building industry <strong>and</strong><br />
consumers. The following summarizes the focus of Austin Energy’s public awareness<br />
efforts for these sectors:<br />
• Builders<br />
• Green building efforts can provide an advantage compared to other builders<br />
who are not implementing green building techniques.<br />
• Green building represents a better approach to construction.<br />
• Green building homes are healthier <strong>and</strong> better for customers.<br />
• Consumers<br />
• Green building homes reduce electric <strong>and</strong> water utility expenses.<br />
• Green building homes are healthier <strong>and</strong> safer.<br />
• Green building homes provide an improved quality of life.<br />
Austin Energy implements its public awareness efforts on a continual basis. Elements<br />
of its public awareness campaign include the following:<br />
• Internet site (www.ci.austin.tx.us/greenbuilder/mighome.htm);<br />
• Articles for local newspapers, industry publications <strong>and</strong> real estate publications;<br />
• Advertisements via television <strong>and</strong> radio;<br />
• Public speaking at industry events (home builders’ associations, real estate<br />
associations) <strong>and</strong> community events; <strong>and</strong><br />
• Telephone calls to answer questions from builders <strong>and</strong> consumers.<br />
2.2.1.5 Training <strong>and</strong> Technical Assistance<br />
Austin Energy offers multiple training <strong>and</strong> technical assistance to the building<br />
industry. Austin Energy will conduct formal seminars for members on a monthly<br />
basis that focus on specific topics. Austin Energy is proactive in attracting green<br />
building conferences to the city, which provides opportunities for builders to access<br />
valuable information in a cost-effective manner.<br />
One-on-one technical assistance to members is a key component of the program.<br />
Austin Energy staff will meet directly with builders <strong>and</strong> frequently conducts research<br />
for its members. Builders have stated to Austin Energy staff that this is a valuable<br />
resource that they feel comfortable using on a regular basis.<br />
2.2.2 City of Frisco, Texas<br />
The City of Frisco is one of the fastest growing areas in North Central Texas. The<br />
current population of the city is approximately 73,000, with expectations to reach<br />
build-out capacity of 275,000 people in approximately 20 years. With its rapid growth<br />
2-4 R. W. Beck 9/14/05
Green Building Case Study<br />
occurring over a relatively short period of time, the city decided to adopt a green<br />
building ordinance in 2001.<br />
2.2.2.1 Program Requirements<br />
The City of Frisco green building program (Frisco green building program) is a<br />
m<strong>and</strong>atory program for all single-family residential buildings platted after May 2001.<br />
All new single-family construction must meet minimum st<strong>and</strong>ards for energy<br />
efficiency, water conservation, indoor air quality <strong>and</strong> waste recycling. A complete list<br />
of the city’s minimum st<strong>and</strong>ards is included in Appendix A.<br />
2.2.2.2 Solid <strong>Waste</strong> Management<br />
The city’s ordinance established the following specific minimum st<strong>and</strong>ards for waste<br />
recycling:<br />
• <strong>Construction</strong> waste (brick <strong>and</strong> wood) hauled from the building site by the builder<br />
shall be taken to a site or facility legally empowered to accept it for recycling as<br />
approved by the County <strong>and</strong> State in which the facility is located.<br />
• <strong>Construction</strong> waste minimization / reuse plan written <strong>and</strong> followed by builder.<br />
• Donate unwanted building materials to a non-profit building organization.<br />
• Provide a built-in recycling center option with two or more bins (minimum of 5<br />
gallons each) for homebuyers.<br />
• Provide a composting system option installed in yard for homebuyer<br />
(manufactured or made at site).<br />
Since adopting this ordinance, the city has encountered several challenges<br />
implementing sections of the ordinance that require construction waste hauled from<br />
the building site to be taken to a facility that has been legally approved to recycle the<br />
material. It has especially been challenging to identify a company that can properly<br />
process the material for recycling. For example, one company started to provide this<br />
service, but eventually discontinued this service because it faced problems marketing<br />
processed materials due to questions about meeting needed specifications. Since then,<br />
the city has issued a request for proposals to retain a company that will collect <strong>and</strong><br />
process construction waste from new construction sites in the city. The city has<br />
identified three companies that are in the process of either providing this service or<br />
developing a facility that can process these construction waste materials. Once the<br />
city can get a better sense of how these companies can meet the city’s needs, the City<br />
of Frisco hopes to provide on-site collection services for the recycling of construction<br />
waste.<br />
2.2.2.3 Staffing<br />
The city staffs the green building program with employees from the planning <strong>and</strong><br />
environmental services (which includes solid waste) departments. Three employees in<br />
the planning department spend a portion of their time working on the green building<br />
program, in addition to their general planning work. The manager of environmental<br />
9/14/05 R. W. Beck 2-5
Section 2<br />
services also allocates a portion of time toward the green building program. Efforts<br />
completed by city staff focus on builder’s compliance <strong>and</strong> marketing of the green<br />
building program. Staff stated that they cannot spend a sufficient amount of time<br />
working on the green building program due to multiple dem<strong>and</strong>s on their time.<br />
2.2.2.4 Public Awareness<br />
The city’s public awareness efforts have been in the developmental stages <strong>and</strong> can be<br />
characterized as relatively informal to date. The city recently created a Builder’s Task<br />
Force comprised of builders in Frisco to discuss important green building issues. The<br />
city expects to use the task force as a forum to conduct workshops for builders<br />
concerning green building. The city has primarily relied on “word of mouth” to<br />
communicate the benefits <strong>and</strong> elements of the city’s green building program. The<br />
city’s website does provide information on the green building program, which is<br />
available at:<br />
http://www.ci.frisco.tx.us/developmentsvcs/greenbuilding/greenbuilding_home.htm.<br />
The city also developed a green building video, with financial assistance from the<br />
U. S. Environmental Protection Agency, Region 6 office in Dallas.<br />
2.2.2.5 Training <strong>and</strong> Technical Assistance<br />
Efforts to provide training <strong>and</strong> technical assistance have been similar to those<br />
described in the “Public Awareness” section. The city expects to provide training to<br />
builders via workshops, <strong>and</strong> uses its website to announce <strong>and</strong> reference training <strong>and</strong><br />
technical assistance opportunities. Currently, the city does not have a specific training<br />
<strong>and</strong> technical assistance program.<br />
2.3 Keys <strong>and</strong> Impediments to Success<br />
Based on research <strong>and</strong> case studies, R. W. Beck identified several keys <strong>and</strong><br />
impediments to a successful green building program. Keys to success include the<br />
following:<br />
• Providing builders with a rating system that offers a variety of options that<br />
builders can choose to complete allows for a greater degree of flexibility to apply<br />
green building to many different communities <strong>and</strong> situations.<br />
• A straight forward <strong>and</strong> clearly defined rating system can often help ensure<br />
compliance with a green building program.<br />
• Effectively communicating the benefits of a green building program is critical to<br />
obtaining buy-in from builders <strong>and</strong> consumers.<br />
• <strong>Construction</strong> management plans are a key to successful waste minimization<br />
efforts, as these plans provide a complete description of how waste will be<br />
managed throughout all phases of the construction project.<br />
• When green building is incorporated into the design phase of a project, often the<br />
costs incurred during construction do not increase significantly, if at all.<br />
2-6 R. W. Beck 9/14/05
Green Building Case Study<br />
• If a dem<strong>and</strong> for green building products <strong>and</strong> techniques exists in consumers as<br />
well as developers, green building homes will be more attractive in the open<br />
market <strong>and</strong> will become a more cost-effective way of home building.<br />
Impediments to success include the following:<br />
• A lack of infrastructure (e.g. a C&D MRF) or services (on-site grinding<br />
companies) can make it difficult for builders to achieve some waste minimization<br />
goals.<br />
• Changing the approach of the construction industry to focus more on waste<br />
minimization can be a daunting challenge.<br />
• Builders are often reluctant to try alternative building methods <strong>and</strong> materials or<br />
take the risk of implementing green building techniques, since the status quo<br />
method of home building works.<br />
• Builders typically lack the financial incentive to incorporate green building<br />
techniques into home building, since C&D disposal is relatively inexpensive in<br />
the North Central Texas region.<br />
• There is a perception among builders that the data on green building, which<br />
illustrates how green building can be implemented successfully <strong>and</strong> costeffectively,<br />
is biased.<br />
• Many builders <strong>and</strong> consumers are unaware of green building, how it can be<br />
achieved in a cost-effective manner, as well as many of the benefits of green<br />
building.<br />
2.4 Cost Benefit Analysis<br />
To evaluate the costs <strong>and</strong> benefits of a green building program, R. W. Beck considered<br />
the economic impacts on individual buildings <strong>and</strong> communities in general. To<br />
examine these economic impacts, R. W. Beck conducted research specific to this<br />
project <strong>and</strong> also conducted a literature review, since there is substantial existing<br />
research on this topic.<br />
2.4.1 Building Level<br />
During the design <strong>and</strong> construction phases, the opportunity exists to implement green<br />
building in a relatively cost-effective manner. For example, staff from Austin Energy<br />
estimated that green building houses can be built for no additional cost up to a fourstar<br />
rating (out of a five-star scale) provided that efforts are made during the initial<br />
project design stages. Austin Energy staff emphasized that a green building approach<br />
must be considered during the initial development stages in order to ensure proper<br />
planning. 3 Another example supporting the concept of cost-effective green building is<br />
3 There have been some cases where decisions have been made to develop a green building after design<br />
<strong>and</strong> construction have started. In these scenarios, costs associated with green building can be expensive<br />
due to the need to make substantial changes.<br />
9/14/05 R. W. Beck 2-7
Section 2<br />
from The Costs <strong>and</strong> Financial Benefits of Green, 4 which is considered one of the most<br />
comprehensive cost <strong>and</strong> benefit studies of green building that has ever been<br />
conducted. This report states that:<br />
While the environmental <strong>and</strong> human health benefits of green building<br />
have been widely recognized, this comprehensive report confirms that<br />
minimal increases in upfront costs of 0-2 percent to support green<br />
design will result in life cycle savings of 20 percent of total<br />
construction costs – more than ten times the initial investment.<br />
Based on subsequent discussions with industry <strong>and</strong> green building experts conducted<br />
by R. W. Beck, some green building projects may see as much as an 8-10 percent cost<br />
increase. This is often due to two primary reasons:<br />
• Green building is achieved through new technologies which are often expensive<br />
to implement, such as low-emittance (low-e) windows or photovoltaic systems. 5<br />
• The initial project planning was not completed with green building in the plans<br />
instead efforts are made during the construction phase to implement green<br />
building techniques.<br />
Specific to this project, R. W. Beck evaluated the economic feasibility of several<br />
methods that can be used to reduce the quantity of solid waste generated for disposal.<br />
On-site grinding, discussed in Section 4, represents an opportunity to achieve green<br />
building program goals that focus on waste minimization. By using an on-site grinder<br />
or an on-site grinder subcontractor, C&D waste that would typically be disposed at the<br />
l<strong>and</strong>fill may be minimized by almost 85 percent. In addition, grinded material is often<br />
returned to the soil as an amendment, erosion control around the jobsite, or fill for<br />
future driveways or walkways.<br />
Other waste minimizations efforts can be implemented in a relatively cost-effective<br />
manner. For the most part, these decisions focus on changing building practices from<br />
traditional approaches, but would not necessarily have a significant cost. These efforts<br />
can include, but are not limited to the following activities during construction:<br />
• Use of recycled content material;<br />
• More efficient use of materials;<br />
• Use of building materials that are more durable <strong>and</strong> easier to repair <strong>and</strong> maintain;<br />
• Design to generate less scrap material through dimensional planning; <strong>and</strong><br />
• Reuse of building material.<br />
There are also the following lifetime waste minimization initiatives:<br />
4 Source: Kats, Greg, Capital E. The Costs <strong>and</strong> Financial Benefits of Green Buildings: A Report to<br />
California’s<br />
Sustainable Building Task Force. October 2003.<br />
5 Low-e windows are high-efficiency windows that are intended to allow for the installation of smaller<br />
heating or cooling systems. Photovoltaic systems are a type of solar energy that are designed to<br />
produce electricity for individual buildings.<br />
2-8 R. W. Beck 9/14/05
Green Building Case Study<br />
• Development of indoor recycling program <strong>and</strong> space;<br />
• Design for deconstruction; <strong>and</strong><br />
• Design for flexibility through the use of moveable walls, raised floors, modular<br />
furniture, moveable task lighting <strong>and</strong> other reusable building components.<br />
2.4.2 Community Level<br />
While the costs associated with administering a green building program can be<br />
quantified, it is more challenging to quantify the benefits of a green building program.<br />
From a cost perspective, the costs associated with green building programs have a<br />
wide range. At the upper end, Austin Energy has an annual budget of approximately<br />
$1 million. Much of the cost associated with this program focuses on energy<br />
efficiency efforts.<br />
Based on R. W. Beck’s research, the cost for the Austin Energy program is an<br />
exception as budgets for many other programs are substantially lower. For example,<br />
costs associated with the City of Frisco’s green building program are just a part of ongoing<br />
efforts within the planning <strong>and</strong> solid waste divisions of the city. Frisco city staff<br />
estimated that their annual costs are approximately $25,000 to $30,000 annually.<br />
These costs are based on the proportional amount of time staff work on the green<br />
building program ($20,000) <strong>and</strong> public awareness efforts ($5,000 to $10,000). City<br />
staff stated that current funding levels are insufficient to adequately fund this program.<br />
The National Association of Builders’ (NAHB) publication, A Guide to Developing<br />
Green Building Programs, 6 summarizes first year budgets for several green building<br />
programs. 7 Four programs were reviewed: Kitsap County, Washington, Central New<br />
Mexico, Denver <strong>and</strong> Atlanta. Annual hard costs, which included advertising,<br />
surveys/focus groups, marketing materials <strong>and</strong> builder h<strong>and</strong>books, ranged from<br />
approximately $15,000 to $57,000. Labor associated with developing <strong>and</strong><br />
implementing the programs during the first year ranged from approximately $45,000<br />
to $98,000. 8 After funding the first year budget, programs can expect to maintain<br />
costs for advertising <strong>and</strong> marketing materials <strong>and</strong> for staff to administer the program.<br />
To offset these expenses, there are several funding methods to consider. These<br />
include a combination of general revenue <strong>and</strong> specific green building program fees.<br />
Table 2-2 describes specific green building program fees, <strong>and</strong> provides a range of<br />
typical amounts based on existing green building programs. Communities should<br />
determine specific fees based on the cost of service to operate the green building<br />
program.<br />
6 Source: National Association of Home Builder’s Research Center. A Guide to Developing Green<br />
Builder Programs. Upper Marlborro, Maryl<strong>and</strong>. February 2000.<br />
7 This guide was developed in 1999, which means that cost data is approximately five years old.<br />
R. W. Beck has not adjusted the amounts for inflation.<br />
8 With the development of A Guide to Developing Green Building Program, the opportunity exists to<br />
reduce labor costs associated with program development, since this publication includes guidance on<br />
how to develop a green building program.<br />
9/14/05 R. W. Beck 2-9
Section 2<br />
Table 2-2<br />
Funding Methods for Green Building Programs<br />
Funding Methods<br />
Fee Range<br />
Annual Fee for Builders $50 – 295 (HBA members) $250 – 750 (non-HBA members)<br />
Per Project Fee for Builders $50 – 75 (HBA members) $50 – 150 (non-HBA members)<br />
Annual Fee for Associates $250 – 295<br />
Program Partners or Sponsors $10,000 – 50,000<br />
There are multiple community benefits associated with green building programs, as<br />
follows:<br />
• Higher property values: A green building rating can translate to increases in<br />
property values.<br />
• More desirable place to live: Communities with green building programs typically<br />
place a high value on quality of life issues, which can translate into being a more<br />
desirable place to live.<br />
• Delay future capital costs: A successful green building program can delay future<br />
capital costs for utility expansions (e.g. power plants, l<strong>and</strong>fills, water treatment,<br />
etc.) based on conservation efforts.<br />
• Avoided environmental costs: <strong>Waste</strong> minimization efforts can lead to fewer<br />
hazardous substances <strong>and</strong> greenhouse gases due to the greater use of recycled<br />
material.<br />
2.5 Key Findings <strong>and</strong> Recommendations<br />
1. Based on existing green building programs, waste minimization is often one of<br />
several key components with others being energy efficiency, water conservation,<br />
sustainable site planning <strong>and</strong> indoor environmental quality.<br />
2. Changes within the building industry may occur gradually over time; provided<br />
builders have an assurance that green building will have a positive impact on<br />
profitability <strong>and</strong> market share.<br />
3. Communities in the United States, including North Central Texas, already have<br />
energy conservation programs through their electric utility. Efforts could be made<br />
with the electric utilities to make their programs more comprehensive by<br />
addressing additional green building approaches that would include waste<br />
minimization.<br />
4. When implemented during the preliminary stages of a construction project, green<br />
building programs can be implemented with minimal or no cost increases. In fact,<br />
over the life-cycle of a building, green building can provide an opportunity to<br />
reduce costs. Cost increases will occur when new technologies are used or poor<br />
planning during the design stages takes place, from 0-2 percent to up to 8-10<br />
percent.<br />
2-10 R. W. Beck 9/14/05
Green Building Case Study<br />
5. Providing builders with multiple options to implement waste minimization efforts<br />
provides the best opportunity for success. Green building programs can assign<br />
varying points within a rating system to provide incentives for builders to achieve<br />
greater waste minimization results. A waste management plan can be an effective<br />
tool for evaluating opportunities for waste minimization. The management plan<br />
should be a specific part of the rating system.<br />
6. In order to recycle significant quantities of material from construction sites,<br />
supporting infrastructure such as on-site grinders <strong>and</strong> C&D MRFs ideally need to<br />
be in place.<br />
7. Given that C&D recycling infrastructure is still developing in the North Central<br />
Texas region, green building programs should identify multiple, voluntary<br />
opportunities to achieve waste minimization within a rating system.<br />
8. Since there are approximately 20 to 30 established green building programs across<br />
the country, communities developing new programs can research these other<br />
programs concerning the best approaches to developing <strong>and</strong> implementing a<br />
program.<br />
9. To achieve cost efficiencies in green building, careful planning during the design<br />
phase of the project as well as marketing to consumers must be in place during the<br />
initiation of the project.<br />
10. While individual communities can develop successful green building programs,<br />
consideration should be given to the development of regional (i.e. NCTCOG) or<br />
sub-regional (i.e. multiple cities in a common geographic area) green building<br />
programs in the North Central Texas region. A regional program could provide<br />
economies of scale to more efficiently fund public awareness <strong>and</strong> technical<br />
assistance needs.<br />
11. End markets for materials as well as affordable recycled building materials should<br />
be established or available to decrease the cost of using these materials for<br />
builders.<br />
12. There is an opportunity for green building to have a greater presence in the North<br />
Central Texas region in the future. However, to achieve this change a major shift<br />
must occur in how builders <strong>and</strong> consumers perceive green building. In order for<br />
change to occur, a builder will need to incorporate green building into their<br />
business model, which could influence consumers <strong>and</strong> force competitors to adjust<br />
accordingly.<br />
9/14/05 R. W. Beck 2-11
Section 2<br />
(This page intentionally left blank)<br />
2-12 R. W. Beck 9/14/05
Section 3<br />
C&D Material Recovery Facility Case Study<br />
3.1 General Description<br />
Approximately 1,540,934 tons of the municipal solid waste (MSW) disposed in the<br />
North Central Texas region in fiscal year 2003 (September 1, 2002 – August 31, 2003)<br />
was classified as construction <strong>and</strong> demolition (C&D) debris, which represents 17<br />
percent of the total MSW disposed in the region. 1 Recognizing that this number may<br />
not reflect the exact amount of C&D disposed in Texas, 2 it provides a basic<br />
underst<strong>and</strong>ing of the magnitude of C&D debris that is ultimately disposed in Type I<br />
<strong>and</strong> Type IV l<strong>and</strong>fills in the NCTCOG region. C&D debris contains material such as<br />
concrete, wood, metal <strong>and</strong> cardboard that is generated from construction, demolition,<br />
<strong>and</strong> renovation projects. This material has a net economic value if it can be recovered<br />
<strong>and</strong> reused less expensively than disposed in a l<strong>and</strong>fill. Diverting this material from<br />
l<strong>and</strong>fills also extends the remaining life of l<strong>and</strong>fills in the North Central Texas region.<br />
There are several ways to reuse <strong>and</strong> recycle C&D material. One way is through the<br />
use of a material recovery facility (MRF), which is a processing center that accepts<br />
mixed C&D debris, <strong>and</strong> then sorts it by material type. The MRF operator can then sell<br />
materials with an economic value. The remaining material that has little or no value,<br />
called residual, must be l<strong>and</strong>filled or otherwise disposed or reused.<br />
3.2 Implementation<br />
While there are many options available for building <strong>and</strong> operating a C&D MRF,<br />
R. W. Beck made several assumptions for the purposes of this case study. A model<br />
facility was chosen based on limited observations of currently operating facilities<br />
across the country <strong>and</strong> other industry research. Used throughout this case study, the<br />
term “model facility” refers to the facility described below. This model facility<br />
assumes:<br />
• Average amount of material processed daily: 580 tons per day.<br />
• Operations five days a week, eight hours a day.<br />
• Resides on approximately seven acres of l<strong>and</strong>.<br />
• All processing equipment is enclosed in a 52,500 square-foot building.<br />
1 Source: Texas Commission on Environmental Quality, 2003 Survey of Texas MSW Facilities.<br />
2 The TCEQ depends on self-reporting from the l<strong>and</strong>fills for this data. L<strong>and</strong>fills may not correctly<br />
classify all C&D debris accepted at the l<strong>and</strong>fill for disposal. For instance, some debris may be<br />
classified as commercial, <strong>and</strong> vice versa.<br />
9/14/05
Section 3<br />
• Scale house with both in-going <strong>and</strong> out-going scales.<br />
• Pre-engineered 1,000 square-foot building with a break area <strong>and</strong> small office<br />
space.<br />
All MSW facilities that accept mixed material <strong>and</strong> process it for further use must be<br />
permitted or registered with the TCEQ unless the facility has a residual rate less than<br />
10 percent. R. W. Beck’s research of other facilities indicates that achieving a residual<br />
rate of 10 percent or less at a C&D MRF is difficult to achieve, thus applying for<br />
registration or a permit is a likely step in the implementation process of a C&D MRF.<br />
3.2.1 Solid <strong>Waste</strong> Management<br />
3.2.1.1 In-bound Materials<br />
A C&D MRF collects mixed C&D debris from construction, demolition, <strong>and</strong><br />
renovation projects. While in some instances loads of in-bound material will consist<br />
of one primary type of material, the typical load will be composed of a mixture of<br />
material. The purpose of a C&D MRF is to sort mixed C&D material in an efficient<br />
manner.<br />
Table 3-1 illustrates potential sources of building related C&D material. Debris from<br />
road construction is not included in this table. The information in Table 3-1 is based<br />
on a study completed by the U.S. EPA <strong>and</strong> may not represent the true character of the<br />
C&D waste stream in the North Central Texas region.<br />
Table 3-1<br />
Source of C&D Debris<br />
Source<br />
Residential Nonresidential Combined<br />
Tons<br />
(in thous<strong>and</strong>s)<br />
Percent<br />
Tons<br />
(in thous<strong>and</strong>s)<br />
Percent<br />
Tons<br />
(in thous<strong>and</strong>s)<br />
Percent<br />
<strong>Construction</strong> 6,560 11% 4,270 6% 10,830 8%<br />
Renovation 31,900 55% 28,000 36% 59,900 44%<br />
<strong>Demolition</strong> 19,700 34% 45,100 58% 64,800 48%<br />
Total 58,160 100% 77,370 100% 135,530 100%<br />
Source: U.S. Environmental Protection Agency, Characterization of Building-Related <strong>Construction</strong> <strong>and</strong> <strong>Demolition</strong> Debris in the United States<br />
The North Carolina Department of Environmental <strong>and</strong> Natural Resources conducted a<br />
study that included an estimate of the overall composition of C&D debris. The results<br />
are shown in Table 3-2. Since no waste composition data was available for the North<br />
Central Texas region, R. W. Beck used these assumptions for the C&D MRF analysis<br />
to determine the composition of the incoming C&D waste stream <strong>and</strong> the amount of<br />
material recovered at the MRF.<br />
3-2 R. W. Beck 9/14/05
C&D Material Recovery Facility Case Study<br />
Table 3-2<br />
Source of C&D Debris<br />
Material<br />
% of C&D <strong>Waste</strong> Stream<br />
(by weight)<br />
3.2.1.2 Equipment<br />
Wood 27.5%<br />
Drywall 13.4%<br />
Cardboard 2.7%<br />
Metals 8.8%<br />
Plastics 0.5%<br />
Masonry 4.8%<br />
Concrete 18.4%<br />
Roofing 12.0%<br />
Asphalt 0.1%<br />
Miscellaneous 11.8%<br />
Total 100.0%<br />
Source: North Carolina Department of Environmental <strong>and</strong> Natural<br />
Resources, <strong>Construction</strong> & <strong>Demolition</strong> Commodity Profile Markets<br />
Assessment 1998<br />
The two primary categories of equipment used at a C&D MRF include:<br />
• Processing equipment used to separate the mixed C&D material.<br />
• Heavy machinery, known as rolling stock, used to maneuver the material within<br />
the facility.<br />
Processing Equipment<br />
From a capital perspective, the processing equipment is the focus of a C&D MRF.<br />
The facility <strong>and</strong> other equipment all serve a supporting role to the processing<br />
equipment. The primary components of the processing line include:<br />
• Vibrating screen;<br />
• Conveyors;<br />
• Manual picking lines;<br />
• Magnetic sorter;<br />
• Trommel screen;<br />
• Storage bins;<br />
• Rock/concrete grinder; <strong>and</strong><br />
• Wood grinder.<br />
Figure 3-1 provides a process flow diagram of R. W. Beck’s model facility, which is<br />
typical of C&D MRF of this size.<br />
9/14/05 R. W. Beck 3-3
Section 3<br />
Figure 3-1: Process Flow Diagram<br />
Rolling Stock<br />
Rolling stock is the name used to describe equipment that maneuver the C&D debris<br />
within the building. For this model facility, R. W. Beck assumed that an excavator<br />
would be used at the tipping floor to lift the mixed C&D debris onto the vibrating<br />
screen, which, as shown in Figure 3-1, is the first component of the processing line.<br />
Another excavator would be used to place commodity materials into the outbound<br />
trucks <strong>and</strong> also to feed wood into the grinder, which is used to convert brush into<br />
mulch.<br />
3-4 R. W. Beck 9/14/05
C&D Material Recovery Facility Case Study<br />
This model facility assumes that residual material is moved into the transfer trucks for<br />
disposal at the l<strong>and</strong>fill using a wheeled front-end loader. The transfer trucks would be<br />
in a bay that lies below grade so that the top of the trailer is level with the floor of the<br />
MRF. This allows the front-end loader to simply push the material into the transfer<br />
trailer. Another wheel loader would also be used around the MRF floor to maneuver<br />
commodity materials <strong>and</strong> any brush at the MRF.<br />
3.2.1.3 Facilities<br />
The facilities at the MRF site include three primary buildings:<br />
• Main building that contains the processing equipment.<br />
• Support building.<br />
• Scale house at the entrance/exit.<br />
Processing Building<br />
The primary building at the MRF site encloses the processing equipment discussed in<br />
Section 3.2.1.2. For this case study, the building was assumed to be 175 feet by 300<br />
ft, or 52,500 square feet. In addition to the processing equipment, this building<br />
encloses the tipping floor, a limited amount of storage space, <strong>and</strong> the bay used by the<br />
transfer trucks that haul non-recoverable residuals to the l<strong>and</strong>fill.<br />
The building also includes large overhead doors on each side that provide access to the<br />
commodity materials. Trucks can pull up to these doors <strong>and</strong> allow the excavator to<br />
load the trailer with the appropriate material.<br />
Support Building<br />
The support building would provide a break area <strong>and</strong> restrooms for the MRF<br />
employees <strong>and</strong> also provide enough space for a small office <strong>and</strong> meeting space. For<br />
the model facility, the building was assumed to be a 1,000 square foot pre-engineered<br />
building.<br />
Scale House<br />
A scale house would be at the entrance/exit of the MRF. The scale house would reside<br />
between the in-bound <strong>and</strong> out-bound scales. All trucks entering the facility are<br />
weighed. For those trucks bringing material to the MRF, the entry weight is<br />
subtracted from the exit weight to measure the amount of material contained in the<br />
truck. For those trucks that enter to the facility to haul away the recovered materials,<br />
the exit weight is subtracted from the entry weight to determine the amount of the<br />
material sold. Also, trucks that transfer non-recoverable waste to the l<strong>and</strong>fill are<br />
weighed to ensure road safety requirements are met.<br />
3.2.1.4 Staffing<br />
There are several categories of staffing required at a C&D MRF. Table 3-3 provides<br />
an overview of the full-time staff requirements for the model facility.<br />
9/14/05 R. W. Beck 3-5
Section 3<br />
Table 3-3<br />
Staffing Requirements<br />
Staff Position<br />
FTE Required<br />
Heavy Equipment Operators 3-4<br />
Pickers for Overs Manual Picking Line 8-12<br />
Pickers for Unders Manual Picking Line 3-4<br />
Picker for Rock Crusher Line 1<br />
Floor Workers 4-6<br />
Scale House 1-2<br />
Crew Leader 1-2<br />
Supervisor 1<br />
Mechanic 1-2<br />
Administrative Assistant 1<br />
Total 24-35<br />
While the function of most of these staff positions is evident by examining the process<br />
flow diagram in Figure 3-1, the following descriptions provide some additional<br />
insight.<br />
Picker for Rock Crusher Line<br />
After the “unders” material (10 inches <strong>and</strong> under in diameter) has passed through the<br />
manual picking line, the remaining items are largely masonry, stone, concrete, <strong>and</strong><br />
non-recoverable material. This material passes by a blower that blows the lighter<br />
weight material onto the MRF floor for transfer to the l<strong>and</strong>fill. The heavier material is<br />
conveyed to the rock crusher. To ensure the absence of contaminants, a picker is<br />
placed on this conveyor line to remove material that should not be run through the<br />
rock crusher.<br />
Floor Workers<br />
In the MRF, floor workers are tasked with numerous jobs, including helping to pull<br />
contaminants from the tipping floor, directing in-bound <strong>and</strong> out-bound traffic, <strong>and</strong><br />
keeping the MRF floor clear of large debris that could obstruct the rolling stock.<br />
Mechanics<br />
For the purposes of this case study, R. W. Beck assumed that there would be at least<br />
one full-time mechanic that will help maintain both the processing equipment <strong>and</strong> the<br />
rolling stock. Since equipment downtime can be costly, having properly trained<br />
maintenance personnel is important for the MRF operation.<br />
3.2.1.5 Location<br />
The ideal location for a C&D MRF in the North Central Texas region would be one<br />
that is in close proximity to as many C&D debris sources as possible. However, the<br />
cost of the l<strong>and</strong> <strong>and</strong> political or regulatory restrictions should also be considered.<br />
3-6 R. W. Beck 9/14/05
C&D Material Recovery Facility Case Study<br />
In fiscal year 2003, the most recent year for which l<strong>and</strong>fill data is available from the<br />
TCEQ, approximately 1,540,934 tons of C&D debris material was disposed in North<br />
Central Texas region l<strong>and</strong>fills. Table 3-4 provides the distribution of C&D disposal,<br />
by county.<br />
Table 3-4<br />
Distribution of C&D Disposal<br />
County<br />
C&D Disposed<br />
(Tons)<br />
% of C&D<br />
Collin 110,424 7.2%<br />
Dallas 386,591 25.1%<br />
Denton 727,370 47.2%<br />
Ellis 53,738 3.5%<br />
Erath 3,943 0.3%<br />
Hood - 0.0%<br />
Hunt 14,380 0.9%<br />
Johnson 4,582 0.3%<br />
Kaufman - 0.0%<br />
Navarro - 0.0%<br />
Palo Pinto - 0.0%<br />
Parker 3,030 0.2%<br />
Rockwall - 0.0%<br />
Somervell - 0.0%<br />
Tarrant 236,876 15.4%<br />
Wise - 0.0%<br />
Total 1,540,934 100.0%<br />
Source: Texas Commission on Environmental Quality, 2003 Survey<br />
of Texas MSW Facilities<br />
Collin, Dallas, <strong>and</strong> Denton counties received approximately 80 percent of the C&D<br />
debris that was disposed in the North Central Texas region in 2003. In addition,<br />
assuming 2.8 pounds per person per day of C&D debris generation, these three<br />
counties also represent about 60 percent of the C&D generation in the North Central<br />
Texas region. 3<br />
Based on these two facts, locating a C&D MRF in one of these counties would place<br />
the MRF in close proximity to the majority of C&D debris generated in the North<br />
Central Texas region. C&D debris generated in Tarrant County, which is also a large<br />
source of C&D debris, is also within a reasonable distance to these counties.<br />
3 Source: Environmental Protection Agency, Characterization of Building-Related <strong>Construction</strong> <strong>and</strong><br />
<strong>Demolition</strong> Debris in the United States – June 1998.<br />
9/14/05 R. W. Beck 3-7
Section 3<br />
3.2.1.6 End Markets<br />
There are two categories of material available at a C&D MRF, those that have an<br />
economic value <strong>and</strong> those that do not. However, as new processes or products are<br />
developed, the list of materials that are considered non-valuable will become shorter.<br />
Commodity Materials<br />
The more valuable products of a C&D MRF include:<br />
• Wood: Generally, the markets for recovered wood include use as a component of<br />
engineered woods, l<strong>and</strong>scape mulch, animal bedding, compost additive, <strong>and</strong><br />
boiler fuel. These markets vary by region <strong>and</strong> depend on other available materials<br />
<strong>and</strong> which industries are located in the region.<br />
• Metal: Scrap metals, both ferrous <strong>and</strong> non-ferrous, have well-developed markets.<br />
Although prices can suffer from large fluctuations, the dem<strong>and</strong> is consistent.<br />
• Concrete: Concrete <strong>and</strong> other masonry products can be ground up <strong>and</strong> used in<br />
paved roads as aggregate base, gravel roads as surfacing, <strong>and</strong> as base for building<br />
foundations.<br />
• Cardboard: Although cardboard represents a relatively small portion of the mixed<br />
C&D waste stream, it is currently a valuable commodity with an established<br />
market. However, the revenue from selling cardboard may depend on whether the<br />
MRF has enough cardboard to interest a potential buyer.<br />
Non-Recoverable Materials with Alternative Uses<br />
While some of the by-products of a C&D MRF are not considered valuable in the<br />
marketplace, the MRF operators may be able to find customers that are willing to<br />
accept the material at no cost, rather than l<strong>and</strong>filling the material <strong>and</strong> paying a tipping<br />
fee.<br />
For example, the 3/8-inch trommel screen in the model facility allows very small size<br />
material to pass through <strong>and</strong> drop to the one of the collection bins below. This<br />
material, called residual screen material (RSM), is similar in many respects to dirt.<br />
While the RSM may not be sufficient some uses, neighboring l<strong>and</strong>fills may accept this<br />
material without charge for use as alternative daily cover or road stabilization.<br />
3.2.2 Public Awareness<br />
From a public awareness perspective, the objective of a C&D MRF is to convince<br />
consumers or private haulers to dispose of C&D material at the MRF rather than at a<br />
l<strong>and</strong>fill. The value proposition should be that it is a cheaper alternative to l<strong>and</strong>fills.<br />
3.2.2.1 Economic <strong>and</strong> Environmental Considerations<br />
The goal for the C&D MRF is to be completely self-sustaining, meaning that it can<br />
generate enough revenue from operations to cover the operational <strong>and</strong> capital<br />
expenses. In order to convince potential customers to use this facility, the cost of<br />
using it must be less than the next best alternative.<br />
3-8 R. W. Beck 9/14/05
C&D Material Recovery Facility Case Study<br />
Consider, for example, a company that builds residential homes. The builder has two<br />
options for disposing of commingled construction waste. There is a nearby l<strong>and</strong>fill<br />
that accept C&D debris <strong>and</strong> charges a certain tipping fee. The C&D MRF has a less<br />
expensive tipping fee, but is further away. So, although the builder would pay less per<br />
ton to dispose of the construction waste, the increased fuel cost <strong>and</strong> additional time<br />
required to travel to the MRF may offset the cost savings.<br />
In the case that the tipping fee at the C&D MRF is more expensive that the tipping fee<br />
at a nearby MSW or C&D l<strong>and</strong>fill, there is little economic incentive to use the C&D<br />
MRF. However, with the growing pressure on local governments <strong>and</strong> commercial<br />
businesses to make decisions that have less environmental impact, there are chances<br />
for a C&D MRF to succeed, provided that the tipping fee is not significantly higher.<br />
3.3 Keys <strong>and</strong> Impediments to Success<br />
Based on research <strong>and</strong> case studies, R. W. Beck identified several keys <strong>and</strong><br />
impediments to operating a successful C&D MRF in the North Central Texas region.<br />
Keys to success include the following:<br />
• Locating the C&D MRF as close to the sources of C&D as possible will<br />
strengthen the incentive for haulers to use the MRF since it would be less<br />
expensive to transport the C&D debris from the job site to the MRF than to a<br />
l<strong>and</strong>fill or transfer station.<br />
• Reducing the expenses through efficient operations will help keep the C&D MRF<br />
competitive with other C&D disposal or diversion options. The primary operating<br />
expenses at a C&D MRF include labor, residual disposal costs, equipment<br />
operation <strong>and</strong> maintenance, <strong>and</strong> utilities.<br />
• Controlling the in-bound contamination rate will allow the equipment <strong>and</strong> labor at<br />
the C&D MRF to work more efficiently. If contamination rates are not<br />
controlled, the MRF will waste valuable resources separating material that has no<br />
value.<br />
• Minimizing residual material that must be disposed of in a l<strong>and</strong>fill will help the<br />
MRF reduce expenses. Although mentioned earlier, this aspect of operating<br />
expense is particularly important. To help avoid the expense associated with<br />
l<strong>and</strong>filling residual material, the MRF operator should find alternative uses for<br />
non-recoverable material.<br />
• Effectively communicating the importance of disposing of C&D at a MRF is<br />
helpful in obtaining support from the consumers <strong>and</strong> private haulers.<br />
• Continuing to examine the issue of C&D MRF at a more region-specific level<br />
through the conduct of a feasibility Study could foster development of a C&D<br />
MRF in that region. At this time, more region specific data is needed for those<br />
interested in establishing a C&D MRF in the region.<br />
Impediments to success include the following:<br />
9/14/05 R. W. Beck 3-9
Section 3<br />
• The cost per ton to dispose of MSW in Texas is low relative to many other states.<br />
In the North Central Texas region, the weighted-average cost per ton is $19.83. 4<br />
As a comparison, for year 2000, the weighted average l<strong>and</strong>fill disposal fee in<br />
California, where several C&D MRFs operative, was approximately $35. 5<br />
Disposal alternatives must be able to compete with these lower tipping fees to<br />
remain a viable option.<br />
• A waste composition <strong>and</strong> characterization study analyzing the C&D waste stream<br />
in the North Central Texas area has not been conducted. Therefore, estimates<br />
were used to determine the amount or type of C&D debris is available for those<br />
planning the development of a C&D MRF.<br />
• The construction <strong>and</strong> demolition industry has disposed of debris in l<strong>and</strong>fills for<br />
many years. Changing the momentum of the status quo will be a challenge for<br />
any C&D disposal alternatives.<br />
• Texas lacks regulations <strong>and</strong> incentives that exist in other states, which promote or<br />
require C&D waste minimization.<br />
3.4 Cost Benefit Analysis<br />
A common theme throughout this case study is that a C&D MRF must be able to<br />
compete with the l<strong>and</strong>fills in the North Central Texas region. Tipping fees at Type I<br />
<strong>and</strong> Type IV l<strong>and</strong>fills in the North Central Texas region average $19.83 per ton.<br />
One of the assumptions of this case study is that this model facility would be owned<br />
<strong>and</strong> operated by a governmental entity, meaning that taxes are assumed to be zero for<br />
this discussion. Table 3-5 provides an estimate of the capital expenses associated with<br />
the model facility described in this case study. Each expense category includes a low<br />
<strong>and</strong> high estimate based on R. W. Beck’s research.<br />
Table 3-5<br />
Model Facility Capital Expenses<br />
Total Cost Annual Funding Cost 1<br />
Expense Low High Useful Life Low High<br />
L<strong>and</strong> 90,000 400,000 30 7,253 32,235<br />
Buildings <strong>and</strong> Site Improvements 3,555,349 5,333,024 20 335,600 503,400<br />
Processing Equipment 1,850,000 2,275,000 7 343,273 422,134<br />
Rolling Stock 1,365,000 1,560,000 5 332,911 380,469<br />
Total $6,860,349 $9,568,024 $1,019,037 $1,338,238<br />
1 Amortized over the useful life of the capital assuming 7% interest rate.<br />
4 Based on FY 2003 data from the TCEQ. The weighted average tipping fee for all l<strong>and</strong>fills in the<br />
North Central Texas region that report fees on a per ton basis is $19.83.<br />
5 According to a survey conducted by the California Integrated <strong>Waste</strong> Management Board.<br />
3-10 R. W. Beck 9/14/05
C&D Material Recovery Facility Case Study<br />
Table 3-5 provides some insight into the capital financing requirements for the model<br />
facility. R. W. Beck recommends aligning the financing terms of the investment<br />
vehicle with the useful life of each type of capital expense.<br />
Table 3-6 provides the annual operating <strong>and</strong> maintenance costs of the model facility<br />
based on the assumptions discussed throughout this study.<br />
Table 3-6<br />
Model Facility Operating <strong>and</strong> Maintenance Expenses<br />
Total Cost<br />
Expense Low High<br />
Labor 666,536 1,197,872<br />
Utilities 75,000 125,000<br />
Residual disposal costs 1,648,043 1,832,319<br />
Equipment maintenance 150,000 250,000<br />
Total $2,539,579 $3,405,191<br />
Based on the expenses presented in Tables 3-5 <strong>and</strong> 3-6, R. W. Beck estimated a range<br />
of costs per ton required to sustain a C&D MRF in the North Central Texas region.<br />
These revenues assume that the MRF can recover approximately 60 percent of the inbound<br />
material <strong>and</strong> that the remainder must be disposed of at a l<strong>and</strong>fill. These costs<br />
per ton also assume that the model facility revenues equal the expenses incurred. If<br />
the MRF operator intends to fund a reserve account or generate a profit, the tipping<br />
fees would need to be appropriately adjusted. Table 3-7 provides these estimated<br />
tipping fees.<br />
Table 3-7<br />
Cost per Ton Comparison<br />
Facility<br />
Cost per Ton<br />
C&D MRF $18.45 - $24.23<br />
Weighted Average L<strong>and</strong>fill Disposal $19.83<br />
Table 3-8 provides the annual revenues <strong>and</strong> total annual expenses of the model<br />
facility, based on these costs per ton. As noted, the analysis assumes the model<br />
facility operates at zero profit.<br />
9/14/05 R. W. Beck 3-11
Section 3<br />
Table 3-8<br />
Model Facility Revenue <strong>and</strong> Expenses<br />
Revenue <strong>and</strong> Expenses<br />
Low<br />
High<br />
Expenses<br />
Capital 1,019,037 1,338,238<br />
Operating <strong>and</strong> Maintenance 2,539,579 3,405,191<br />
Revenue<br />
Sale of recovered material 763,487 1,072,304<br />
Tipping fees 2,795,129 3,671,126<br />
Total $0 $0<br />
3.5 Key Findings <strong>and</strong> Recommendations<br />
Table 3-7 suggests that the cost per ton for the model facility are within the range of<br />
Type I <strong>and</strong> Type IV l<strong>and</strong>fill tipping fees in the North Central Texas region. However,<br />
there are several factors to consider when deciding to implement a C&D MRF.<br />
1. Based on the results of the cost benefit analysis included in this section,<br />
preliminary findings indicate that a C&D MRF would be feasible in the North<br />
Central Texas region. However, this analysis should be considered preliminary as<br />
several key assumptions were made regarding the quantity <strong>and</strong> composition of inbound<br />
materials, end markets, facility size, equipment <strong>and</strong> location.<br />
2. NCTCOG should consider a more detailed examination of the feasibility of<br />
locating a C&D MRF in the region. The conduct of this analysis should focus on<br />
evaluating the quantity <strong>and</strong> composition of materials, identifying a potential<br />
facility location, estimating facility size <strong>and</strong> processing equipment, <strong>and</strong> identifying<br />
end markets for processed materials.<br />
3. Although the markets exist for materials from a C&D MRF, C&D waste<br />
minimization efforts is relatively new to the North Central Texas region. Any<br />
local government or other entity should complete a more thorough analysis of the<br />
market before deciding to implement a C&D MRF. The potential operator should<br />
develop confidence that haulers will bring mixed C&D debris to the facility <strong>and</strong><br />
that there would be buyers for the sorted material. As mentioned earlier, markets<br />
can vary by region <strong>and</strong> what can be sold in one area may have to be given away in<br />
another.<br />
4. As discussed in Section 3.2.1, it is important to locate a C&D MRF as close to the<br />
sources of C&D debris as possible. Combined with competitive tipping fees, this<br />
will increase the incentive for haulers to choose the C&D MRF over other<br />
alternatives. As noted in Table 3-1, it is estimated that only 8 percent of total<br />
C&D generated is from new construction. Although evidence of new residential<br />
construction is easily noticeable, R. W. Beck recommends that all sources of C&D<br />
be considered when doing an analysis of C&D generation.<br />
3-12 R. W. Beck 9/14/05
C&D Material Recovery Facility Case Study<br />
5. In 2003, Dallas, Ellis, Johnson, Kaufman, <strong>and</strong> Tarrant Counties retained R. W.<br />
Beck to conduct a Metroplex Area Sub-Regional Solid <strong>Waste</strong> Study (Study). This<br />
study analyzed the projected l<strong>and</strong>fill capacity in this five-county region. One of<br />
the conclusions of this study was that the five-county sub-region faces a potential<br />
long-term l<strong>and</strong>fill capacity shortage. To address this shortage, the most likely<br />
scenarios include increased l<strong>and</strong>fill tipping fees or the construction of new<br />
l<strong>and</strong>fills. With the continued population growth of the sub-region, these new<br />
l<strong>and</strong>fills would likely have to be located further away from the developing areas,<br />
thus increasing the transportation costs to <strong>and</strong> from the l<strong>and</strong>fills. In either case, the<br />
cost to dispose of C&D debris would increase, thus improving the feasibility of a<br />
C&D MRF in the North Central Texas region.<br />
6. Co-location of the C&D MRF with another permitted MSW facility can provide<br />
synergies that will help reduce the incremental cost of a C&D MRF. If the C&D<br />
MRF is co-located with another MSW facility, the costs associated with the scale<br />
house, support building, l<strong>and</strong>, labor, <strong>and</strong> possibly some rolling stock may all be<br />
reduced or eliminated. For comparison purposes, R. W. Beck assumed that the<br />
C&D MRF could be co-located with a l<strong>and</strong>fill in the tri-county area of Collin,<br />
Dallas, or Denton Counties. Table 3-9 provides the cost per ton if the scale house,<br />
support building, <strong>and</strong> l<strong>and</strong> costs are all eliminated. R. W. Beck also assumed that<br />
would be some overlap in labor <strong>and</strong> rolling stock <strong>and</strong> reduced some the associated<br />
expenses.<br />
Table 3-9<br />
Tipping Fees with Co-Located Facility<br />
Facility<br />
Cost per Ton<br />
C&D MRF $17.14 - $22.36<br />
Weighted Average L<strong>and</strong>fill Disposal $19.83<br />
An additional benefit, which is not reflected in the MRF costs listed in Table 3-9,<br />
is that if the facilities are co-located, the MRF could dispose of residual at the<br />
l<strong>and</strong>fill at a reduced rate <strong>and</strong> reduced transfer costs.<br />
Lastly, locating a C&D MRF at a currently permitted MSW facility will reduce the<br />
permitting costs associated with the facility since a separate MSW permit is not<br />
required by TCEQ when the facilities are co-located.<br />
7. The NCTCOG <strong>and</strong> the communities within the region should support policies,<br />
regulations or legislation that will increase the requirements for recycling C&D<br />
debris. If contractors have incentives or are required to divert a certain level of<br />
C&D debris from construction <strong>and</strong> demolition projects, then there would be a<br />
greater dem<strong>and</strong> for C&D waste minimization options.<br />
8. The NCTCOG <strong>and</strong> the communities within the region should also support other<br />
C&D waste minimization efforts. Although this may create some level of<br />
competition for the C&D MRF, increased awareness of C&D waste minimization<br />
should benefit all C&D waste minimization efforts.<br />
9/14/05 R. W. Beck 3-13
Section 3<br />
(This page intentionally left blank)<br />
3-14 R. W. Beck 9/14/05
Section 4<br />
On-Site Grinding Case Study<br />
4.1 General Description<br />
On-site grinding is the practice of grinding or crushing building materials, which<br />
would traditionally be disposed of at a l<strong>and</strong>fill, <strong>and</strong> depositing them onsite as a soil<br />
amendment or used as erosion control. From a waste management perspective, on-site<br />
grinding can divert up to 85 percent of C&D waste generated from new home<br />
construction from the waste stream.<br />
Home builders have two options for on-site grinding. The home builder may choose<br />
to own <strong>and</strong> operate a grinder or subcontract on-site grinding services. Both options<br />
use on-site grinders to process materials from the production of homes that have been<br />
designated for disposal. Once separated, the material is processed onsite into smaller<br />
chips or dust. This material is typically deposited onsite as a soil amendment or silt<br />
fencing. Included at the end of this section are photographs of reduced material,<br />
onsite application <strong>and</strong> a grinder.<br />
The economic feasibility of on-site grinding can vary depending on the following<br />
factors:<br />
• How the on-site grinding service is operated.<br />
• Number of homes being built in the area.<br />
• Whether the homes are production or custom built homes.<br />
Grinders are available in a variety of sizes, which will determine the amount of<br />
throughput they are able to process. The throughput capacity of a grinder is most<br />
often affected by its size, age, type of material <strong>and</strong> quantity of material it is processing<br />
4.2 Implementation<br />
During the completion of this case study, R. W. Beck conducted interviews with onsite<br />
grinding contractors <strong>and</strong> home builders within the North Central Texas region <strong>and</strong><br />
a review of available literature regarding on-site grinding <strong>and</strong> new home construction<br />
nationwide.<br />
4.2.1 Solid <strong>Waste</strong> Management<br />
Based on discussions with on-site grinder operators, the size of materials processed,<br />
the loading <strong>and</strong> location of the machine as well as maintenance schedule are<br />
operational considerations that can affect the performance of the grinder.<br />
9/14/05
Section 4<br />
4.2.1.1 Materials H<strong>and</strong>ling <strong>and</strong> Loading<br />
Grinders are ideal for processing wood, stone/masonry, drywall <strong>and</strong> corrugated<br />
cardboard. C&D waste such as wood or drywall typically must be trimmed,<br />
shortened, or split prior to loading them into the grinder. Initially cutting them into<br />
sections, will increase the machines ability to grind the material without stoppages as<br />
well as allow for more material to be loaded at one time.<br />
Table 4.1 illustrates the major waste generating periods of a development <strong>and</strong> the<br />
materials that are typically generated for each phase of construction. Based on<br />
discussions with a home builder, the slab, frame, <strong>and</strong> sheetrock cleanup phases<br />
generate the greatest amount of debris <strong>and</strong> require the most time for clean-up related<br />
activities.<br />
Table 4-1<br />
Major <strong>Waste</strong> Generating Periods<br />
Period<br />
Slab Cleanup<br />
Frame Cleanup<br />
Wood<br />
Wood<br />
Type of <strong>Waste</strong><br />
Cornered Cleanup Stone/Masonry 1<br />
Rough Mechanical Cleanup Corrugated Cardboard<br />
Sheetrock Cleanup<br />
Drywall<br />
Trim Cleanup<br />
Wood<br />
Final Mechanical Cleanup Corrugated Cardboard<br />
Notes:<br />
1<br />
Based on discussions with grinder operators, breakdowns will most<br />
often occur during the grinding of stone, masonry or other dense<br />
materials.<br />
Residual materials may be used as either a soil amendment or could be used as erosion<br />
control in lieu of silt fencing. Using C&D materials as a means of supplanting a<br />
portion of the amount of common fill dirt applied to the site at the end of the job could<br />
save a builder approximately 50 cubic yards that would otherwise be purchased <strong>and</strong><br />
hauled from offsite.<br />
In addition, the use of wood chips as a means of erosion control in lieu of silt fencing<br />
can also be more effective as well as cost avoidance for the builder. Section 4.4.1<br />
provides a more in-depth discussion of cost avoidance strategies.<br />
Grinders can be loaded manually or by using a small front-end loader. The loading<br />
method frequently depends on the size of the grinder, the degree of accessibility to the<br />
machine, <strong>and</strong> the amount of material designated for grinding.<br />
Based on discussions with grinder operators, manual loading of the grinder is the<br />
preferable option unless there is a significant amount of material.<br />
4-2 R. W. Beck 9/14/05
On-Site Grinding Case Study<br />
4.2.1.2 Location<br />
On-site grinders are towed using a one-ton truck <strong>and</strong> can be stationed on either<br />
asphalt, concrete or hard ground. The mobility of the grinder enables it to be easily<br />
moved from job to job, repositioned in a different direction (when wind may be a<br />
factor), or relocated onsite. Provided there is adequate space for both the truck <strong>and</strong><br />
grinder, a grinder may be angled or directed in a variety of manners based on the<br />
needs of the builder. The following provides a description of the three most common<br />
scenarios in which a grinder is used. R. W. Beck would like to note that the<br />
application of these scenarios is often dictated by the manner in which the builder<br />
separates the debris around the jobsite.<br />
Stockpiling<br />
Stockpiling the reduced material into several piles in a single central or several smaller<br />
locations is a strategy that may be employed during the slab cleanup phase of a build<br />
when material is abundant. For example, during this time wood used to form the<br />
foundation of the house will be removed <strong>and</strong> available for reduction. This scenario is<br />
especially suitable when there is an open or unused area that is easily accessible <strong>and</strong> is<br />
away from any busy roads.<br />
Direct Application<br />
Direct application of processed material onto a particular area is often the simplest <strong>and</strong><br />
quickest method of on-site grinding. This technique is ideal for situations where the<br />
building materials <strong>and</strong> the discharge area are co-located. It may also be applicable<br />
during the final mechanical cleanup phase of construction, when the amount of<br />
residual material decreases <strong>and</strong> the processed material will be used as fill material in<br />
small quantities.<br />
Truck Bed/Trailer<br />
In situations where processed material needs to be deposited in numerous stockpile<br />
locations or immediately applied to one or more lots, materials can be discharged into<br />
a truck bed or trailer. Typically, a grinder can be positioned in a single location while<br />
the vehicle can position into the bed of a truck or dumpbody trailer under the<br />
discharge line. This scenario allows the operator a greater degree of maneuverability<br />
to independently <strong>and</strong> quickly apply processed materials.<br />
When using truck beds without a hydraulic dumping body, a retractable tarp can be<br />
attached to the tailgate. The tarp should be unrolled <strong>and</strong> cover the bottom of the truck<br />
bed prior to grinding so that material can collect on the tarp. Once the processing of<br />
material is complete, the materials can then be transported <strong>and</strong> easily emptied at the<br />
desired location using the tarp once the tailgate is released.<br />
4.2.2 On-site Grinder Operations<br />
On-site grinding may be implemented in two manners; the first would involve a home<br />
builder purchasing an on-site grinder <strong>and</strong> the second would involve a home builder<br />
subcontracting grinding services on a regular basis. The second scenario operates in<br />
9/14/05 R. W. Beck 4-3
Section 4<br />
much the same manner as a typical regular disposal service would. For the purposes<br />
of the case study analysis, R. W. Beck chose to focus on the various operational issues<br />
associated with both scenarios.<br />
4.2.2.1 Owning <strong>and</strong> Operating a Grinder<br />
In the event that a home builder chooses to purchase an on-site grinder, several factors<br />
must be taken into consideration to achieve the level of cost effectiveness. Most<br />
importantly, if a builder chooses to own <strong>and</strong> operate a grinder, the builder must<br />
consider whether or not they have enough developments to keep the grinder running<br />
<strong>and</strong> whether they have the manpower to dedicate to the grinder.<br />
Staffing<br />
The on-site grinding process requires staffing for two main areas of the operation: the<br />
source separation of materials <strong>and</strong> the operation of the grinder itself. Staffing for<br />
source separating the materials can be manned by four to five low-skilled laborers who<br />
would stockpile waste by material.<br />
Using the traditional method of waste disposal, these laborers would be tasked with<br />
disposing of all waste into a container. Therefore, explaining <strong>and</strong> demonstrating this<br />
source separation to these laborers is often not difficult. Based on estimates provided<br />
by a home builder, there are typically seven periods where the majority of the waste<br />
generated can be traced as described in Table 4.1. Each laborer would typically<br />
dedicate approximately 20 hours per home over the six month build to source<br />
separation activities.<br />
The other team of employees would be tasked with the operation <strong>and</strong> maintenance of<br />
the grinder. Unlike the manual laborers who would normally be used on the jobsite<br />
already, this team would be comprised of existing staff capable of operating heavy<br />
equipment or new staff hired by the home builder.<br />
This team would need to be trained on the grinder operation <strong>and</strong> be retained for other<br />
concurrently running jobs or additional ones in the future. Typically, it would take no<br />
more than two to three employees to operate a grinder.<br />
Maintenance<br />
It is important to note that proper cleaning <strong>and</strong> maintenance of the grinder will lead to<br />
fewer breakdowns <strong>and</strong> downtime for repair. A grinder manufacturer estimates that the<br />
maintenance cost for a grinder is approximately $6.00 per running hour.<br />
Location<br />
During the grinding process the grinder may be setup at a variety of locations across<br />
the build site. As described in Section 4.2.1.2, the builder may use the stockpiling,<br />
direct application, or truck bed/trailer method of application. The primary difference<br />
between owning <strong>and</strong> operating a grinder <strong>and</strong> subcontracting grinding services is the<br />
storage of the grinder during non-operation by the home builder.<br />
In the scenario where a builder owns <strong>and</strong> operates the grinder, the short term <strong>and</strong> long<br />
term storage of the grinder must be accounted for. Since home builders rarely own a<br />
4-4 R. W. Beck 9/14/05
On-Site Grinding Case Study<br />
significant amount of their own heavy equipment, if at all, a staging or storage area for<br />
the equipment would be a significant barrier to implementing this option.<br />
4.2.2.2 Subcontracting Grinding Services<br />
On-site grinding may also be implemented through retaining the services of an on-site<br />
grinding service provider. Currently, one of the most significant impediments for<br />
home builders who wish to use this service is that only a few on-site grinding service<br />
providers exist in the North Central Texas region. However, the number of service<br />
providers may increase based on the dem<strong>and</strong> for this service by home builders.<br />
From a planning perspective, home builders <strong>and</strong> subcontractors must initially decide<br />
on several different issues:<br />
• Pricing: Subcontractors typically price their service based on the number of<br />
square footage of the house. This price may range from $0.45 to $0.60 per square<br />
foot depending on the number of houses served in an area, frequency of<br />
collection, <strong>and</strong> distance the subcontractor must travel.<br />
• Frequency: Services may be provided on a weekly, semi-weekly or on-call basis.<br />
The frequency of the service may have an impact on the negotiated price. Based<br />
on discussions with service providers, home builders often schedule grinding<br />
services to coincide with open-houses or near the weekend when potential<br />
customers visit the development.<br />
• Additional <strong>Waste</strong> Services: In some cases, service providers will also dispose of<br />
all non-grindable material (shingles, plastics, etc.). The cost of this service is<br />
typically built into the negotiated service price. This accounts for less than 15<br />
percent of the total waste generated by a home building project.<br />
• Location: The home builder <strong>and</strong> subcontractor should determine the location of<br />
all source separated material as well as the location where the residuals should be<br />
deposited. The locations will vary between custom <strong>and</strong> production home projects<br />
<strong>and</strong> may change depending on the phase of the construction.<br />
Staffing<br />
No additional staffing for the home builder would be required for subcontracting<br />
grinder. Low-skilled laborers, who would otherwise gather material <strong>and</strong> deposit them<br />
in a disposal container, would be retasked to source separate materials by source in a<br />
designated area. Based on discussions with home builders who have retained these<br />
services, the number of hours dedicated to disposal activities has not changed since<br />
using the service.<br />
Location<br />
The location of the source separated materials <strong>and</strong> the grinding operation should be<br />
discussed between the home builder <strong>and</strong> the subcontractor during the planning phase<br />
of the project. It is important that the subcontractor <strong>and</strong> home builder communicate<br />
regularly to ensure that both parties are in agreement as to where the material should<br />
be separated <strong>and</strong> deposited at the various stages of the project.<br />
9/14/05 R. W. Beck 4-5
Section 4<br />
4.2.3 Public Awareness<br />
Public awareness for on-site grinding as a means of waste reduction to the residential<br />
new construction industry should initially focus on small to midsize production home<br />
builders. These home builders are typically willing to try new methods for<br />
construction <strong>and</strong> would be a target audience for this campaign.<br />
Introducing new products or procedures, such as this one, directly to large production<br />
home builders may not be successful <strong>and</strong> may meet with some resistance since it has<br />
yet to be proven within the industry. A home builder from the North Central Texas<br />
region, with several years experience in the industry, explained that often home<br />
builders are reluctant to change to a new procedure if unproven to save them money or<br />
operate smoothly. One method to encourage larger home builders to utilize on-site<br />
grinding services is to identify large production home builders that have already<br />
implemented on-site grinding in other parts of the US.<br />
The focus of the public awareness should center on the economic benefits <strong>and</strong> indirect<br />
benefits such as safety <strong>and</strong> cleanliness. Based on discussions with on-site grinding<br />
companies, home builders are initially most responsive to the economic benefits of the<br />
process <strong>and</strong> often do not make their decision based on the environmental impacts of<br />
this new process. However, once home builders are able to see the process in action<br />
throughout the course of a build, they are typically pleased with the aesthetic benefits<br />
of on-site grinding. These benefits are described in further detail in Section 4.4.4.<br />
4.3 Keys <strong>and</strong> Impediments to Success<br />
Based on research <strong>and</strong> case studies, R. W. Beck identified several keys <strong>and</strong><br />
impediments to a successful on-site grinding operation. Keys to success include the<br />
following:<br />
• Communication between parties is necessary to ensure that the service provider<br />
<strong>and</strong> home builder have a successful working relationship during the project <strong>and</strong><br />
that grinding services may be considered as a viable option in the future.<br />
• In cases where the services of a grinder are retained, regular scheduled grinding<br />
times should be established in accordance with neighborhood restrictions as well<br />
as with the construction operation of the home.<br />
• Providing the home builder with informational resources detail the intended uses<br />
of reduced material, scheduling process, <strong>and</strong> tangible <strong>and</strong> intangible benefits of<br />
using on-site grinding can be an effective method of addressing any skepticism<br />
that a builder may have regarding the on-site grinding process.<br />
• The determination of the location of the source separated materials <strong>and</strong> reduced<br />
materials should initially be established <strong>and</strong> maintained throughout the course of a<br />
job. In the event that there is a need to change the location of operation proper<br />
communication should take place between parties.<br />
Impediments to success include the following:<br />
4-6 R. W. Beck 9/14/05
On-Site Grinding Case Study<br />
• Some home builders may believe or are advised by disposal companies that the<br />
status quo method of C&D waste disposal is effective. Overcoming this<br />
preconceived notion <strong>and</strong> illustrating the benefits of on-site grinding may prove to<br />
be an obstacle to instituting on-site grinding as a feasible method for home<br />
builders to use to divert C&D materials from the waste stream.<br />
• Currently, relatively few on-site grinding service providers exist in the North<br />
Central Texas region. Some home builders with an interest in on-site grinding<br />
may not be able to utilize the service due to the limited number of providers.<br />
• Production <strong>and</strong> custom home builders traditionally subcontract all services <strong>and</strong> do<br />
not own their own equipment because of maintenance <strong>and</strong> storage costs. Home<br />
builders may be very hesitant or skeptical about owning <strong>and</strong> operating an on-site<br />
grinder.<br />
• Laborers who are not accustomed to separating materials by source or who may<br />
carelessly mix non-grindable materials with those that can be reduced, may cause<br />
a problem for the grinding operation.<br />
• Dust caused by the grinding of drywall or stone/masonry may be problematic<br />
during windy periods <strong>and</strong> undesirable to site workers or residents nearby. While<br />
dust control systems work well in limiting the amount of excess dust, it does not<br />
completely prevent fly-out.<br />
4.4 Cost Benefit Analysis<br />
To evaluate the costs <strong>and</strong> benefits of on-site grinding, R. W. Beck compared the costs<br />
<strong>and</strong> benefits between traditional disposal versus using an on-site grinder at new<br />
housing developments. For the purposes of this cost benefit analysis, R. W. Beck<br />
developed two scenarios based on two types of home building: custom home building<br />
<strong>and</strong> production home building.<br />
• Scenario One - Custom Homes: A custom home may be described as a “one-of-akind”<br />
home that is designed for a specific client <strong>and</strong> for a certain location. A<br />
custom home is typically based on a design created by an architect or professional<br />
home designer. Due to the fact that each house is unique it reduces the number of<br />
homes a custom home builder may build in a given year. For the purposes of this<br />
analysis, R. W. Beck used the conservative estimate of 10 to 12 homes built by a<br />
custom home builder in a normal year.<br />
• Scenario Two - Production Homes: Production homes are those built from using a<br />
stock set of specifications; however these homes may be customized by selecting<br />
a variety of options. Typically, a superintendent is in charge of between 15 to 25<br />
homes in a specific area at one time. From an operational perspective, these<br />
homes may be built during the same period, depending on the contractor, <strong>and</strong> a<br />
project may last from four to six months. For the purposes of this study,<br />
R. W. Beck estimated that a production superintendent may construct 50 to 75<br />
homes annually.<br />
9/14/05 R. W. Beck 4-7
Section 4<br />
Within each scenario, R. W. Beck presented three options that a home builder may<br />
choose to implement.<br />
• Status Quo (Traditional <strong>Waste</strong> Disposal): The most common method for home<br />
builders to dispose of C&D waste generated by the building of custom or<br />
production homes is through a contracted waste disposal service. Typically, a<br />
container is delivered to the site where C&D debris is loaded manually. The<br />
container is then hauled away <strong>and</strong> the waste is disposed at a l<strong>and</strong>fill by the service<br />
provider.<br />
• Owning <strong>and</strong> Operating a Grinder: As described in Section 4.2.2.1, a builder may<br />
choose to own <strong>and</strong> operate an on-site grinder to be used at one or more<br />
developments.<br />
• Subcontracting Grinding Services: As described in Section 4.2.2.2 a builder may<br />
retain the services of an on-site grinding service provider to reduce waste at the<br />
development.<br />
For each scenario R. W. Beck examined all the costs related to waste disposal<br />
including: labor related to disposal or source separation, equipment costs, <strong>and</strong> hauling<br />
or grinding costs. For the purposes of the cost benefit analysis of owning <strong>and</strong><br />
operating a grinder, R. W. Beck assumed two operator employees dedicating<br />
approximately 13 hours per home over the course of the build. R. W. Beck would<br />
note that these employees may have significant amounts of downtime during nonoperation.<br />
The operators may be reassigned by the home builder as deemed necessary<br />
or institute on-site grinding at other developments. In addition, these labor estimates<br />
do not include the possible transportation time associated with moving the grinder<br />
from site to site, if the builder were to use the grinder at different jobsites.<br />
4.4.1 Cost Avoidance Analysis<br />
Additional cost savings may be achieved through using on-site grinding versus<br />
traditional disposal options through the reuse of the reduced material onsite. The two<br />
primary cost saving strategies are alternative erosion control <strong>and</strong> soil amendments<br />
methods.<br />
4.4.1.1 Erosion Control<br />
Through the use of chipped wood to create a protective berm in place of silt fencing, a<br />
home builder has the opportunity to avoid the cost of purchasing silt fencing. The cost<br />
avoidance of silt fencing may be a significant amount per home. In the case of a<br />
production home builder who builds 50 homes annually, the cost avoidance of silt<br />
fencing may be up to $13,150. Figure 4.1, located at the end of this section, illustrates<br />
how a mulch berm may be used for erosion control.<br />
The home builder gains an additional benefit through avoiding the labor costs<br />
associated with of installing, maintaining <strong>and</strong> tearing down the silt fence. These<br />
additional savings have not been captured in this cost benefit analysis but may prove<br />
to be considerable with a greater number of homes.<br />
4-8 R. W. Beck 9/14/05
On-Site Grinding Case Study<br />
From an operational perspective, protective berms are more effective in capturing soil<br />
as compared to silt fencing during heavy rains that occur frequently in the North<br />
Central Texas region. While this method may require some maintenance by the<br />
subcontractor or laborers, the protective berm may be easier to rebuild in some<br />
scenarios.<br />
4.4.1.2 Soil Amendment<br />
Application of reduced materials such as wood, brick/masonry, drywall <strong>and</strong><br />
corrugated cardboard onto the site can have a substantial impact on the amount of<br />
common fill needed to level the home <strong>and</strong> l<strong>and</strong>scape. Based on estimates provided by<br />
service providers, grinding may replace approximately 50 cubic yards of common fill<br />
needed by the home builder. This may account for approximately one-third or onefourth<br />
of the total fill costs for the property. From a cost benefit perspective this may<br />
be a significant amount per home, an estimated $25,000 annually for a production<br />
home builder who builds 50 homes annually.<br />
4.4.2 Scenario One – Custom Homes<br />
For the purposes of this cost benefit analysis, R. W. Beck assumed that a typical<br />
custom home superintendent builds approximately 10 to 12 homes with the average<br />
home being 4,500 square feet. Based on the waste generation model developed by the<br />
U.S. Environment Protection Agency (U.S. EPA), there are approximately 108 cubic<br />
yards of C&D waste for each home.<br />
Based on R. W. Beck’s analysis of on-site grinding for custom homes, it would<br />
potentially cost a custom home builder an additional $1,200 to $1,800 per home to use<br />
the on-site grinding method more than the traditional disposal method. One reason for<br />
the additional cost for grinding service is that service providers may need to charge<br />
custom home builders a premium for their service. Service providers stated that<br />
transportation costs to the site <strong>and</strong> labor inefficiencies due to servicing only one or two<br />
houses instead of several houses at a location contribute to this additional cost.<br />
Based on discussions with grinder service providers, the provider may be willing to<br />
negotiate a comparable price to l<strong>and</strong>fill disposal in order to establish a rapport with<br />
home builders in the area. As one would expect, this negotiated price would not be<br />
able to be maintained over time based on the current cost of the service. However,<br />
once the service provider exp<strong>and</strong>s its business <strong>and</strong> the cost of their service were to<br />
decrease, they may be able to compete more effectively with l<strong>and</strong>fill disposal in the<br />
future.<br />
From an impact on the waste stream perspective, custom home builders typically make<br />
up a relatively small number of total home builders in the region. Therefore the<br />
percentage of the C&D waste stream from this sector is a smaller portion of the<br />
amount of C&D disposal at l<strong>and</strong>fills. In order to confirm this statistic, a composition<br />
study of the C&D waste stream in the North Central Texas region analyzing the point<br />
of generation for C&D waste would be necessary.<br />
9/14/05 R. W. Beck 4-9
Section 4<br />
Table 4.2 illustrates the costs of each solid waste management method for custom<br />
home builders over the course of a normal year.<br />
Table 4-2<br />
Custom Home Cost Benefit Analysis Based on 10 Homes Annually<br />
Costs<br />
Disposal<br />
Own/Operate<br />
On-Site Grinding<br />
Subcontract<br />
Labor 2,475 7,275 2,475<br />
Equipment - 24,288 -<br />
Fuel <strong>and</strong> Maintenance - 5,000 -<br />
Disposal Services 9,000 1,350 -<br />
Grinding Services - - 29,250<br />
Total Costs 11,475 37,913 31,725<br />
Total Costs per Home 1,148 3,791 3,173<br />
Cost Avoidance<br />
Erosion Control - (2,630) (2,630)<br />
Soil Amendment - (5,000) (5,000)<br />
Total Cost Avoidance - (7,630) (7,630)<br />
Net Cost $11,475 $30,283 $24,095<br />
Net Costs/(Savings)<br />
Related to Disposal<br />
$18,808 $12,620<br />
Net Cost/(Savings) Related<br />
to Disposal per Home<br />
$1,881 $1,262<br />
R. W. Beck would note that a custom home builder may still choose to use on-site<br />
grinding as a means of waste reduction if requested by a client or as a marketing<br />
strategy for their product.<br />
4.4.3 Scenario Two – Production Homes<br />
For the purposes of this cost benefit analysis, R. W. Beck assumed that a typical<br />
production home superintendent builds approximately 50 to 75 homes with the<br />
average home being 2,500 square feet. Based on the waste generation model<br />
developed by the US EPA, there are approximately 50 cubic yards of C&D waste for<br />
each home.<br />
Table 4.3 illustrates the costs of each solid waste management method for production<br />
home builders over the course of a normal year.<br />
Based on R. W. Beck’s analysis of on-site grinding for production homes, a<br />
superintendent who chooses to subcontract on-site grinding services may see a<br />
reduction in waste related costs of approximately $180 per home. This cost reduction<br />
4-10 R. W. Beck 9/14/05
On-Site Grinding Case Study<br />
is achieved through offsetting some or all of the costs of silt fencing <strong>and</strong> soil<br />
amendments.<br />
In the future, the cost of service providers charge may decrease even further as it<br />
becomes more competitive with l<strong>and</strong>fill disposal. This would most likely occur<br />
through service providers achieving economies of scale <strong>and</strong> the development of<br />
relationships with service providers.<br />
Table 4-3<br />
Production Home Cost Benefit Analysis Based on 50 Homes Annually<br />
Costs<br />
Disposal<br />
Own/Operate<br />
On-Site Grinding<br />
Subcontract<br />
Labor 14,231 41,831 14,231<br />
Equipment - 24,288 -<br />
Fuel <strong>and</strong> Maintenance - 7,000 -<br />
Disposal Services 20,833 3,125 -<br />
Grinding Services - - 50,000<br />
Total Costs 35,065 76,244 64,231<br />
Cost per Home 701 1,524 1,284<br />
Cost Avoidance<br />
Erosion Control - (13,150) (13,150)<br />
Soil Amendment - (25,000) (25,000)<br />
Total Cost Avoidance (38,150) (38,150)<br />
Net Cost $35,065 $38,094 $26,081<br />
Net Costs/(Savings)<br />
Related to Disposal<br />
$3,030 ($8,983)<br />
Net Cost/(Savings) Related<br />
to Disposal per Home<br />
$60 ($180)<br />
4.4.4 Indirect Benefits of On-Site Grinding<br />
<strong>Waste</strong> related issues are traditionally topics that few home builders pay much attention<br />
to when developing a construction plan. However, based on discussions with home<br />
builders, the status-quo disposal process currently used by many home builders lends<br />
itself to a number of problems that can be addressed by on-site grinding.<br />
These indirect benefits are often overlooked or may not be deemed as substantially<br />
beneficial in relation to the costs of this process by a home builder. However,<br />
R. W. Beck believes these benefits may be just as important as a means of solving<br />
some operational issues builders are faced with as well as a means of marketing their<br />
home to consumers.<br />
9/14/05 R. W. Beck 4-11
Section 4<br />
4.4.4.1 Illegal Use of Disposal Containers<br />
Residents who seek to illegally dump bulky items often misuse waste containers that<br />
are located on the jobsite as a means of illegal disposal. Items such as couches,<br />
televisions, chairs <strong>and</strong> mattresses are most often found to be dumped during the night<br />
when the site is vacant. From a cost benefit perspective, home builders may lose a<br />
significant amount of container space from these bulky items that may force them to<br />
increase the amount of pulls per container.<br />
Through on-site grinding, the need for disposal containers is generally diminished<br />
greatly or completely avoided, therefore the individuals who would seek to illegally<br />
use disposal containers would seek to dispose of their waste elsewhere.<br />
4.4.4.2 Risk Mitigation<br />
From a risk management perspective, improperly or carelessly discarded C&D waste<br />
in work areas may pose a significant threat to the health <strong>and</strong> welfare of contractors <strong>and</strong><br />
laborers in the work area. In the event a technician or laborer was to injure himself on<br />
the job, it could result in workers compensation claims <strong>and</strong> unnecessary downtime for<br />
that individual.<br />
Since on-site grinding requires materials to be systematically source separated in<br />
designated areas <strong>and</strong> ultimately reducing excess materials quickly, the amount of<br />
waste scattered across a jobsite <strong>and</strong> the length of time in which waste is stockpiled is<br />
often reduced dramatically. From a cost benefit perspective, on-site grinding leads to<br />
a safer work environment for all employees <strong>and</strong> reduces risk to the home builder.<br />
4.4.4.3 Aesthetics<br />
New housing developments that grind materials frequently have cleaner <strong>and</strong> safer<br />
work environments. The home builder may be viewed by the consumer in a positive<br />
manner <strong>and</strong> may associate a cleaner work environment to a better built home.<br />
Based on discussions with a production home builder, potential homebuyers who have<br />
visited the development a day to two days after grinding have commented positively<br />
on the site cleanliness <strong>and</strong> work environment.<br />
4.4.4.4 Local Ordinance Restrictions<br />
Restrictions may exist in some communities that prohibit the use of disposal<br />
containers onsite. This may force some home builders to use unsound, makeshift<br />
disposal containers. Through the use of on-site grinding, a home builder could operate<br />
normally in accordance with all local ordinances.<br />
4.4.4.5 Downtime after Inclement Weather<br />
Home builders often must shut down operations after heavy rains due of the buildup of<br />
mud around a home or the general work area. Depending on the magnitude <strong>and</strong><br />
stretch of inclement weather, a jobsite may stay muddy for a significant period of<br />
time. As a result, crews that resume work or potential customers who visit the site<br />
may track mud in the houses during walkthroughs or would be unable to reach the site.<br />
4-12 R. W. Beck 9/14/05
On-Site Grinding Case Study<br />
As a means to resolving this problem, applying reduced drywall to the soil has been an<br />
effective measure in reducing the amount of mud in the area. The reduced drywall<br />
acts as a sponge that soaks up moisture in the ground. Since many home builders are<br />
already unable to work during the actual storm, the quicker crews can resume work the<br />
less of an impact the inclement weather will have on the project schedule.<br />
4.4.4.6 Marketing Strategy<br />
Home builders who use on-site grinding may benefit from using this fact as a selling<br />
point to potential clients or developing marketing materials that include a brief<br />
description of their waste disposal process. To the consumers, a home builder who<br />
implements on-site grinding as a way to reduce the amount of C&D waste disposed of<br />
at l<strong>and</strong>fills may be viewed as environmentally conscious or different from other home<br />
builders.<br />
4.4.4.7 Green Building<br />
<strong>Waste</strong> minimization efforts like on-site grinding are typically included in green<br />
building rating programs. More information on green building <strong>and</strong> the benefits of this<br />
program may be found in the case study analysis on green building in Section 2.<br />
4.5 Key Findings <strong>and</strong> Recommendations<br />
1. Contracting on-site grinding services may be a cost-effective alternative compared<br />
to traditional waste disposal for production home builders in the North Central<br />
Texas region. From a financial perspective, the cost-effectiveness of this may<br />
depend on cost of the service <strong>and</strong> implementation of cost-avoidance strategies.<br />
2. Based on R. W. Beck’s analysis of on-site grinding for production homes, a<br />
superintendent who chooses to subcontract on-site grinding services may see a<br />
reduction in waste related costs of approximately $180 per home.<br />
3. Using on-site grinding as a means of C&D waste reduction for custom homes is<br />
currently not a cost-effective method of reducing waste <strong>and</strong> may cost<br />
approximately $1,200 to $1,800 more per home than disposal.<br />
4. The indirect benefits of on-site grinding may have a substantial impact on the<br />
likelihood that home builders will use on-site grinding as a means of waste<br />
disposal in the future.<br />
5. Production home builders subcontracting on-site grinding services is the most<br />
economically feasible option for this solid waste management method.<br />
6. With the widespread use of waste minimization strategies such as on-site grinding,<br />
the long-term benefits of diverting C&D waste from l<strong>and</strong>fills in the North Central<br />
Texas region will continue to benefit the North Central Texas region.<br />
9/14/05 R. W. Beck 4-13
Section 4<br />
Figure 4-1: On-Site Grinding Process<br />
Photograph of an on-site grinder.<br />
Part of a chipped wood stockpile that can be<br />
used as a soil amendment.<br />
Reduced masonry <strong>and</strong> brick that can be used as<br />
a soil amendment.<br />
Mulch berm that can be used as an alternative to<br />
silt fencing.<br />
4-14 R. W. Beck 9/14/05
Section 5<br />
LEED Deconstruction Case Study<br />
5.1 General Description<br />
Deconstruction is defined as the selective dismantlement or removal of materials from<br />
buildings for reuse or recycling. This process, as an alternative to the more traditional<br />
demolition of a building, can serve as an effective way of reducing a significant<br />
amount of waste from entering the waste stream.<br />
Deconstruction is also one of the many activities used under the Leadership in Energy<br />
<strong>and</strong> Environmental Design (LEED). LEED is defined as a rating system used to set<br />
st<strong>and</strong>ards <strong>and</strong> provide evaluation criteria to determine if construction or<br />
deconstruction has occurred in an environmentally friendly manner. In other words,<br />
LEED is a green building rating system for commercial or institutional buildings such<br />
as office buildings or multi-use facilities.<br />
The LEED rating system is made up of a checklist of 69 possible points <strong>and</strong><br />
recommends strategies that enable a building project to earn these points. These<br />
points are based on a number of different categories including:<br />
• Sustainable sites;<br />
• Water efficiency;<br />
• Materials <strong>and</strong> resources;<br />
• Indoor air quality; <strong>and</strong><br />
• Energy <strong>and</strong> atmosphere;<br />
• Innovation <strong>and</strong> design process.<br />
Since these structures are typically much larger than homes, the potential impact of<br />
commercial building on the waste stream is significant. Instituting a program, such as<br />
LEED, is one way to encourage waste minimization activities in commercial building.<br />
5.2 Implementation<br />
R. W. Beck focused its case study research on the partial deconstruction of a building<br />
<strong>and</strong> the materials <strong>and</strong> resources component of the LEED rating system. The Hensley<br />
Field Operations Center 25 (Hensley Field), which will ultimately house the<br />
Equipment <strong>and</strong> Building Services Division for the City of Dallas (Dallas), was chosen<br />
as the subject of the case study analysis.<br />
Hensley Field is an 80,000 square foot complex that will house the fleet maintenance<br />
operations for all City of Dallas departments as well as retrofitting of all police<br />
automobiles. It is located in the west central area of Dallas on the closed Hensley Air<br />
Force Base. Included at the conclusion of this section are photographs of the facility.<br />
9/14/05
Section 5<br />
The Hensley Field project is under the management of the Environmental Services<br />
Division for Dallas. The project manager oversees various aspects of the project since<br />
its initiation including, building design, construction <strong>and</strong> waste management planning,<br />
<strong>and</strong> acting as liaison for Dallas during deconstruction.<br />
The project manager worked very closely with all related parties during the three<br />
month process including attending regular weekly meetings, offering input regarding<br />
waste minimization <strong>and</strong> analyzing preliminary tonnage data.<br />
Harrison Walker & Harper, L.P. (HWH) is the acting construction management firm<br />
for the Hensley Field project <strong>and</strong> is responsible for all aspects of the process. Mart,<br />
Inc. (Mart) has been retained as a subcontractor to HWH to perform the<br />
deconstruction of the interior <strong>and</strong> exterior of the Hensley Field project.<br />
5.2.1 Program Requirements<br />
In 2003, the City of Dallas passed an ordinance requiring all public buildings that are<br />
at least 10,000 square feet <strong>and</strong> are to be demolished or constructed receive a LEED<br />
rating no less than LEED Certified. 1 Several new construction projects for the City of<br />
Dallas have been produced under the LEED guidelines, however none have received a<br />
rating at this time. Hensley Field is the first LEED rated deconstruction project for the<br />
City of Dallas.<br />
As a result of implementing the deconstruction process, the Dallas hopes to receive a<br />
LEED Silver rating for the deconstruction of the building. The LEED Silver rating is<br />
issued to those projects which have diverted more than 80 percent of their waste from<br />
the waste stream.<br />
5.2.2 Solid <strong>Waste</strong> Management<br />
Prior to the project initiation Dallas requested that a waste management plan be<br />
established detailing all relevant aspects of the deconstruction process. The waste<br />
management plan developed by Mart <strong>and</strong> HWH detailed the following:<br />
• <strong>Waste</strong> Management Goals: Recognized Dallas’ goal of the 80 percent waste<br />
reduction to be achieved during this project.<br />
• Communication Plan: Provided an overview of the expectations for<br />
communications at all contractor meetings <strong>and</strong> ensured that all employees would<br />
be aware of the waste management goals of this project.<br />
• Definitions: Defined various keywords <strong>and</strong> topics to be covered in the project.<br />
• <strong>Construction</strong> Plan: Detailed strategies which would be employed to deconstruct<br />
the various components of the building. Table 5.10 describes the hauler, disposal<br />
method (recycled or l<strong>and</strong>fill), disposal location <strong>and</strong> on-site collection method.<br />
• Quantity Verification Procedure: Described the techniques that would be used to<br />
ensure that all material was properly disposed or recycled, weighed correctly <strong>and</strong><br />
accounted for.<br />
1 A discussion of the LEED rating system is included in the Best Management Practices section of this<br />
report in Section 7.1.2.<br />
5-2 R. W. Beck 9/14/05
LEED Deconstruction Case Study<br />
• Indoor Air Quality: Addressed the manner in which indoor air quality would be<br />
ensured during the conduct of deconstruction. This focused on: Heating <strong>and</strong><br />
Ventilation <strong>and</strong> Cooling (HVAC) protection, source control, pathway<br />
interruption, housekeeping, <strong>and</strong> scheduling.<br />
5.2.2.1 Materials<br />
Based on the waste management plan, Mart <strong>and</strong> Dallas staff were able to take a<br />
proactive approach to the deconstruction process.<br />
Table 5-1<br />
Phase One – Material Recovery Results<br />
Category<br />
Materials Processed (Tons)<br />
Percentage<br />
Total<br />
Diverted Disposed<br />
Recycled<br />
Fencing 0.13 - 0.13 100%<br />
Rigid Foam Insulation - 0.68 0.68 0%<br />
Window Glass - 0.15 0.15 0%<br />
Salvaged Equip. & Access. 0.21 - 0.21 100%<br />
Lead 4.50 - 4.50 100%<br />
Carpet & Pad - 0.29 0.29 0%<br />
Ceiling 12.14 1.75 13.89 87%<br />
HVAC 50.25 27.05 77.29 65%<br />
Electrical 32.70 2.06 34.75 94%<br />
Plumbing 4.26 9.00 13.26 32%<br />
Structural Steel 8.78 - 8.78 100%<br />
Decking 4.83 - 4.83 100%<br />
Mezzanine Concrete 11.00 - 11.00 100%<br />
Concrete 1,452.02 - 1,452.02 100%<br />
CMU Block 619.45 - 619.45 100%<br />
Laminated Plywood - 5.41 5.41 0%<br />
Gypsum Board - 33.22 33.22 0%<br />
Wood Studs & Plywood 11.19 - 11.19 100%<br />
Metal Studs 3.54 - 3.54 100%<br />
Hollow Metal Materials 5.24 - 5.24 100%<br />
Doors 2.79 - 2.79 100%<br />
Total 2,222.99 79.60 2,302.59 97%<br />
Notes:<br />
1 Tonnages based on disposal <strong>and</strong> recycler ticket data provided by Mart, Inc.<br />
2 The data for some materials in this table has been grouped together, a more detailed breakout of tonnage<br />
data may be found in Appendix C.<br />
9/14/05 R. W. Beck 5-3
Section 5<br />
In many cases, Mart had already identified <strong>and</strong> contacted recyclers <strong>and</strong> salvage yards<br />
in the area to investigate recycling options. These also provided Mart with a sense of<br />
what materials would be revenue neutral, generate revenue or would have a cost<br />
associated with disposal. Table 5.1 describes the tonnages associated with various<br />
materials recovered during deconstruction <strong>and</strong> their disposal method.<br />
Based on the data provided by the contractors, approximately 97 percent of the<br />
material by weight was diverted from the l<strong>and</strong>fill. A brief description of the recovery<br />
process, broken out by material type follows.<br />
Ceiling<br />
All uncontaminated ceiling tiles <strong>and</strong> grid materials were deconstructed <strong>and</strong> recovered<br />
manually. As discussed in Appendix B, ceiling tiles were stacked on wooden pallets<br />
<strong>and</strong> were picked up by a manufacturer <strong>and</strong> recycled. Deconstructed grid materials<br />
were stockpiled along with other tin materials in a container <strong>and</strong> then recycled at a<br />
salvage facility.<br />
Mart <strong>and</strong> Dallas staff reported that a heavy storm blew the roof off of two buildings,<br />
including the building where the materials were stored. From a waste diversion<br />
perspective, if these palletized ceiling tiles were not properly sealed <strong>and</strong> exposed to<br />
the elements, the ceiling tile manufacturer could have refused pick-up <strong>and</strong> the tiles<br />
would have been sent to the l<strong>and</strong>fill. Fortunately, in this case the contractors had<br />
taken the appropriate measures to palletize <strong>and</strong> seal the materials.<br />
An additional issue that was faced with regards to ceiling tile recycling was that the<br />
manufacturer had a policy that it would not remove less than 30,000 cubic yards of tile<br />
<strong>and</strong> the project only had approximately 28,000 cubic yards of tile to be reclaimed.<br />
Fortunately, the manufacturer picked up the tiles, however, in the event that they did<br />
not, the costs for transportation to the recycling facility would have been significant.<br />
Approximately 85 percent of ceiling material was recycled which accounted for an<br />
estimated 12 of the 14 tons collected.<br />
Interior Walls<br />
Many of the interior walls of the complex were constructed of Concrete Masonry Unit<br />
(CMU’s) 2 <strong>and</strong> mortar or drywall <strong>and</strong> studs.<br />
These interior walls composed of CMU’s were often toppled using a wheeled loader<br />
<strong>and</strong> all in-tact CMU’s were stacked manually on pallets. Based on discussions with<br />
Mart staff, using the small front-end loaders worked very well <strong>and</strong> the bricks did not<br />
often sustain severe damage. A photograph of the CMU’s has been included at the<br />
end of this section.<br />
Initially, the CMU’s were to be hauled to a recycling facility to be ground. However,<br />
an alternative reuse opportunity presented itself when a local business needed CMU’s<br />
to construct a storage facility. The individual <strong>and</strong> the contractor negotiated a price of<br />
$0.25 per CMU (including pickup). Therefore, Mart did not incur any disposal or<br />
transportation costs associated with the reuse of those materials.<br />
2 Also more commonly known as “cinder blocks.”<br />
5-4 R. W. Beck 9/14/05
LEED Deconstruction Case Study<br />
The interior walls composed of drywall <strong>and</strong> metal or wood studs were source<br />
separated to be recycled or disposed. Based on Mart’s waste management plan, the<br />
sheetrock was disposed of due to the unknown origins <strong>and</strong> compositions of the wall<br />
finish. However, all metal or wood studs were recovered <strong>and</strong> sent to an appropriate<br />
processing facility. Approximately 94 percent of the interior wall materials were<br />
recycled, which accounted for an estimated 634 of the 672 tons collected.<br />
Finishes<br />
Items such as doors, frames, flooring <strong>and</strong> other finishes were recovered whenever<br />
possible <strong>and</strong> separated by material at various location around the interior of the<br />
complex. Any doors <strong>and</strong> frames were separated manually to be potentially used again<br />
by the City of Dallas. The deconstruction of the doors was one of the first steps taken<br />
in the entire process, <strong>and</strong> was useful in opening up the area for deconstruction crews.<br />
Heating <strong>and</strong> Cooling System<br />
The HVAC system is comprised of several components <strong>and</strong> runs throughout the entire<br />
complex. For the purposes of this project, the HVAC system was manually<br />
deconstructed, separated by source <strong>and</strong> prepared for disposal or recycling. Table 5.2<br />
describes the various components of the HVAC <strong>and</strong> the disposal method for each<br />
material.<br />
Table 5-2<br />
HVAC System Component Disposal Summary<br />
Component<br />
Description/Process<br />
<strong>Waste</strong><br />
Management<br />
Ductwork<br />
Manually deconstructed, stockpiled, crushed <strong>and</strong><br />
delivered to scrap yard<br />
Recycled<br />
Insulation Removed from duct <strong>and</strong> discarded Disposed at L<strong>and</strong>fill<br />
Flexible Duct Removed from system <strong>and</strong> discarded Disposed at L<strong>and</strong>fill<br />
Fiberglass Plenums Removed from system <strong>and</strong> discarded Disposed at L<strong>and</strong>fill<br />
Pipe & Valves All iron will be stockpiled into bins <strong>and</strong> recycled Recycled<br />
Pipe Insulation Removed from pipe manually <strong>and</strong> discarded. Disposed at L<strong>and</strong>fill<br />
All other HVAC related equipment is source sorted into<br />
Equipment 1<br />
bins or stockpiled on-site for salvage<br />
Notes:<br />
1<br />
Equipment includes Boilers <strong>and</strong> Variable Air Volume (VAV) Boxes<br />
Recycled<br />
Approximately 65 percent of the HVAC system was diverted from the l<strong>and</strong>fill which<br />
accounted for an estimated 50 of the 77 tons.<br />
Windows<br />
All glass windows marked for deconstruction throughout Hensley Field were<br />
removed, stored in roll-off containers <strong>and</strong> eventually disposed of at the l<strong>and</strong>fill. The<br />
amount of glass from the windows, approximately .15 tons, was not enough to make<br />
the recovery <strong>and</strong> recycling cost-effective, nor did Dallas have a need to reuse the glass<br />
windows.<br />
9/14/05 R. W. Beck 5-5
Section 5<br />
Electrical System<br />
The electrical system in Hensley Field consisted of several components which were<br />
recycled, salvaged or disposed. Much of the time, fixtures <strong>and</strong> materials such as light<br />
tubes required laborers to manually disassemble the objects into the different material<br />
categories such as ballasts <strong>and</strong> fittings for recovery by electrical salvage companies.<br />
Based on the data provided by Mart, only the plugs <strong>and</strong> switches, which were outdated<br />
were not able to recovered. Mart reported that all wiring was taken offsite <strong>and</strong> stored<br />
at the Mart storage facility to prevent theft of the material. While this was not a<br />
significant impediment, the ability to store the material onsite would have been more<br />
efficient. Table 5.3 describes the various components of the electrical system <strong>and</strong> the<br />
disposal method for each material.<br />
Approximately 94 percent of the electrical system was recycled, which accounted for<br />
an estimated 33 tons of the 35 tons collected.<br />
Table 5-3<br />
Electrical System Component Disposal Summary<br />
Component<br />
Description/Process<br />
<strong>Waste</strong><br />
Management<br />
Conduit & Connectors Deconstructed, sorted <strong>and</strong> hauled Recycled<br />
Wiring Removed daily from site <strong>and</strong> stored at Mart facility Recycled<br />
Panels & Stitches<br />
Deconstructed, palletized <strong>and</strong> removed by electrical<br />
salvage contractors<br />
Recycled<br />
Transformers Source sorted <strong>and</strong> removed to temporary storage Recycled<br />
Ballasts Separated onsite from light tubes Recycled<br />
Light Tubes Separated onsite into wiring, ballasts, tubes <strong>and</strong> tin Recycled<br />
Plugs & Switches<br />
Removed from electrical system <strong>and</strong> discarded into<br />
bins<br />
Disposed at L<strong>and</strong>fill<br />
Fittings Separated onsite from light tubes Recycled<br />
Plumbing System<br />
The plumbing system at Hensley Field was deconstructed manually <strong>and</strong> much of the<br />
material was loaded for disposal. Since many of the fixtures, including all of the china<br />
fixtures were disposed at the l<strong>and</strong>fill, the recovery rate for the plumbing system was<br />
32 percent or approximately 4.26 tons of the 13.26 tons deconstructed. However,<br />
Mart was able to recycle a significant portion of cast iron <strong>and</strong> copper, which was sold<br />
to a salvage yard. Table 5.4 describes the various components of the plumbing system<br />
<strong>and</strong> the disposal method for each material.<br />
5-6 R. W. Beck 9/14/05
LEED Deconstruction Case Study<br />
Table 5-4<br />
Plumbing System Component Disposal Summary<br />
Component<br />
Description/Process<br />
<strong>Waste</strong><br />
Management<br />
Fixtures<br />
China Fixtures<br />
Pipe Cast Iron<br />
Deconstructed from system <strong>and</strong> sorted; all half-bradley<br />
sinks sorted for re-use by City<br />
Includes all toilets, lavatories, <strong>and</strong> drinking fountains<br />
<strong>and</strong> discarded into disposal bins<br />
Separated from various fixtures <strong>and</strong> stockpiled to be<br />
recycled<br />
Recycled<br />
Disposed at L<strong>and</strong>fill<br />
Recycled<br />
Pipe Copper<br />
Separated from various fixtures <strong>and</strong> stockpiled to be<br />
recycled<br />
Recycled<br />
Pipe Insulation Removed from pipes <strong>and</strong> discarded Disposed at L<strong>and</strong>fill<br />
5.2.2.2 Equipment<br />
Heavy equipment used during the deconstruction process was reduced significantly<br />
since much of the building was disassembled manually. Mart used small front-end<br />
loaders were used during the deconstruction of CMU walls. In addition, scissor lifts<br />
were used during the deconstruction of HVAC ducts, electrical wiring <strong>and</strong> any<br />
miscellaneous materials unable to be reached from the ground.<br />
Additionally, Mart contracted with two container suppliers <strong>and</strong> haulers to provide<br />
collection bins for the complex. For the purposes of hauling non-recyclable material<br />
to the l<strong>and</strong>fill, a private hauler provided 30-cubic yard roll-off containers located<br />
onsite. A private solid waste collection company was retained to provide various<br />
sized storage <strong>and</strong> recycling bins to stockpile, crush <strong>and</strong> haul materials to recycling<br />
facilities.<br />
5.2.2.3 Staffing<br />
Based on discussions with Mart staff, labor associated with the deconstruction process<br />
is very similar to the staffing of a demolition job. There are typically five to six<br />
laborers manually working in various areas around the 80,000 square foot complex<br />
<strong>and</strong> one to two supervisory staff managing the work area <strong>and</strong> progress.<br />
The time associated with labor can be designated into two specific areas as follows:<br />
• Deconstruction Activities: Pulling, lifting, cleaning, source separating <strong>and</strong><br />
operating heavy equipment<br />
• Support Services: Supervision, planning, data collection <strong>and</strong> analysis<br />
It is important to note that because of the deconstruction process <strong>and</strong> the need to neatly<br />
separate materials as well as strategically disassemble various sections of the building,<br />
the general contractor reported that the jobsite is much safer. While no budgetary<br />
amount could be associated with the increased level of safety, it may be assumed that<br />
productivity increases as there were few or no accidents on the job.<br />
9/14/05 R. W. Beck 5-7
Section 5<br />
Table 5.5 describes the approximate percentage of total man-hours associated with<br />
each material or system (i.e. HVAC, plumbing, etc.). For the purposes of the study,<br />
Mart staff has estimated on a percentage basis the time associated with each material<br />
class.<br />
Table 5-5<br />
Deconstruction Related Labor Hours by Material<br />
Material<br />
Deconstructing<br />
Activities <strong>and</strong><br />
Support Services<br />
5.2.2.4 Location<br />
L<strong>and</strong> Clearing <strong>and</strong> Fencing 2%<br />
Shingles 2%<br />
Salvaged Equip. & Access. 10%<br />
Carpet & Pad 5%<br />
Ceiling Materials 8%<br />
HVAC 15%<br />
Electrical 10%<br />
Plumbing 10%<br />
Decking 3%<br />
Concrete 5%<br />
CMU Blocks 15%<br />
Wood <strong>and</strong> Metal Studs 5%<br />
Gypsum Board 5%<br />
Finishes 5%<br />
Total 100%<br />
The location of Hensley Field, more specifically its relation to reduction <strong>and</strong> disposal<br />
sites, did not have a significant impact on the operation of the project. Mart staff<br />
stated that since the project was relatively close to the Mart office <strong>and</strong> complex, less<br />
than 10 minutes away, some material was able to be hauled <strong>and</strong> separated for further<br />
processing for various salvage companies. This was most often the case with metals.<br />
In addition, since the Hensley building had several large open spaces, Mart separated<br />
<strong>and</strong> stored much of the material onsite for collection <strong>and</strong> disposal/recycling at a proper<br />
facility. Based on estimates provided by Mart, many of the salvage yards were within<br />
10 miles of the project. This significantly reduced the costs associated with<br />
transportation to a recycling facility.<br />
5-8 R. W. Beck 9/14/05
LEED Deconstruction Case Study<br />
5.2.2.5 End Markets<br />
The deconstructing contractor, Mart, Inc., contacted a number of salvage yards <strong>and</strong><br />
recyclers during the waste management planning process. Mart also worked with<br />
salvage yards to obtain verification ticket information for use during the data<br />
collection phase of this project. Mart staff explained that many salvage yards <strong>and</strong><br />
recyclers may weigh loads <strong>and</strong> maintain internal records, but do not typically provide<br />
that information to the individual. Throughout the project, Mart also stressed the<br />
importance of obtaining all tonnage data to their drivers <strong>and</strong> laborers during loading<br />
<strong>and</strong> transportation to a reduction facility. Table 5.6 describes the types of materials<br />
which were revenue neutral, generated revenue or had a cost associated with disposal.<br />
Table 5-6<br />
Salvaged Materials<br />
Material <strong>Waste</strong> Diverted (Tons) Revenue/(Cost)<br />
Salvaged Equip. & Access. 0.21<br />
Acoustical Ceiling Tile 8.98<br />
Electrical Panels & Switches 5.10<br />
Electrical Transformers 0.47<br />
Plumbing Fixtures 0.63<br />
Plumbing Pipe Copper 3.64<br />
Mezzanine Concrete 11.00<br />
CMU Block 619.45<br />
Total 649.46<br />
Information to be provided upon<br />
completion of Hensley project.<br />
Table 5.7 describes the revenue <strong>and</strong> costs associated with the recycling of various<br />
materials. These materials were sent to a processing facility <strong>and</strong> most had a<br />
processing cost associated with them.<br />
In addition, Mart worked with the Dallas staff to find out how many of the materials<br />
could be refurbished or reused in other buildings. For example, the City of Dallas<br />
chose to reuse all Half Bradley sinks.<br />
Based on discussions with Mart staff, it was very important at the beginning of the<br />
project to establish the markets to not only make an accurate bid, but to show Dallas<br />
staff their commitment to achieving their waste minimization goal. This was also<br />
confirmed by Dallas staff that having a plan already in place that described how <strong>and</strong><br />
where the material would be sent was very instrumental in the overall conduct of the<br />
deconstruction process.<br />
9/14/05 R. W. Beck 5-9
Section 5<br />
Table 5-7<br />
Recycled Materials<br />
Material <strong>Waste</strong> Diverted (Tons) Revenue/(Cost)<br />
L<strong>and</strong> Clearing Debris .13<br />
Lead 4.50<br />
Acoustical Ceiling Grid 3.16<br />
HVAC Ductwork 25.53<br />
HVAC Pipe & Valves 15.45<br />
HVAC Equipment 11.27<br />
Electrical Conduit & Connectors 16.96<br />
Electrical Wiring 7.36<br />
Electrical Ballasts .50<br />
Electrical Light Tubes .34<br />
Electrical Fittings 1.97<br />
Structural Steel 8.78<br />
Decking 4.83<br />
Concrete 1,452.02<br />
Wood Studs & Plywood 11.19<br />
Metal Studs 3.54<br />
Hollow Metal Materials 5.24<br />
Doors 2.79<br />
Total 1,572.56<br />
Information to be provided upon<br />
completion of Hensley Project.<br />
5.2.3 Public Awareness<br />
Aside from the Dallas’ ordinance requiring all new public buildings construction<br />
projects to receive a LEED rating, few new commercial demolition properties in the<br />
North Central Texas region have been deconstructed to receive a LEED rating. While<br />
some firms have been active in LEED deconstruction projects, traditional demolition<br />
of commercial properties continues to surpass LEED deconstruction efforts.<br />
However, as the end markets for deconstruction continue to grow <strong>and</strong> with the support<br />
of local governments <strong>and</strong> implementation of initiatives such as those described in<br />
Section 8, commercial construction firms will become more open to the<br />
deconstruction process.<br />
Firms such as Mart should continue to work with general contractors <strong>and</strong> cities to<br />
promote LEED rated deconstruction projects to divert C&D waste from the waste<br />
stream. This may be accomplished by focusing on the indirect benefits of LEED<br />
deconstruction.<br />
5-10 R. W. Beck 9/14/05
LEED Deconstruction Case Study<br />
5.3 Keys <strong>and</strong> Impediments to Success<br />
Based on research <strong>and</strong> case studies, R. W. Beck identified several keys <strong>and</strong><br />
impediments to a successful LEED Deconstruction project. Keys to success include<br />
the following:<br />
• <strong>Waste</strong> management plans are a key to successful waste minimization efforts, as<br />
these plans provide a complete description of how waste will be managed<br />
throughout all phases of the construction project.<br />
• Communication between the contractor <strong>and</strong> Dallas staff should continue<br />
throughout the project. This may include phone calls, site visits, <strong>and</strong> weekly<br />
meetings.<br />
• Contractors must work with salvage yards <strong>and</strong> recyclers to obtain load<br />
verification tickets upon depositing loads at their facilities. Whenever possible,<br />
loads should be independently verified on-site by deconstruction staff to ensure<br />
accuracy.<br />
• Dallas staff should monitor operations on a day-to-day or weekly basis to observe<br />
the deconstruction process <strong>and</strong> make certain that the waste management plan is<br />
being carried out. Dallas staff should also obtain bi-weekly or monthly reports on<br />
all disposed <strong>and</strong> recycled tonnage data.<br />
• During the planning process it is often best to keep a realistic diversion goal in<br />
mind. It is often unrealistic to recycle or reuse all of the material from a<br />
demolition project. Typically a conservative goal of an 80 percent diversion rate<br />
by weight will capture a significant amount of debris in a cost-effective manner.<br />
Impediments to success include the following:<br />
• Inclement weather may have a negative impact to the storage of materials that are<br />
stockpiled for pickup by a recycler. During the project, the roof was blown off of<br />
the building where ceiling tiles were stockpiled. Because the tiles were properly<br />
wrapped in plastic <strong>and</strong> palletized, they were not significantly damaged. However,<br />
in the future, project managers should be aware that the threat of damage by<br />
weather does exist.<br />
• Currently few deconstruction projects exist in the North Central Texas region.<br />
Therefore few firms in the region have strong qualifications <strong>and</strong> many may not<br />
underst<strong>and</strong> the data collection or operational side of the LEED process.<br />
• Laborers who are familiar with the demolition process may need additional<br />
training <strong>and</strong> guidance during deconstruction. Any language barriers or<br />
performance issues must be addressed by the contractor to ensure that all<br />
recyclable material is separated <strong>and</strong> diverted from the waste stream.<br />
5.4 Cost Benefit Analysis<br />
R. W. Beck analyzed the costs <strong>and</strong> benefits of deconstructing a facility as opposed to<br />
the traditional method of demolition. In order to conduct this cost benefit analysis,<br />
9/14/05 R. W. Beck 5-11
Section 5<br />
R. W. Beck examined all the costs associated with the LEED deconstruction of<br />
Hensley Field conducted by HWH <strong>and</strong> Mart for the City of Dallas.<br />
5.4.1 Financial Analysis<br />
To underst<strong>and</strong> all the costs associated with deconstruction, Mart shared all available<br />
labor, disposal, equipment, salvage <strong>and</strong> recycling related information. In addition,<br />
Mart worked with R. W. Beck to underst<strong>and</strong> the financial benefits <strong>and</strong> indirect<br />
benefits that Mart identified upon completing the deconstruction. The data used to<br />
develop this case study has been provided by Mart <strong>and</strong> the City of Dallas. This data<br />
will also be used during the LEED certification process upon project completion.<br />
Table 5.9 provides the deconstruction costs for the Hensley Field project. In addition,<br />
the table provides the net revenue received through the sale of salvaged materials,<br />
which was approximately $16,000 or 7 percent of the total project cost. This revenue<br />
for the deconstruction firm helped to offset some of the additional labor <strong>and</strong> material<br />
processing costs associated with the deconstruction process. This revenue was<br />
initially estimated at approximately 1 to 2 percent of the total project cost, however<br />
due to the sale of CMU blocks to an individual, the deconstruction firm enjoyed an<br />
additional unplanned benefit.<br />
Table 5-8<br />
Deconstruction Cost Analysis<br />
Category<br />
Deconstruction<br />
Labor 220,000<br />
Equipment 3,050<br />
L<strong>and</strong>fill Disposal 5,591<br />
Material Processing (Recycling) 10,000<br />
Sale of Salvaged Materials (16,215)<br />
Total $222,425<br />
For the purposes of our case study, R. W. Beck worked with HWH <strong>and</strong> Mart to derive<br />
an average cost per square foot if the building were to be demolished. Table 5.9<br />
describes the costs of the deconstruction process in comparison to the demolition of<br />
Hensley Field. As illustrated in the table, the deconstruction process of Hensley Field<br />
was approximately the same cost as demolition would have been. The approximate<br />
cost of demolition of the complex ranged from $200,000 to $280,000.<br />
Table 5-9<br />
Cost Comparison of Solid <strong>Waste</strong> Management Methods<br />
<strong>Demolition</strong><br />
Deconstruction<br />
Approximate Cost $ 200,000 - $ 280,000 $ 220,000 - $ 235,000 1<br />
1 Based on the variability of the sale of salvaged materials, this range provides a more accurate comparison of the two solid<br />
waste management methods.<br />
5-12 R. W. Beck 9/14/05
LEED Deconstruction Case Study<br />
Based on discussions with deconstruction staff, if Hensley Field would have been<br />
demolished, the cost areas would have shifted to reflect more costs for l<strong>and</strong>fill<br />
disposal <strong>and</strong> less for labor <strong>and</strong> material processing.<br />
5.4.2 Indirect Benefits of Deconstruction<br />
While the deconstruction of a commercial property that would ultimately be<br />
demolished, may be a revenue neutral method of addressing C&D waste minimization.<br />
There are many indirect benefits of deconstruction process that could potentially lead<br />
to a change in the demolition industry.<br />
5.4.2.1 Risk Mitigation<br />
Based on discussions with Mart <strong>and</strong> HWH staff, the safety associated with<br />
deconstruction is at a much higher level than demolition. In addition, staff commented<br />
that no budget amount could be associated with the increased level of safety. In the<br />
future, if Mart were to take on more deconstruction projects, they may realize a<br />
decrease in insurance premiums <strong>and</strong> employee workers compensation claims.<br />
An indirect benefit associated with Hensley Field was that the contractors were able to<br />
see productivity increase on a day-to-day basis as there were few or no accidents in the<br />
various phases of the deconstruction process. This allowed the project to stay on<br />
schedule <strong>and</strong> allowed some operations to move in ahead of schedule.<br />
5.4.2.2 Cleaner Work Environment<br />
Due to the systematic process involved in the deconstruction process, a clean <strong>and</strong><br />
orderly work environment is necessary. Not only does this contribute to risk<br />
mitigation for laborers, it provides a clean workplace for all staff.<br />
5.4.2.3 Future Indoor Air Quality<br />
Appropriate steps were taken by Mart <strong>and</strong> Dallas during planning <strong>and</strong> deconstruction<br />
to ensure that the HVAC system was properly protected against airborne materials.<br />
Dallas <strong>and</strong> its employees may realize a benefit in the future with raised levels of<br />
indoor air quality. While no cost can be associated with this benefit, utilization of the<br />
deconstruction process helped to provide employees with a healthy work environment<br />
by protecting them from airborne materials such as dust.<br />
5.4.2.4 <strong>Waste</strong> Reduction<br />
Based on the data provided by HWH <strong>and</strong> Mart, the deconstruction of Hensley Field<br />
diverted approximately 2,222 tons of waste from l<strong>and</strong>fills in the North Central Texas<br />
region. Approximately 97 percent of the waste, based on overall tonnage, from Phase I<br />
of this project was diverted. Based on EPA estimates approximately 44 percent of the<br />
C&D waste stream is derived from demolition activities. Therefore, deconstruction<br />
implemented on a broader scale would have the opportunity to have a substantial<br />
impact on the life of l<strong>and</strong>fills in the North Central Texas region.<br />
9/14/05 R. W. Beck 5-13
Section 5<br />
5.5 Key Findings <strong>and</strong> Recommendations<br />
1. The deconstruction of commercial buildings in the North Central Texas region is<br />
feasible for implementation based on the economic <strong>and</strong> indirect benefits achieved<br />
through this process.<br />
2. R. W. Beck’s recommends based on its initial analysis of the C&D waste stream<br />
<strong>and</strong> deconstruction in the North Central Texas region, developing infrastructure<br />
<strong>and</strong> a market for C&D materials is imperative in the region for the continued<br />
expansion of C&D waste minimization efforts. To accomplish this, the region<br />
should pursue the development of a C&D MRF. Prior to establishing a C&D<br />
MRF in the region, a more thorough <strong>and</strong> detailed analysis should be conducted.<br />
The conduct of this analysis should focus on identifying the location, size <strong>and</strong><br />
market for the C&D MRF.<br />
3. From an operational perspective, deconstruction may require additional training of<br />
low-skilled <strong>and</strong> semi-skilled labor to ensure that the maximum amount of C&D<br />
waste is diverted from the waste stream.<br />
4. The establishment of a waste management plan helps to ensure that contractors<br />
have a set of established goals <strong>and</strong> guidelines which they can follow throughout<br />
the course of the deconstruction process. In conjunction with LEED building<br />
m<strong>and</strong>ates, the institution of a waste management planning policy prior to the<br />
construction or deconstruction process may improve future projects the City of<br />
Dallas undertakes.<br />
5. Deconstruction has many indirect benefits, including risk mitigation, waste<br />
reduction <strong>and</strong> jobsite cleanliness, which contribute to its feasibility for<br />
implementation on a greater scale in the North Central Texas region.<br />
5-14 R. W. Beck 9/14/05
Section 6<br />
LEED Renovation Case Study<br />
6.1 General Description<br />
Renovation is generally defined as the modification or rehabilitation of the interior<br />
<strong>and</strong>/or exterior of an existing structure. Green building practices may be applied to<br />
renovation activities through the recovery of various building materials. This process<br />
can serve as an effective way of reducing the amount of recoverable materials from<br />
entering the waste stream. Typical renovation activities include, but are not limited to:<br />
• Interior replacement;<br />
• Partition/wall construction;<br />
• Machinery/appliance installation; <strong>and</strong><br />
• Other finish-out activities.<br />
Renovation is one of the many activities under the LEED system. Since these<br />
structures are typically much larger than homes, the potential impact from commercial<br />
buildings on the waste stream is significant. Instituting a program, such as LEED, is<br />
one way to encourage waste minimization activities in commercial building. For a<br />
definition of the LEED rating system, please see Section 5.<br />
6.2 Implementation<br />
R. W. Beck focused its case study research on the renovation of a single commercial<br />
building <strong>and</strong> the materials <strong>and</strong> resources component of the LEED rating system. The<br />
Hensley Field Operations Center 25 (Hensley Field), that now houses the Equipment<br />
<strong>and</strong> Building Services Division for the City of Dallas (Dallas), was chosen as the<br />
subject of the case study analysis.<br />
The Hensley Field project is a two-phase partial demolition <strong>and</strong> renovation project<br />
under the management of the Environmental Services Division for Dallas. For the<br />
purposes of the analysis, Phase I represents the deconstruction phase of the project <strong>and</strong><br />
Phase II represents the renovation phase. R. W. Beck has divided the two phase<br />
project into two case studies, Section 5 focuses on deconstruction <strong>and</strong> Section 6 on<br />
renovation.<br />
R. W. Beck chose to analyze each phase separately due to fundamental differences in<br />
the process as well as the potential impact on the waste stream. However, for the<br />
purposes of LEED accreditation, the City of Dallas will submit the Hensley Field<br />
Project as a single project, as opposed to two phases.<br />
9/14/05
Section 6<br />
As discussed in Section 5, Hensley Field is an 80,000 square foot complex that will<br />
house the fleet maintenance operations for all City of Dallas departments as well as<br />
retrofitting of all police automobiles. It is located in the west central area of Dallas on<br />
the closed Hensley Air Force Base. Included at the conclusion of this section are<br />
photographs of the facility taken during renovation.<br />
Harrison Walker Harper (HWH) is the acting construction management firm for the<br />
Hensley Field project <strong>and</strong> is responsible for all aspects of the process. Mart has been<br />
retained as a subcontractor to HWH to assist in the conduct of the renovation<br />
operations for Phase II of the Hensley Field project.<br />
6.2.1 Program Requirements<br />
The Hensley Field Project with Phases I <strong>and</strong> II submitted together as a joint project,<br />
will be one of the first few LEED accredited project for the City of Dallas. 1 As a<br />
result of implementing the deconstruction <strong>and</strong> renovation process, Dallas hopes to<br />
receive a LEED Silver rating for the deconstruction <strong>and</strong> renovation of the building.<br />
The LEED Silver rating is issued to projects that have diverted more than 80 percent<br />
of their potential waste from the waste stream.<br />
6.2.2 Solid <strong>Waste</strong> Management<br />
The renovation process is very different from deconstruction or new construction from<br />
a waste management perspective. While some in the industry consider the renovation<br />
process to include both the demolition <strong>and</strong> remodeling of a structure, R. W. Beck has<br />
chosen to focus on each phase separately based on the different operational<br />
considerations for each phase. The primary differences include:<br />
• Impact on the waste stream;<br />
• Type of waste generated;<br />
• Amount of subcontractor personnel on-site; <strong>and</strong><br />
• Time associated with materials h<strong>and</strong>ling.<br />
6.2.2.1 Materials<br />
HWH <strong>and</strong> Mart diverted approximately 116 tons of waste from the waste stream<br />
during Phase II. This equates to approximately 78 percent of the total waste generated<br />
during Phase II.<br />
It is important to again note, that for LEED purposes the Phase II renovation project<br />
was not considered a st<strong>and</strong>-alone project. Since over 2,222 tons of waste was diverted<br />
in Phase I, it took approximately 27 tons to increase the total diversion percentage one<br />
percentage point during Phase II; therefore some waste materials that could have been<br />
diverted were taken instead to the l<strong>and</strong>fill. From the contractor’s perspective, it was<br />
difficult to justify spending additional time <strong>and</strong> money on waste diversion activities<br />
1<br />
McCommas EcoPark, which was completed almost four years ago, recently achieved final<br />
certification.<br />
6-2 R. W. Beck 9/14/05
LEED Renovation Case Study<br />
when the impact on the total diversion rate was minimal. Based on discussions with<br />
HWH <strong>and</strong> Mart, the amount of miscellaneous construction waste sent to the l<strong>and</strong>fill<br />
could have been reduced, if this had been a st<strong>and</strong>-alone project.<br />
The materials discussed in this section are typically characterized as packaging, excess<br />
materials, miscellaneous construction waste. The materials <strong>and</strong> the tonnage diverted is<br />
illustrated in Table 6-1.<br />
Table 6-1<br />
Phase Two – Material Recovery Results<br />
Materials Processed (Tons)<br />
Percentage<br />
Category<br />
Total<br />
Diverted Disposed<br />
Recycled<br />
Sheetrock 1.71 1.71 100%<br />
Wood Framing & pallets 7.37 7.27 100%<br />
Short Steel 2.39 2.39 100%<br />
Iron Pipe 6.81 6.81 100%<br />
Cardboard 0.76 0.76 100%<br />
Tin 2.86 2.86 100%<br />
Misc. construction waste 32.11 32.11 0%<br />
Asphalt 94.25 94.25 100%<br />
Misc. copper 0.15 0.15 100%<br />
Total 116.20 32.11 148.31<br />
Packaging<br />
Packaging materials constituted approximately 8.04 tons of the waste diverted. This<br />
equates to approximately 5.41 percent of the waste generated in Phase II. Packaging<br />
materials h<strong>and</strong>led during Phase II were generally old corrugated cardboard (OCC) <strong>and</strong><br />
wooden framing <strong>and</strong> pallets.<br />
Old Corrugated Cardboard<br />
OCC was generated from the packaging used during shipment of equipment,<br />
machinery <strong>and</strong> parts. OCC was primarily recovered <strong>and</strong> stored in a dry area during<br />
periods where large amounts of deliveries were made to the project. HWH <strong>and</strong> Mart<br />
staff explained that during these times, manual labor personnel would separate <strong>and</strong><br />
store as much OCC as possible. However, during times where deliveries were sparse,<br />
all OCC received would be disposed by contractor staff.<br />
The primary reason for disposing of OCC was because during low volume periods it<br />
was not cost effective for them to recycle it. Since OCC is a light yet bulky it takes<br />
significant amounts of material to have enough to haul to the recycler. Approximately<br />
0.76 tons of OCC was recycled, which equates to approximately 0.05 percent of the<br />
entire waste generated in Phase II. Based on discussions with HWH <strong>and</strong> Mart,<br />
pproximately 80 percent of all OCC was diverted from the waste stream.<br />
9/14/05 R. W. Beck 6-3
Section 6<br />
Wooden Pallets<br />
Wooden pallet waste was generated when large bulky items were delivered to the<br />
Hensley Field. Much like OCC, the availability of wooden pallets for recycling varied<br />
greatly due to the schedule of deliveries to the site. During Phase II, the wooden<br />
pallets were stacked <strong>and</strong> stored in a dry area <strong>and</strong> shipped to a recycler.<br />
Approximately 1.45 tons of wooden pallets were recycled, which equates to<br />
approximately 1.0 percent of the entire waste generated in Phase II. Approximately<br />
100 percent of the wooden pallets were diverted from the l<strong>and</strong>fill.<br />
Excess Materials<br />
The excess materials category describes those materials the waste generated during the<br />
renovation production. These activities include general construction of the interior,<br />
electrical work, duct work, <strong>and</strong> plumbing. These waste materials generated in this<br />
phase were wooden framing, metals, sheetrock, <strong>and</strong> asphalt.<br />
Wooden Framing<br />
Framing from the various walls <strong>and</strong> surfaces constructed during Phase II of the<br />
Hensley Field project accounted for approximately 5.82 tons or 3.92 percent of the<br />
total waste generated. Wooden framing constituted a small portion of the overall<br />
waste since there are many large, open spaces throughout building.<br />
Metals<br />
Metals recovered from the Hensley Project included tin, iron pipe, copper <strong>and</strong> short<br />
steel. These materials were primarily generated from plumbing <strong>and</strong> electrical work<br />
conducted during the renovation. Based on discussions with HWH <strong>and</strong> Mart, excess<br />
metals are typically the most valuable waste material, therefore most of it is diverted<br />
from the waste stream.<br />
Approximately 12.21 tons of metals were recycled, which equates to approximately<br />
8.22 percent of the entire waste generated in Phase II. HWH <strong>and</strong> Mart estimate that<br />
nearly 100 percent of the metals were recovered <strong>and</strong> recycled.<br />
Sheetrock<br />
The sheetrock waste generated at Hensley Field was a product of constructing the<br />
interior walls within the building. All sheetrock was clean with no finishes, <strong>and</strong><br />
therefore ground <strong>and</strong> used as a soil amendment. The sheetrock was placed in a berm<br />
outside Hensley Field, that would have otherwise been constructed with fill dirt.<br />
Approximately 1.71 tons of sheetrock was recycled, which equates to approximately<br />
1.10 percent of the entire waste generated in Phase II. HWH <strong>and</strong> Mart estimate that<br />
nearly 100 percent of the sheetrock was recovered <strong>and</strong> ground on-site.<br />
Asphalt<br />
Asphalt around the exterior of the building was removed <strong>and</strong> hauled to the Big City<br />
Concrete Crushing facility for reduction <strong>and</strong> recycling. This accounted for 94.25 tons<br />
of material or approximately 63.54 percent of the total waste generated in Phase II.<br />
Approximately 100 percent of the asphalt was recycled.<br />
6-4 R. W. Beck 9/14/05
LEED Renovation Case Study<br />
Miscellaneous <strong>Construction</strong> <strong>Waste</strong><br />
Miscellaneous construction waste consists of various types of waste that could not be<br />
easily recycled. Components of this type of waste include municipal solid waste<br />
(MSW) generated by personnel, packaging <strong>and</strong> other excess materials. For example,<br />
recyclable materials such as acoustic ceiling tiles or HVAC insulation that could have<br />
been recycled were disposed because there was not enough material to make it costeffective<br />
for the contractor.<br />
Miscellaneous construction waste accounted for approximately 32.1 tons of materials,<br />
which is approximately 21.6 percent of the total waste generated in Phase II. All of<br />
the miscellaneous construction waste was l<strong>and</strong>filled. Based on discussions with HWH<br />
<strong>and</strong> Mart, the amount of miscellaneous construction waste l<strong>and</strong>filled could have been<br />
decreased, if this had been a st<strong>and</strong>-alone project.<br />
6.2.2.2 Staffing/Operational<br />
Based on discussions with HWH <strong>and</strong> Mart staff, labor associated with Phase II was<br />
very similar to the staffing of a traditional renovation project. Staff included<br />
management personnel, laborers, <strong>and</strong> subcontractor staff. The total HWH <strong>and</strong> Mart<br />
staff dedicated in part or whole to waste minimization activities was approximately six<br />
management <strong>and</strong> staff personnel.<br />
Table 6-2 describes the labor hours for all on-site staff. These hours reflect the<br />
estimated number of hours dedicated to C&D waste minimization activities.<br />
Table 6-2<br />
Estimated Labor Hours<br />
Personnel<br />
Estimated Project<br />
Labor Hours<br />
Responsibilities<br />
Site Superintendent<br />
Site management <strong>and</strong> LEED<br />
24<br />
documentation<br />
Site Assistant<br />
Supervise laborers <strong>and</strong> monitors<br />
168<br />
waste disposal activities<br />
Laborer 240<br />
Inspect bins <strong>and</strong> dumpsters,<br />
Laborer 240<br />
removal <strong>and</strong> loading of all C&D<br />
Laborer 240<br />
waste<br />
Laborer 240<br />
Subcontractors N/A Sort materials into material bins<br />
Total 1,152<br />
Project Manager<br />
The project manager oversaw various aspects of the project since its initiation<br />
including building design, construction <strong>and</strong> waste management planning, <strong>and</strong> acting as<br />
liaison for Dallas during the renovation. The project manager worked very closely<br />
with all related parties during the five month process including attending regular<br />
9/14/05 R. W. Beck 6-5
Section 6<br />
weekly meetings, offering input regarding waste minimization <strong>and</strong> analyzing<br />
preliminary tonnage data.<br />
Site Management<br />
Management staff included the site superintendent <strong>and</strong> site assistant. The site<br />
superintendent was responsible for general oversight management <strong>and</strong> LEED<br />
documentation. The site superintendent recorded <strong>and</strong> tracked all waste minimization<br />
activities for LEED accreditation <strong>and</strong> developed the waste management plan. In<br />
addition, he made decisions regarding the point at which it was not cost-effective to<br />
engage in waste minimization activities. The site superintendent dedicated<br />
approximately five percent of his time to waste minimization activities.<br />
The site assistant worked directly with laborers <strong>and</strong> was responsible for their daily<br />
activities. In addition, the site assistant inspected dumpsters to ensure that a limited<br />
amount of recyclable material was disposed <strong>and</strong> inspected waste storage areas to<br />
minimize contamination in the recyclables. The site assistant reported directly to the<br />
site superintendent regarding waste minimization activities. Approximately 35 to 40<br />
percent of the site assistant’s time was dedicated to waste minimization activities.<br />
Laborers<br />
Laborers were responsible for waste collection, sorting <strong>and</strong> storage activities. There<br />
were approximately four laborers that dedicated approximately 50 percent of their<br />
time to waste minimization activities. This included pulling recyclable materials from<br />
the dumpsters, maintaining recyclable storage bins <strong>and</strong> areas, collecting <strong>and</strong> hauling<br />
materials to recycling site.<br />
Laborers manually collected, stored <strong>and</strong> loaded the majority of the C&D waste<br />
recycled or disposed. Since most of the material was lightweight, laborers lifted <strong>and</strong><br />
carried material to storage bins or areas without any problems. Heavy equipment was<br />
only used during the collection of asphalt.<br />
Subcontractor Staff<br />
Subcontractor personnel were responsible for setting out packaging <strong>and</strong> excess<br />
materials for recycling. Subcontractors are specialized staff hired on a temporary<br />
basis through HWH <strong>and</strong> Mart. There were approximately 15 different subcontractors<br />
hired for the Hensley Field Project. While HWH <strong>and</strong> Mart may have worked with<br />
these subcontractors on previous engagements this was not always the case.<br />
Subcontractors were used intensely throughout the course of Phase II, unlike Phase I<br />
where subcontractors were used sparingly. The subcontractors were instructed by<br />
management personnel that during the course of their regular activities to separate<br />
packaging <strong>and</strong> excess materials for recycling. However, HWH <strong>and</strong> Mart staff<br />
explained that many of these subcontractors are not knowledgeable in the value or<br />
process of C&D waste minimization activities. They noted that it was difficult in<br />
Phase II to convince many of the subcontractors to participate in waste minimization<br />
strategies.<br />
6-6 R. W. Beck 9/14/05
LEED Renovation Case Study<br />
6.2.2.3 Location<br />
The location of Hensley Field, more specifically its relation to reduction <strong>and</strong> disposal<br />
sites, did not have a significant impact on the operation of the project based on input<br />
provided by the contractors. Hauling to these sites was typically one to two hours per<br />
load roundtrip. The hauling time to the various reduction facilities was comparable to<br />
time it took to send the material to the l<strong>and</strong>fill.<br />
In addition, since the Hensley building had several large open spaces, Mart separated<br />
<strong>and</strong> stored much of the material onsite for collection <strong>and</strong> disposal/recycling at a proper<br />
facility. Based on estimates provided by Mart, many of the salvage yards were within<br />
10 miles of the project. This significantly reduced the costs associated with<br />
transportation to a recycling facility.<br />
6.2.2.4 End Markets<br />
Mart <strong>and</strong> HWH used many of the same recyclers, concrete crushers, <strong>and</strong> salvage yards<br />
that were used in Phase I. To complete the LEED accreditation process, HWH <strong>and</strong><br />
Mart worked with recyclers to obtain verification ticket information for use during the<br />
data collection phase of this project. Mart staff explained that many salvage yards <strong>and</strong><br />
recyclers may weigh loads <strong>and</strong> maintain internal records, but do not typically provide<br />
that information to the customer. Throughout the project, Mart also stressed the<br />
importance of obtaining all tonnage data to their drivers <strong>and</strong> laborers during loading<br />
<strong>and</strong> transportation to a reduction facility. The cost per ticket per load was<br />
approximately $10 to $15. The ticket cost covered the equipment <strong>and</strong> administrative<br />
costs associated with weighing <strong>and</strong> printing the ticket.<br />
Table 6-3 illustrates the tonnage generated in Phase II sorted by material <strong>and</strong> waste<br />
management method.<br />
Table 6-3<br />
Material Recovered or Disposed during Renovation<br />
Material<br />
Tonnage<br />
<strong>Waste</strong> Management<br />
Method<br />
Sheetrock 1.71 On-Site Grinding<br />
Wood Framing & pallets 7..37 Recycler<br />
Short Steel 2.39 Salvage/Scrap<br />
Iron Pipe 6.81 Salvage/Scrap<br />
Cardboard 0.76 Recycler<br />
Tin 2.86 Salvage/Scrap<br />
Misc. construction waste 32.11 L<strong>and</strong>fill Disposal<br />
Asphalt 94.25 Concrete Crushing<br />
Misc. copper 0.15 Salvage/Scrap<br />
Total 148.31<br />
9/14/05 R. W. Beck 6-7
Section 6<br />
6.2.3 Public Awareness<br />
As discussed in the Section 6.2.2.2, HWH <strong>and</strong> Mart noted that many subcontractors<br />
were not aware of C&D waste minimization practices or did not care about diverting<br />
C&D waste. In addition, the subcontractors’ agreement stated that they would be<br />
required to only take trash to the general contractor provided dumpsters or that they<br />
were not required to participate in C&D waste minimization strategies.<br />
Aside from the Dallas’ ordinance requiring all new public buildings construction<br />
projects to receive a LEED rating, few new commercial renovation properties in the<br />
North Central Texas region have been LEED accredited. While some firms have been<br />
active in LEED projects, traditional renovation of commercial properties continues to<br />
surpass LEED efforts. However, if the end markets for materials continue to grow <strong>and</strong><br />
with the support of local governments <strong>and</strong> implementation of initiatives such as those<br />
described in Section 8, commercial construction firms may become more open to this<br />
process.<br />
Firms such as Mart should continue to work with general contractors <strong>and</strong> cities to<br />
promote LEED rated projects to divert C&D waste from the waste stream.<br />
6.3 Keys <strong>and</strong> Impediments to Success<br />
Based on research <strong>and</strong> case studies, R. W. Beck identified several keys <strong>and</strong><br />
impediments to a successful LEED renovation project. Keys to success include the<br />
following:<br />
• Materials such as sheetrock <strong>and</strong> wood wastes should be ground <strong>and</strong> used on-site<br />
to avoid tipping fees <strong>and</strong> transportation costs. Depending on the amount of wood<br />
<strong>and</strong> sheetrock wastes generated during commercial renovation, the amount of<br />
material may vary.<br />
• Dallas staff should monitor operations on a day-to-day or weekly basis to observe<br />
the renovation process <strong>and</strong> make certain that the waste management plan is being<br />
carried out. Dallas staff should also obtain bi-weekly or monthly reports on all<br />
disposed <strong>and</strong> recycled tonnage data.<br />
• It is often unrealistic to recycle or reuse all of the material from a renovation<br />
project. Typically a conservative goal of an 80 percent diversion rate by weight<br />
will capture a significant amount of debris in a cost-effective manner.<br />
• A general contractor’s legal agreement with subcontractors should specifically<br />
state that they are required to participate in C&D waste minimization strategies<br />
such as source separating <strong>and</strong> material storage.<br />
Impediments to success include the following:<br />
• An isolated renovation is an overall lower amount of waste generated in<br />
renovation projects in relation to deconstruction or new construction projects.<br />
Often it is difficult to gain a significant amount of material to make the process<br />
very cost effective.<br />
6-8 R. W. Beck 9/14/05
LEED Renovation Case Study<br />
• There is a significant burden on the site superintendent to balance production<br />
versus waste minimization activities. If too much time is spent on waste<br />
minimization activities, it may affect the overall timing of the project <strong>and</strong><br />
productivity of staff.<br />
• Markets for some materials such as carpet <strong>and</strong> tile have not been developed in the<br />
North Central Texas region, therefore making it difficult to divert material from<br />
the waste stream.<br />
• Since over 2,222 tons of waste was diverted in Phase I, it took approximately 27<br />
tons to increase the total diversion percentage one percentage point during Phase<br />
II, therefore some waste materials that could have been diverted were taken<br />
instead to the l<strong>and</strong>fill. From the contractor’s perspective, it was difficult to justify<br />
spending additional time <strong>and</strong> money on waste diversion activities when the<br />
impact on the total diversion rate was minimal. Based on discussions with HWH<br />
<strong>and</strong> Mart, the amount of miscellaneous construction waste sent to the l<strong>and</strong>fill<br />
could have been decreased if this had been a st<strong>and</strong>-alone project.<br />
6.3.1 Cost-Benefit Analysis<br />
R. W. Beck analyzed the costs <strong>and</strong> benefits of renovating a facility in comparison to<br />
traditional methods. In order to conduct this cost benefit analysis, R. W. Beck<br />
examined all the costs associated with Phase II of the Hensley Field Project.<br />
This analysis focuses solely on the time associated with HWH <strong>and</strong> Mart staff to<br />
conduct waste minimization activities for renovation compared to conducting it in a<br />
traditional method. R. W. Beck recognizes that there is some time associated with<br />
subcontractor staff; however, this has been omitted from the analysis since an accurate<br />
estimate could not be obtained.<br />
Table 6.4 illustrates the estimated costs associated with waste minimization activities<br />
under a LEED renovation project compared to the traditional method. R. W. Beck<br />
assumes that the project time is approximately three months working 40 hours per<br />
week. The disposal costs is based on the $47 per ton cost at the Irving L<strong>and</strong>fill.<br />
Material offsets have been estimated based on the sale of recyclable material including<br />
metals <strong>and</strong> other salvageable materials. Transportation costs have been omitted from<br />
this analysis since most material would be transported to a recycler/salvage yard or<br />
l<strong>and</strong>fill.<br />
The total net cost of the traditional renovation compared to the LEED renovation<br />
method is approximately $2,500. From a cost per ton perspective, the LEED<br />
renovation method costs approximately $79 per ton opposed to approximately $65 for<br />
the traditional method.<br />
Based on discussions with HWH <strong>and</strong> Mart staff, they stated that they would pay up to<br />
$75 per ton of waste generated for disposal <strong>and</strong>/or reduction. The $79 per ton<br />
estimated by R. W. Beck for labor <strong>and</strong> disposal for this LEED Renovation project<br />
could fall within the range of a cost per ton that contractors would be willing to pay.<br />
9/14/05 R. W. Beck 6-9
Section 6<br />
Table 6-4<br />
Cost Analysis<br />
Personnel<br />
Cost of<br />
Cost of<br />
LEED Renovation<br />
Traditional Renovation<br />
Site Superintendent $ 600 $ 120<br />
Site Assistant $ 2,520 $ 720<br />
Labor $ 9,600 $ 2,400<br />
Disposal 1 $ 1,500 $ 6,970<br />
Material Offsets ($ 2,500) ($ 1,000)<br />
Total $ 11,720 $ 9,210<br />
Note:<br />
The disposal costs calculated for the cost benefit analysis may be slightly higher than normal, since the<br />
tipping fee at the Irving L<strong>and</strong>fill is higher than other l<strong>and</strong>fills in the region.<br />
The labor costs associated with the LEED renovation project are approximately four<br />
times the cost of a traditional remodeling project. However, the costs for disposal in<br />
the traditional remodeling method is approximately four <strong>and</strong> a half times the cost in a<br />
LEED renovation project. Based on input provided by HWH <strong>and</strong> Mart, the disposal<br />
costs could have been reduced further had this been a st<strong>and</strong>-alone renovation project.<br />
R. W. Beck would like to stress that Phase II of the Hensley Field Project was solely<br />
focused on the renovation of the building. All deconstruction of the interior of the<br />
building was accomplished as a part of Phase I. This case study may not exactly<br />
compare with other renovation or complete demolition projects, since they may<br />
encompass tasks outside the scope of this project.<br />
6.4 Key Findings <strong>and</strong> Recommendations<br />
1. On a cost per ton basis, the labor <strong>and</strong> disposal costs associated with waste<br />
minimization activities is approximately $79. The $79 per ton includes labor <strong>and</strong><br />
disposal associated with the removal <strong>and</strong> processing of waste. The cost per ton is<br />
competitive with the $65 per ton rate for the traditional method of renovation<br />
2. Labor costs for LEED certified projects may increase compared to traditional<br />
renovation projects, however these costs can be offset by avoiding tipping fees at<br />
the l<strong>and</strong>fill <strong>and</strong> the sale of recoverable materials.<br />
3. Revenue generated from the sale of recyclable material is significantly lower in<br />
Phase II of the project since much of the material generated is considered<br />
packaging or excess material. The economic benefit in LEED renovations is the<br />
cost avoidance associated with tipping fees.<br />
4. Based on input provided by HWH <strong>and</strong> Mart, the overall project time associated<br />
with the completion of Phase II was not affected significantly by the waste<br />
minimization strategies required by the City of Dallas.<br />
5. Through the use of source separating techniques, renovation projects have the<br />
ability to divert a significant amount of the project’s total waste from the l<strong>and</strong>fill.<br />
6-10 R. W. Beck 9/14/05
LEED Renovation Case Study<br />
In Phase II of the Hensley Field Project, HWH <strong>and</strong> Mart was able to divert nearly<br />
75 percent of the total waste by weight.<br />
6. In projects seeking LEED accreditation, provisions in subcontractor’s legal<br />
agreements should include clauses designating that wastes generated on-site<br />
should be recycled or reused on-site. This would provide general contractors with<br />
more control of subcontractor’s disposal methods.<br />
7. General contractors should educate their subcontractors on C&D waste<br />
minimization strategies prior to beginning work on a LEED renovation project.<br />
8. R. W. Beck’s recommendation based on its initial analysis of the C&D waste<br />
stream <strong>and</strong> construction projects in the North Central Texas region, developing<br />
infrastructure <strong>and</strong> a market for C&D materials is imperative in the region for the<br />
continued expansion of C&D waste minimization efforts. To accomplish this, the<br />
region should pursue the development of a C&D MRF. Prior to establishing a<br />
C&D MRF in the region, a more thorough <strong>and</strong> detailed analysis should be<br />
conducted. The conduct of this analysis should focus on identifying the location,<br />
size <strong>and</strong> market for the C&D MRF.<br />
9. R. W. Beck would like to stress that Phase II of the Hensley Field Project was<br />
solely focused on the renovation of the building. All deconstruction of the interior<br />
of the building was accomplished as a part of Phase I. This case study may not<br />
completely compare with other renovation or complete demolition projects, since<br />
they may encompass tasks outside the scope of this project. R. W. Beck<br />
recommends that a contractor or a city use this case study as a planning tool <strong>and</strong><br />
each project must be assessed on a case-by-case basis.<br />
9/14/05 R. W. Beck 6-11
Section 6<br />
(This page intentionally left blank)<br />
6-12 R. W. Beck 9/14/05
Section 7<br />
Best Management Practices<br />
Many in the construction <strong>and</strong> recycling industries are unfamiliar or unaware of waste<br />
minimization strategies, therefore providing guidance to industry are one of the most<br />
important issues that should be addressed in the region. The best management<br />
practices for C&D waste minimization focus on providing the private sector with the<br />
tools, resources <strong>and</strong> information to successfully implement waste minimization<br />
strategies.<br />
7.1 Practical Application of <strong>Waste</strong> <strong>Minimization</strong><br />
Practices<br />
Achieving “buy-in” from the construction <strong>and</strong> recycling industry is one of the most<br />
important tasks when trying to increase C&D waste minimization efforts. Since the<br />
construction industry is the primary source of waste generation, R. W. Beck has<br />
provided information on the steps that they can take to minimize C&D waste that is<br />
disposed in the l<strong>and</strong>fill.<br />
7.1.1 New <strong>Construction</strong><br />
New construction from residential <strong>and</strong> commercial properties makes up approximately<br />
eight percent of the C&D waste stream. <strong>Waste</strong> minimization strategies implemented<br />
by new construction firms can divert a significant amount of waste from l<strong>and</strong>fills.<br />
Based on R. W. Beck’s case study research <strong>and</strong> review of available literature,<br />
incorporating waste minimization strategies at the beginning of a project can be cost<br />
effective or revenue neutral compared to traditional waste disposal methods.<br />
The following strategies can be incorporated into new construction for residential <strong>and</strong><br />
commercial building:<br />
7.1.1.1 Residential<br />
• Subcontracting on-site grinding services to divert wood, stone/masonry, <strong>and</strong><br />
gypsum from the waste stream. (Section 4)<br />
• Source separate materials such as wood, drywall, metals in specific bins placed<br />
around the jobsite to be collected by a recycler. (Section 4)<br />
• Collect excess materials in a commingled container <strong>and</strong> haul the waste to a C&D<br />
MRF (Section 3)<br />
• Source separate materials in separate bins for other homes within the<br />
development. (Section 4)<br />
9/14/05
Section 7<br />
• Use a mulch berm or soil tubes as an alternative to traditional silt fencing.<br />
(Section 4)<br />
• Greater efficiency in the use of building materials.<br />
7.1.1.2 Commercial<br />
• Establish a waste management plan in concurrence with the LEED rating system<br />
to achieve a certification on waste minimization efforts. (Section 5)<br />
• Apply for a temporary on-site concrete crushing permit to reduce concrete <strong>and</strong><br />
haul to an appropriate facility. (Section 9)<br />
• Collect excess materials in a commingled container <strong>and</strong> haul the waste to a C&D<br />
MRF (Section 3)<br />
• Subcontracting on-site grinding services to divert wood, stone/masonry, <strong>and</strong><br />
gypsum from the waste stream. (Section 4)<br />
7.1.2 Deconstruction<br />
The complete demolition of buildings <strong>and</strong> homes accounts for approximately 48<br />
percent of the C&D waste stream, based on data published by the US EPA. The<br />
ability to divert a portion of that waste through the practice of deconstruction, instead<br />
of demolition, could have a significant impact on the l<strong>and</strong>fills in the North Central<br />
Texas region. The following information describes the process for a typical<br />
deconstruction project seeking LEED certification.<br />
<strong>Waste</strong> Management Planning<br />
A waste management plan should be written <strong>and</strong> include, but not be limited to the<br />
following sections:<br />
• <strong>Waste</strong> <strong>Minimization</strong> Goals<br />
• Communication Plan<br />
• <strong>Construction</strong> Plan<br />
• Verification Procedures<br />
• Indoor Air Quality Procedures<br />
Execution of Contract<br />
In order to monitor the deconstruction process <strong>and</strong> ensure that the waste management<br />
plan is followed, a city/county staff member should dedicate a portion of their time to<br />
this task during the deconstruction process. The person should act as a liaison<br />
between the City <strong>and</strong> deconstruction firm to make certain that all activities are safe<br />
<strong>and</strong> that the waste minimization activities are carried out.<br />
The firm should hold meetings prior to deconstruction to discuss any operational<br />
barriers that may exist. The liaison may have frequent contact with the firm <strong>and</strong><br />
schedule regular site visits to observe the execution of the contract.<br />
7-2 R. W. Beck 9/14/05
Best Management Practices<br />
Based on the discussion with deconstruction management firms, the deconstruction<br />
process may require additional labor hours during the actual dismantling process. This<br />
process may often increase the time of the project in comparison to the more<br />
traditional demolition methods.<br />
Collection of Data<br />
As outlined under the verification procedures of the waste management plan, the<br />
deconstruction firm must have the ability to accurately collect <strong>and</strong> report on the<br />
amount of waste generated from the deconstruction <strong>and</strong> diverted from the waste<br />
stream. This information should be regularly collected <strong>and</strong> reported on to the City to<br />
be used for submission under the LEED rating system. The data collected should have<br />
proper verification <strong>and</strong> support documentation to ensure that no falsification of data<br />
occurs.<br />
LEED Rating System<br />
The LEED rating system is based on data collected throughout the course of the<br />
deconstruction process <strong>and</strong> must be submitted to the US Green Building Council<br />
(USGBC). By establishing a waste management plan which ensures the careful<br />
collection all the waste data (including waste which has been diverted <strong>and</strong> disposed), a<br />
building should have the required information to receive the desired rating level<br />
following the project completion <strong>and</strong> data submission.<br />
7.1.3 Renovation<br />
Based on data published by the US EPA, traditional renovation projects account for<br />
approximately 44 percent of the C&D waste stream. Diverting a portion of renovation<br />
waste could have a significant impact on the l<strong>and</strong>fills in the North Central Texas<br />
region.<br />
Since the requirements for waste minimization activities under the LEED rating<br />
system are universal steps identified in Section 7.1.2 they can also be applied to<br />
renovation projects including:<br />
• <strong>Waste</strong> management planning<br />
• Contract execution<br />
• Data collection<br />
• LEED certification process<br />
In addition to these steps listed above, contractors should incorporate the following<br />
strategies to promote waste minimizations activities with their subcontractors.<br />
A renovation project may require more than a dozen different subcontractors. These<br />
subcontractors may include electrical, plumbing, <strong>and</strong> other specialists who may not be<br />
aware of ongoing waste minimization. The site supervisor must work with the<br />
subcontractors to ensure that they also participate in waste minimization activities.<br />
These activities may include:<br />
9/14/05 R. W. Beck 7-3
Section 7<br />
• Establish language in their contract detailing the proper steps for diverting C&D<br />
waste from the l<strong>and</strong>fill.<br />
• Educate subcontractors during regular site meetings on the process for separating<br />
recoverable waste or reusing materials.<br />
• Assign one or two laborers to monitor dumpsters for waste materials that could be<br />
recovered.<br />
• Efficient Building Practices<br />
Many in the construction <strong>and</strong> recycling industry are unaware of the steps necessary to<br />
achieve C&D waste minimization. The strategies identified in this section when<br />
incorporated at the initiation of a project add little to no additional cost to a project.<br />
The discussion of C&D waste reduction strategies is geared toward primary waste<br />
generators in the North Central Texas region including:<br />
• <strong>Construction</strong> management firms<br />
• Home builders<br />
• Commercial builders<br />
• Recyclers<br />
The information included in this section is from multiple sources including: case study<br />
research, interviews with construction, waste management <strong>and</strong> engineering<br />
professionals, reviews of available literature <strong>and</strong> internet resources.<br />
7.1.4 <strong>Waste</strong> Management Plan<br />
Establishing a waste management plan to achieve diversion goals is one of the most<br />
important components of any C&D waste minimization effort. This strategy will<br />
contribute greatly to a successful implementation process for C&D waste reduction.<br />
This plan should include but not be limited to the following:<br />
7.1.4.1 <strong>Waste</strong> Management Goals<br />
Based on the size of the structure as well as the method of operation implemented for<br />
deconstruction, a waste minimization goal should be formally declared. The diversion<br />
goal could be in agreement with the city’s waste minimization goals or LEED rating<br />
specifications, however developing a diversion goal has a wide range of applications.<br />
When approaching this task, it is important to set conservative diversion goals for the<br />
project. Trying to recycle or reuse everything may not be beneficial to the success of<br />
the project, especially if it cost prohibitive. It is essential to make sure that one does<br />
not negatively impact the overall cost of the project due to unrealistic waste<br />
minimization goals.<br />
7.1.4.2 Communication Plan<br />
A formal communication plan establishes <strong>and</strong> explains any communication procedures<br />
that will be followed regarding C&D waste minimization. This plan may include a<br />
7-4 R. W. Beck 9/14/05
Best Management Practices<br />
discussion of project timelines, data submission, or how to report any setbacks<br />
regarding the disposal of materials.<br />
7.1.4.3 <strong>Construction</strong> Plan<br />
A construction plan detailing the methodology for diverting materials from the waste<br />
stream should also be included as part of the waste planning process. This plan<br />
includes the method removing waste from the building as well as recycling or reuse<br />
for C&D waste.<br />
The construction plan also needs to include information detailing where the material<br />
will be recycled or reused. It is very important for the firm to secure <strong>and</strong> negotiate an<br />
agreement with end markets to ensure materials are properly recycled. There are a<br />
number of “sham” recyclers operating in Texas that accept waste under the pretext that<br />
the waste will be recycled. 1<br />
For example, when recovering concrete, the firm should find out how the recycler<br />
wants the material to be dismantled <strong>and</strong> stored, how much material they can accept<br />
<strong>and</strong> how the material needs to be transported. 2 The firm may also wish to have<br />
preliminary discussions with local government staff with regards to the reuse of any<br />
materials that could be reclaimed (i.e. finishings, electrical, plumbing).<br />
In addition, construction management firms need to efficiently use building materials,<br />
thus minimizing the actual amount of waste generated by the project. From a<br />
cost/benefit perspective, if a firm can reduce the amount of excess building materials<br />
purchased, it will most likely reduce the cost of disposal.<br />
7.1.4.4 Verification Procedures – LEED<br />
In order to submit a project for a LEED rating all waste disposed <strong>and</strong> diverted from<br />
l<strong>and</strong>fills must be accounted for <strong>and</strong> verified. A construction management firm is<br />
typically responsible for all activities associated with tracking waste disposal <strong>and</strong><br />
minimization activities.<br />
Information on who will maintain the data <strong>and</strong> how the data is recorded <strong>and</strong> provided<br />
to the local government must be clearly stated in the plan. Outlining the data<br />
collection methods should be clearly stated at the onset of the project to avoid any<br />
falsification of information or confusion after project completion.<br />
7.1.4.5 Indoor Air Quality Procedures - LEED<br />
The LEED rating system has an indoor air quality component that is to be included as<br />
part of the waste management plan. The firm must outline the procedures that will<br />
ensure during the construction phase of the project the HVAC system will be kept free<br />
from airborne materials.<br />
1 More information on “Sham” Recyclers is included in Section 9.<br />
2 If a C&D MRF is developed in the North Central Texas region, firms may seek to establish contracts<br />
with the operator of the C&D MRF for the disposal of waste. This process for diverting this waste to<br />
the C&D MRF may be included in the construction plan.<br />
9/14/05 R. W. Beck 7-5
Section 7<br />
While this component is only necessary for construction projects under the LEED<br />
rating system, this is one method a firm may use to set itself apart from other firms<br />
during the bidding process.<br />
7.1.5 On-site Grinding <strong>and</strong> Crushing<br />
7.1.5.1 Residential<br />
On-site grinding for residential housing developments can effective reduce up to 85<br />
percent of C&D waste produced. The grinding of materials such as corrugated<br />
cardboard, sheetrock, masonry/brick, <strong>and</strong> wood as well as the distribution of those<br />
materials for uses on-site can almost eliminate the need for waste disposal at the<br />
l<strong>and</strong>fill.<br />
As described in On-Site Grinding Case Study in Section 4, production home-builders<br />
can cost-effectively dispose of C&D waste using an on-site grinding service provider.<br />
Contracting for the grinding of C&D waste can often be equal to or less than the cost<br />
of a disposal service.<br />
In cases where a home-builder uses an on-site grinding service, both parties should be<br />
aware that communication is key to ensuring that the service provider <strong>and</strong> homebuilder<br />
have a successful working relationship during the project <strong>and</strong> that grinding<br />
services may be considered as a viable option in the future.<br />
Once a project has begun, regular scheduled grinding times should be established in<br />
accordance with neighborhood restrictions as well as with the construction operation<br />
of the home. The determination of the location of the source separated materials <strong>and</strong><br />
reduced materials is an important “first step” of the process <strong>and</strong> should be maintained<br />
throughout the course of a job. In the event that there is a need to change the location<br />
of operation, proper communication should take place between parties.<br />
As part of the strategic planning initiative in the North Central Texas Region, the<br />
construction industry as a whole must be provided with informational resources<br />
detailing how C&D waste can be reduced for new construction. This information may<br />
include information on the intended uses of reduced material, scheduling process, <strong>and</strong><br />
tangible <strong>and</strong> intangible benefits of using on-site grinding.<br />
7.1.5.2 Commercial<br />
Based on an EPA study, approximately 30 percent of commercial new construction<br />
waste is concrete, therefore diverting this material from the waste stream can<br />
contribute greatly to C&D waste diversion goals. As discussed in Section 7, on-site<br />
concrete crushing operations currently have various operational <strong>and</strong> geographic<br />
restrictions under the TCEQ <strong>and</strong> permits that must be obtained before operating.<br />
In addition, wood, masonry/brick <strong>and</strong> corrugated cardboard may be ground on-site <strong>and</strong><br />
used as a soil amendment for the new construction. The same process described in<br />
above section <strong>and</strong> case study should be similarly implemented.<br />
7-6 R. W. Beck 9/14/05
Best Management Practices<br />
7.1.6 Material Collection<br />
Recyclable construction materials can be source separated or commingled in recycling<br />
bins onsite. The recycling or reuse method, diversion goals of the project <strong>and</strong> type of<br />
material recovered are a few factors that have an impact on the materials collection<br />
method.<br />
7.1.6.1 Source Separation<br />
Source separation activities involve crews placing select recyclables such as wood,<br />
cardboard <strong>and</strong> metals in separate containers as they are generated through<br />
deconstruction, new construction or renovation. Once the containers are ready, the<br />
recycling hauler typically transports the materials directly to a recycler or a reduction<br />
site.<br />
Source separation is most appropriate the following scenarios:<br />
• Material(s) will be marked for reuse, (i.e. doors, sinks, etc.).<br />
• The recycler requires materials, such as concrete or wood, to be ground cleanly<br />
with little to no contamination.<br />
• A LEED rating or green building program requires volume data to be kept on<br />
each type of material.<br />
The construction firm needs to identify <strong>and</strong> address any perceived C&D waste<br />
minimization issues during the planning phase of the project. For example, ample<br />
space onsite for separation <strong>and</strong> storage is one of the most significant operational<br />
constraints that may apply to projects. Whenever possible, the construction firm must<br />
separate <strong>and</strong> store materials onsite. By keeping materials onsite, it often reduces the<br />
chance that materials will be damaged during transportation.<br />
A good rule of thumb is to limit the number of times materials are h<strong>and</strong>led. For<br />
example, in a deconstruction project, material should be touched once during removal<br />
from the work area or during deconstruction. The material should be touched a second<br />
time if pieces of the object need to separated again by material (i.e. light fixtures into<br />
glass, metal, etc.) <strong>and</strong> placed into bins <strong>and</strong> a third time by the recycling hauler where it<br />
is taken offsite.<br />
Communicating to deconstructing staff is critical so that material is salvaged properly.<br />
If staff is not properly trained, material can often end up in disposal containers, broken<br />
during deconstruction or improperly stored. Often overcoming language barriers is<br />
key to ensuring that source separation occurs correctly.<br />
7.1.6.2 Commingled Collection<br />
Commingled collection means that the home-builder/contractor can mix a variety of<br />
recyclable materials together. For example during a renovation project, a single<br />
container could store wood, corrugated cardboard <strong>and</strong> stone/masonry together. Once<br />
the container is full, a hauler transports the material to a processing facility.<br />
Commingled collection is most appropriate in the following scenarios:<br />
9/14/05 R. W. Beck 7-7
Section 7<br />
• Materials can be transported to a C&D material recovery facility for further<br />
processing.<br />
• A LEED rating or green building program requires a builder to only account for<br />
materials diverted in summary format.<br />
There are several operational advantages for using commingled collection over source<br />
separation. Commingled collection may be less time consuming for employees<br />
because all material can be placed into one container versus source specific containers.<br />
In addition, the collection containers may take up less space than recycling bins used<br />
during source separation. However, one must also note that the market value of the<br />
recyclable material may be lower than that of source separated materials.<br />
Currently, a C&D MRF does not exist in the North Central Texas region, limiting the<br />
usefulness of this collection method. However, if a C&D MRF were to open,<br />
commingled collection of C&D materials can serve as a quicker <strong>and</strong> an operationally<br />
easier alternative for home-builders to divert C&D waste.<br />
7.1.7 Material Hauling <strong>and</strong> Recovery<br />
7.1.7.1 Recycling Haulers<br />
A developer or contractor may choose to contact <strong>and</strong> contract the services of a<br />
recycling hauler to take C&D materials to a processing facility or salvage yard. These<br />
recycling haulers usually accept only one or two types of materials (i.e. electrical<br />
waste, metals, or concrete); therefore, a contractor must work with several different<br />
recycling haulers for the pickup of the various types of materials recovered.<br />
This practice is the most common method of disposal in the North Central Texas<br />
region, since a commingled materials recovery facility is not currently available in the<br />
region.<br />
7.1.7.2 Material Recovery Facility<br />
A C&D MRF is a facility that accepts mixed C&D debris <strong>and</strong> separates it into its<br />
marketable components. The remaining material, which has little or no value, is then<br />
given away for reuse or l<strong>and</strong>filled. At the most basic level, a C&D MRF is simply a<br />
place where C&D debris is dumped, manually sorted, <strong>and</strong> the materials sold.<br />
However, as described in Section 3, a typical C&D MRF has some level of<br />
mechanization that allows for the more efficient sorting of material.<br />
The C&D MRF case study provides more detail on the requirements <strong>and</strong> operations of<br />
a C&D MRF. For the purposes of the analysis, R. W. Beck assumed the MRF<br />
operator was a public sector entity, meaning that there were no tax implications <strong>and</strong><br />
that the MRF was operated on a break-even basis. Similar principles apply for a<br />
private-sector MRF operator; however financial practices may differ <strong>and</strong> would need<br />
to be taken into consideration.<br />
In Texas, one of the major challenges of a C&D MRF is that the tipping fees are<br />
relatively low, meaning that the cost per ton to operate the MRF has to be similarly<br />
7-8 R. W. Beck 9/14/05
Best Management Practices<br />
low for the MRF to remain competitive. Recommendations to help a MRF remain<br />
financially competitive include:<br />
• Co-locate the MRF with another permitted MSW facility, particularly a l<strong>and</strong>fill or<br />
transfer station.<br />
• Find alternative ways to use residual material so that the MRF operator does not<br />
have to pay to l<strong>and</strong>fill the residual.<br />
• Locate the MRF as close as possible to sources of C&D debris to reduce<br />
transportation costs, <strong>and</strong> therefore total disposal costs, for the producer <strong>and</strong>/or<br />
hauler of the C&D debris.<br />
• Market the services of the MRF to the widest range of C&D debris producers <strong>and</strong><br />
haulers.<br />
• Advertise the environmental benefits of the MRF, thereby creating public interest<br />
in diverting C&D debris from the l<strong>and</strong>fill.<br />
• Create incentives to keep in-bound contaminants low. High contamination rates<br />
needlessly consume the MRF resources.<br />
• Create non-monetary incentives for haulers to use the MRF. For instance, haulers<br />
should be able to get in <strong>and</strong> of the MRF quicker than at the l<strong>and</strong>fill, which may<br />
allow a hauler to complete a job in less time.<br />
• Maximize the throughput of the facility, which creates economies of scale to<br />
leverage the capital invested in the C&D MRF.<br />
• Properly market the end material to get the best prices. This may include forming<br />
collective agreements <strong>and</strong> selling direct to end-users, as opposed to using a<br />
materials broker.<br />
These considerations should be taken into account during the planning process of a<br />
C&D MRF. Addressing these will help a C&D MRF operator, whether from the<br />
public or private sector, maintain a successful operation.<br />
7.1.8 Alternative Erosion Control Methods<br />
Soil tubes or mulch berms can be an effective alternative to traditional silt fencing.<br />
During the project, soil tubes <strong>and</strong> mulch berms are used for erosion control; however,<br />
upon completion of the project they are placed onsite as a soil amendment. Depending<br />
on the scale, two alternatives may be able to significantly reduce the amount of fill dirt<br />
needed at the end of a project.<br />
7.1.8.1 Soil Tubes<br />
One of the most unique measures to avoid silt fencing is through the use of soil tubes.<br />
Soil tubes are cylindrical mesh that can be filled with a variety of materials to create a<br />
“wall” around the perimeter of a property to keep soil <strong>and</strong> other materials from<br />
washing into the stormwater system. These tubes can vary from 10 to 20 inches in<br />
diameter <strong>and</strong> are filled with a compost type material or with chipped wood. When the<br />
9/14/05 R. W. Beck 7-9
Section 7<br />
project is nearing completion these soil tubes are cut open <strong>and</strong> the contents are spread<br />
onsite as a soil amendment.<br />
Soil tube service providers in the North Central Texas region can deliver a soil tube to<br />
a construction site <strong>and</strong> fill it with compost for a fee based on the diameter <strong>and</strong> size of<br />
the tube. At this time, no on-site grinding service provider in the North Central Texas<br />
region offers chipped wood soil tubes for delivery; however, this may be available in<br />
the future.<br />
Based on industry research, soil tubes filled with composted material are very<br />
effective in filtering a significant amount of pollutants <strong>and</strong> soil from entering the<br />
stormwater system. Most soil tubes are not typically limited by the terrain of the<br />
geographic characteristics in the North Central Texas region. In addition, soil tubes<br />
require very little maintenance when installed <strong>and</strong> used properly <strong>and</strong> can often endure<br />
heavy rains.<br />
7.1.8.2 Mulch Berm<br />
Chipped wood from an on-site grinder in many cases is the most cost-effective method<br />
for silt fencing alternatives. Building a mulch berm consists of taking chipped wood<br />
<strong>and</strong> forming a protective berm around the perimeter of a construction site. A typical<br />
berm is no more than 15 to 20 inches high <strong>and</strong> is not usually limited by the terrain of<br />
the area. Typically, maintenance is only necessary after heavy rains or when the berm<br />
is driven over. At that time, the berm would need to be reshaped or rebuilt. Upon<br />
project completion, the mulch berm should be spread out on the property <strong>and</strong> used as a<br />
soil amendment.<br />
Developers wishing to use a mulch berm should request one be built by the service<br />
provider during the planning stages of the project. The developer does not have any<br />
direct labor costs with the installation <strong>and</strong> maintenance of the berm.<br />
7.1.9 Efficient Use of Building Materials<br />
In many new construction projects, construction firms <strong>and</strong> home-builders inefficiently<br />
utilize building materials. On a typical project, materials such as drywall, plywood,<br />
wood beams or studs <strong>and</strong> bricks are often measured or cut incorrectly thus leaving the<br />
material unusable.<br />
For example, wood that is to be used for studs in a home are delivered in a uniform<br />
length <strong>and</strong> it is the responsibility of the home builder to cut those beams in appropriate<br />
lengths for use in the house. All excess wood is then labeled as unusable <strong>and</strong> is<br />
discarded. From a cost benefit perspective, it will benefit the home builder greatly if<br />
they can reduce the amount of material marked for disposal.<br />
One way that a construction firm can reduce the amount of wasted material is by<br />
separating items by material such as wood, drywall <strong>and</strong> brick for possible later use.<br />
Plywood sheets can be fashioned into temporary storage containers <strong>and</strong> located around<br />
the facility. By separating <strong>and</strong> storing the material onsite, workers may use the excess<br />
material throughout the construction of the project. Based on discussions with homebuilders<br />
in the North Central Texas region, many situations arise where a small piece<br />
7-10 R. W. Beck 9/14/05
Best Management Practices<br />
of wood or brick is necessary. Rather than using an uncut beam, the stored material<br />
may be used instead.<br />
Making both supervisors <strong>and</strong> workers aware of this procedure could not only mean a<br />
significant amount of waste could be diverted from the l<strong>and</strong>fill, but could also reduce<br />
material costs for construction firms over time.<br />
7.2 Technical Assistance Resources<br />
Many facts <strong>and</strong> other informational resources regarding C&D waste reduction<br />
activities, strategies <strong>and</strong> programs are available online or through the TCEQ or other<br />
professional associations. In addition, professional <strong>and</strong> academic reports, case studies,<br />
available end markets for materials, <strong>and</strong> regular newsletters through some of the sites<br />
listed in this section can also provide useful information.<br />
7.2.1 TCEQ Sponsored Programs<br />
The TCEQ provides two online tools, Recycle Texas Online <strong>and</strong> RENEW, to help<br />
facilitate recycling within Texas. These are tools aimed at providing the construction<br />
industry with useful information <strong>and</strong> promote C&D waste minimization.<br />
7.2.1.1 Recycle Texas Online<br />
Recycle Texas Online is an online database that contains information on companies<br />
involved in selling or buying specific recyclable materials in Texas. A list of<br />
companies are provided free of charge on the site. The site is searchable by material<br />
<strong>and</strong> geographic region. A potential seller of a particular kind of C&D material (i.e.<br />
asphalt shingles) can search for recyclers of this material within the Dallas-Fort Worth<br />
area.<br />
http://www.tnrcc.state.tx.us/exec/sbea/rtol/<br />
7.2.1.2 RENEW<br />
The Resource Exchange Network for Eliminating <strong>Waste</strong> (RENEW) provides listings<br />
of recyclable materials available for sale or wanted for purchase across Texas free of<br />
charge. The site is searchable by material but not by geographic area. RENEW<br />
currently has a number of postings for potential suppliers of C&D waste across Texas<br />
but no postings for potential buyers of C&D waste.<br />
http://www.tnrcc.state.tx.us/exec/oppr/renew/renew.html<br />
7.2.1.3 Technical Assistance Hotline<br />
In addition to the C&D recycling assistance provided by Recycle Texas Online <strong>and</strong><br />
Renew, TCEQ provides a free Small Business <strong>and</strong> Local Government Assistance<br />
Hotline to answer technical questions on air, water, waste or pollution prevention<br />
issues. The hotline’s staff answers questions confidentially. The Small Business <strong>and</strong><br />
9/14/05 R. W. Beck 7-11
Section 7<br />
Local Government Assistance Hotline can be reached at 1-800-447-2827 between<br />
9AM-12PM <strong>and</strong> 1PM-4PM Central time Monday through Friday.<br />
7.2.2 Internet Resources<br />
There is an abundance of information on C&D waste minimization <strong>and</strong> green building<br />
available on the internet, including lists of potential purchasers of recyclables, sample<br />
local C&D ordinances, <strong>and</strong> information on upcoming green building conferences.<br />
Additional information on specific C&D recycling or green building issues can be<br />
found by running searches on these topics via search engines.<br />
7.2.2.1 C&D Recycler Online<br />
C&D Recycler Online (http://www.cdrecycler.com/) provides a wealth of information<br />
on C&D recycling. The website offers online access to <strong>Construction</strong> & <strong>Demolition</strong><br />
Recycler magazine that focuses on the concerns of entrepreneurs <strong>and</strong> processors in the<br />
C&D recycling industry. C&D Recycler Online also provides online business cards of<br />
businesses involved in C&D recovery which can be referenced by business category<br />
(i.e. C&D hauling services). The website includes an online message board which<br />
facilitates discussions amongst groups interested in C&D recycling.<br />
7.2.2.2 US Environmental Protection Agency Website<br />
The US Environmental Protection Agency’s (US EPA) website on C&D recycling<br />
(http://www.epa.gov/epaoswer/non-hw/debris/about.htm) provides data on C&D<br />
waste, information on C&D waste minimization programs sorted by EPA region, <strong>and</strong><br />
a listing of websites dedicated to the recycling of specific C&D commodities.<br />
The US EPA also has a green building website (http://www.epa.gov/greenbuilding/).<br />
It provides an overview of EPA green building projects by region, a list of<br />
recommended minimum recycled content guidelines for construction products, <strong>and</strong> an<br />
online tool developed by the National Institute of St<strong>and</strong>ards <strong>and</strong> Technology for<br />
selecting green building products.<br />
7.2.2.3 California Integrated <strong>Waste</strong> Management Board<br />
State agencies provide much of the general information available online for C&D<br />
recycling. One such agency is the California Integrated <strong>Waste</strong> Management Board<br />
(CIWMB), whose C&D website is found at http://www.ciwmb.ca.gov/ConDemo/.<br />
This site provides useful information including:<br />
• Detailed overview of C&D waste minimization;<br />
• Sample C&D specifications to be used by architects <strong>and</strong> engineers; <strong>and</strong><br />
• Examples of C&D ordinances various communities have passed.<br />
7-12 R. W. Beck 9/14/05
Best Management Practices<br />
7.2.3 Associations <strong>and</strong> Organizations<br />
The following associations <strong>and</strong> organizations provide valuable information on<br />
nationwide initiatives relating to green building <strong>and</strong> C&D recycling.<br />
7.2.3.1 National Association of Home Builders<br />
The National Association of Home Builders (NAHB) offers conferences on green<br />
building to educate builders on cost-effective business decisions that help the<br />
environment. The association’s website (http://www.nahb.org/) offers educational<br />
content relating to C&D recycling.<br />
7.2.3.2 The Kresge Foundation<br />
The Kresge Foundation (http://www.kresge.org/initiatives/index.htm) has developed a<br />
green building initiative that provides educational materials intended to help<br />
nonprofits underst<strong>and</strong> the green approach to building. The foundation sponsors green<br />
building workshops <strong>and</strong> encourages non-profit executives to consider a green building<br />
when they build.<br />
7.2.3.3 US Green Building Council<br />
The USGBC is a coalition of leaders in the building industry who work to promote the<br />
construction of environmentally friendly buildings. The USGBC develops the LEED<br />
building system, the world’s leading system in designing, building, <strong>and</strong> certifying<br />
green buildings. Additional information on LEED is provided in Section 5. The<br />
USGBC holds the Greenbuild Conference <strong>and</strong> Exposition annually bringing together<br />
industry leaders in green building for educational programs <strong>and</strong> workshops. More<br />
information on USGBC can be found at its website, http://www.usgbc.org/.<br />
7.2.3.4 <strong>Waste</strong>Wise<br />
The US EPA’s <strong>Waste</strong>Wise (http://www.epa.gov/epaoswer/non-hw/reduce/wstewise/)<br />
is a free, voluntary program aimed at reducing municipal solid waste that any<br />
organization within the United States can join. Member organizations have access to<br />
a <strong>Waste</strong>Wise representative who can provide technical assistance on waste reduction<br />
issues. Member organizations that successfully reduce their municipal waste<br />
generation are eligible for public recognition through awards programs, regional<br />
forums, case studies, <strong>and</strong> journal articles.<br />
7.2.3.5 <strong>Construction</strong> Materials Recycling Association<br />
The <strong>Construction</strong> Materials Recycling Association (CMRA) is an association devoted<br />
to the needs of those in the C&D waste processing <strong>and</strong> recycling industry. They<br />
provide information on issues <strong>and</strong> technology facing the industry. The CMRA lists<br />
available literature on relevant topics <strong>and</strong> promotes the use of recycled construction<br />
materials. The CMRA holds annual conferences <strong>and</strong> trade shows on C&D waste<br />
minimization. More information on the CMRA can be found at<br />
http://www.cdrecycling.org.<br />
9/14/05 R. W. Beck 7-13
Section 7<br />
7.2.3.6 Toolbase Services<br />
Toolbase Services (Toolbase) is a website devoted to providing technical resources to<br />
those in the home-building industry. The website provides information on the latest<br />
C&D waste minimization trends, case study information on communities throughout<br />
the nation, <strong>and</strong> information on technology related to the C&D waste minimization<br />
including green building <strong>and</strong> LEED rating projects. More information on Toolbase<br />
can be found at http://www.toolbase.org.<br />
7.2.3.7 National Association of Home Builders Research Center<br />
The National Association of Home Builders (NAHB) Research Center is one of the<br />
premier resources for the C&D waste minimization strategies. The information is<br />
aimed at both the public <strong>and</strong> private sector, <strong>and</strong> can provide technical information on<br />
C&D waste minimization activities (http://www.nahbrc.com). It provides articles <strong>and</strong><br />
studies on a variety of topics such as green building, market research, <strong>and</strong> affordable<br />
housing. The NAHB Research Center also operates a bookstore where one may<br />
purchase studies or resource guides on C&D waste minimization.<br />
7-14 R. W. Beck 9/14/05
Section 8<br />
Public Sector Initiatives<br />
This section focuses on options for local governments to create an environment for<br />
successfully diverting C&D waste from l<strong>and</strong>fills in their community. In many<br />
communities across the United States, the combination of establishing a C&D waste<br />
diversion program in conjunction with developing ordinances or voluntary incentives<br />
aimed at the private sector has been very effective in increasing the diversion rate for<br />
that community. This section describes alternatives for local governments to develop<br />
C&D waste diversion programs <strong>and</strong> to increase participation throughout incentives<br />
<strong>and</strong> ordinances.<br />
8.1 C&D <strong>Waste</strong> Diversion Programs<br />
Local governments interested in waste minimization strategies should create a C&D<br />
waste diversion program. A C&D waste diversion program may be a Green Building,<br />
LEED, reuse facility, or waste management planning program. These programs<br />
provide the infrastructure to foster participation from the construction <strong>and</strong> recycling<br />
industries. Meeting waste diversion goals may be more difficult to achieve if the local<br />
government does not take the first step in developing infrastructure aimed at C&D<br />
waste minimization.<br />
When developing a C&D waste diversion program, a local government must choose<br />
an option that is best suited for them. What may work best in an urban are does not<br />
necessarily translate to a rural one. R. W. Beck has provided a description of four<br />
programs that local government should use to develop the infrastructure to promote<br />
C&D waste minimization. Each program<br />
8.1.1 Green Building Program<br />
Green Building is an environmentally responsible approach to l<strong>and</strong> development <strong>and</strong><br />
housing construction in an effort to conserve natural resources. Section 2 of this<br />
report provides a detailed Green Building case study. Green Building can provide an<br />
opportunity for builders to construct houses in a manner that can reduce the quantity<br />
of C&D material that is generated for disposal.<br />
8.1.1.1 Practical Application<br />
There are several key steps associated with the development <strong>and</strong> management of a<br />
green building program. The first step involves how to establish a program. A Guide<br />
9/14/05
Section 8<br />
to Developing Green Building Programs 1 details each of the key steps in developing a<br />
green builder program, which include the following:<br />
• Step One – Determining interest<br />
• Step Two – Establishing a committee<br />
• Step Three – Setting objectives<br />
• Step Four – Determining partners<br />
• Step Five – Determining program coverage<br />
• Step Six – Setting up the budget<br />
• Step Seven – Considering existing programs<br />
• Step Eight – Establishing the certification process<br />
• Step Nine – Choosing program resources<br />
• Step Ten – Establishing program structure<br />
• Step Eleven – Creating the program checklist<br />
R. W. Beck would encourage the use of this guide when developing a green building<br />
program. This guide can be used to determine what specific criteria will be included<br />
as a part of a green building program. This is a critical step since it establishes the<br />
criteria that will drive the efforts of a green building program. <strong>Waste</strong> minimization<br />
strategies should be included in the criteria. However, communities should give<br />
careful consideration to the content of the criteria, <strong>and</strong> whether any waste<br />
minimization criteria will be m<strong>and</strong>atory instead of voluntary.<br />
The NAHB Research Center has recently developed another resource to guide the<br />
development of the certification process. The NAHB Research Center has been<br />
working with a home building industry stakeholder group to create a set of green<br />
home building guidelines for mainstream home builders. These guidelines, which<br />
were published as a final draft in June 2004, are available on the NAHB’s website<br />
(www.nahbrc.org). The guidelines update information included in A Guide to<br />
Developing Green Builder Programs.<br />
8.1.1.2 Examples<br />
The City of Frisco, TX m<strong>and</strong>ates that all new residential building meet, at a minimum<br />
the Environmental Protection Agency’s Energy Star requirements. Under the city’s<br />
rules, new homes must be energy efficient, conserve water, maintain air quality<br />
st<strong>and</strong>ards, <strong>and</strong> be constructed to facilitate recycling.<br />
http://www.ci.frisco.tx.us/developmentsvcs/greenbuilding/greenbuilding_home.htm<br />
1 National Association of Home Builder’s Research Center. A Guide to Developing Green Builder<br />
Programs. Upper Marlborro, Maryl<strong>and</strong>. February, 2000. This report is available for $25 from the<br />
NAHB Research Center. Website: www.nahbrc.org.<br />
8-2 R. W. Beck 9/14/05
Public Sector Initiatives<br />
Alameda County, California uses a “Green Points” rating system to m<strong>and</strong>ate green<br />
building in residential construction. New <strong>and</strong> remodeled homes may earn points based<br />
on C&D waste minimization activities. These activities include:<br />
• Donate unused materials<br />
• Reuse materials or recycle materials for l<strong>and</strong>scape areas<br />
• Reuse various foundation materials (e.g. foam board, content aggregate,<br />
aluminum forms)<br />
• Install recycled content materials (e.g. fiberglass insulation, ceramic tiles)<br />
Alameda County also provides a “Green Points” calculator for residents <strong>and</strong><br />
contractors to download.<br />
http://www.stopwaste.org/home/index.asp?page=470<br />
The City of Austin’s Austin Energy Green Building Program rates homes for energy<br />
efficiency, water efficiency, resource efficiency <strong>and</strong> health <strong>and</strong> safety. A building’s<br />
rating may range from one to five stars, with five stars being the most environmentally<br />
friendly. The city provides stickers to green-rated homes <strong>and</strong> certificates<br />
authenticating these ratings to home buyers.<br />
http://www.ci.austin.tx.us/greenbuilder/<br />
8.1.2 LEED Rating Program<br />
LEED rating ordinances have the potential to improve the environmental friendliness<br />
of commercial buildings. These ordinances require that new construction, demolition,<br />
or renovation of commercial buildings be rated under the rating system. A number of<br />
cities have taken a step in that direction by m<strong>and</strong>ating that all public buildings will be<br />
built in accordance with LEED st<strong>and</strong>ards.<br />
8.1.2.1 M<strong>and</strong>atory for Public Buildings<br />
Program Description<br />
Ten US cities, including the City of Dallas, require that all new construction on public<br />
buildings follow LEED building st<strong>and</strong>ards. Typically these programs vary based on<br />
the requirements set forth in the ordinance. These variations usually are related to the<br />
following:<br />
• Minimum size requirements for building participation;<br />
• Type of construction for the building (i.e. only new construction or only<br />
deconstruction); or<br />
• Location of the buildings (i.e. public buildings in the downtown region).<br />
Practical Application<br />
<strong>Construction</strong> in accordance with LEED building st<strong>and</strong>ards yields energy efficient <strong>and</strong><br />
environmentally friendly city buildings. In addition, constructing municipal buildings<br />
9/14/05 R. W. Beck 8-3
Section 8<br />
in accordance with LEED st<strong>and</strong>ards sets community st<strong>and</strong>ards for green buildings that<br />
may be followed by private builders.<br />
A major disadvantage to constructing municipal buildings in accordance with LEED<br />
st<strong>and</strong>ards relates to the increased cost. For example, constructing buildings to reach<br />
LEED Silver st<strong>and</strong>ards increases construction costs by approximately five percent.<br />
While some of this cost increase will be offset over time by lower utility bills,<br />
taxpayers ultimately pay the net cost increase via higher taxes or reduction in city<br />
services. A second disadvantage is a program focused only on public buildings may<br />
have a limited impact on the overall environment that the program will have.<br />
Examples<br />
The City of San Francisco requires any of its departments engaging in construction<br />
projects, renovations, <strong>and</strong> additions greater than 5,000 square feet adhere to a LEED<br />
Silver building st<strong>and</strong>ard at a minimum. The city also requires projects of less than<br />
5,000 square feet to provide for the maximum LEED points practical. The website<br />
listed below provides a link to the City of San Francisco’s Environmental Code.<br />
http://www.amlegal.com/sfenviron_nxt/gateway.dll?f=templates&fn=default.htm&vid<br />
=alp:sf_environ<br />
The City of Dallas passed a resolution in 2003 stating that all future revenue bond<br />
funded city buildings greater than 10,000 square feet will be built in accordance with<br />
LEED Silver st<strong>and</strong>ards. Dallas has yet to write these new st<strong>and</strong>ards into its building<br />
codes.<br />
http://www.usgbc.org/News/usgbcinthenews_details.asp?ID=290<br />
8.1.2.2 Citywide LEED Building Ordinance<br />
Practical Application<br />
A citywide LEED building ordinance would m<strong>and</strong>ate that all new construction within<br />
a city follow a LEED certification st<strong>and</strong>ard, such as LEED Silver. <strong>Construction</strong> of all<br />
buildings in accordance with LEED st<strong>and</strong>ards yields the benefits of energy efficient<br />
<strong>and</strong> environmentally friendliness buildings on a wide scale.<br />
The major disadvantage to m<strong>and</strong>ating such legislation is the costs that it imposes on<br />
all commercial contractors. This increase in costs, which would ultimately be passed<br />
onto building owners, may dissuade some investors from financing projects within the<br />
city, thereby slowing the city’s growth. An additional disadvantage to a citywide<br />
LEED building ordinance is the significant administrative cost that would be incurred<br />
in enforcing such a code on a citywide level.<br />
8.1.3 <strong>Waste</strong> Management Planning & Reporting<br />
8.1.3.1 General Description<br />
Local governments may adopt a policy encouraging waste management planning <strong>and</strong><br />
reporting prior to the construction or deconstruction of commercial <strong>and</strong> residential<br />
8-4 R. W. Beck 9/14/05
Public Sector Initiatives<br />
building. A waste management planning program provides a framework for waste<br />
diversion goals <strong>and</strong> strategies that contractors can operate under during the project<br />
build. Prior to developing incentives such as a fast track permitting program,<br />
infrastructure such as a waste management planning <strong>and</strong> report program is necessary.<br />
The waste management planning component has been included in both Section 7 <strong>and</strong> 8<br />
because of its importance on achieving C&D waste diversion. Based on several<br />
documents <strong>and</strong> interviews with industry <strong>and</strong> local government staff, reaching an<br />
underst<strong>and</strong>ing between the construction industry <strong>and</strong> public sector is a primary task<br />
for a program. Often meeting the needs of both parties is a fundamental challenge of<br />
the program. R. W. Beck believes that this can be achieved through meetings with<br />
construction industry associations <strong>and</strong> local government staff prior to the<br />
implementation of such a program.<br />
8.1.3.2 Practical Application<br />
A waste management plan may be applied to all phases of the construction industry,<br />
such as new construction, deconstruction <strong>and</strong> renovation homes <strong>and</strong> commercial<br />
building projects. The planning component may be incorporated as a component to a<br />
green builder program or LEED rating program by incorporating waste management<br />
planning <strong>and</strong> reporting as a part of their point system.<br />
<strong>Waste</strong> management plans may also have reporting requirements that contractors,<br />
home-builders or property owners provide to a local government upon completion of<br />
the project. <strong>Waste</strong> management reports may require information such as: disposal <strong>and</strong><br />
recycling tonnage data, recycler or salvage yard contact information or copies of all<br />
load <strong>and</strong> disposal tickets. It is essential that guidelines <strong>and</strong> expectations be established<br />
<strong>and</strong> communicated clearly through a form or data table template.<br />
By instituting waste management planning <strong>and</strong> reporting procedures, the local<br />
government is providing an environment for contractors <strong>and</strong> home-builders to<br />
incorporate waste diversion in their project plan. Based on a literature review <strong>and</strong><br />
discussions with industry professionals, one of the ways that waste diversion<br />
techniques can become cost-effective is when they are incorporated at the beginning<br />
of a project.<br />
A sample waste management plan <strong>and</strong> reporting template is included in Appendix E.<br />
8.1.3.3 Example<br />
As described in the Deconstruction <strong>and</strong> Renovation case studies in Section 5 <strong>and</strong><br />
Section 6, the City of Dallas accepted several waste management plans from<br />
construction firms who proposed on the Hensley Field Center project. This is a<br />
voluntary process for the City of Dallas, however City staff believed it contributed<br />
greatly to the accountability of the firm <strong>and</strong> the overall success of the project. More<br />
information on the waste management plan can be found in the case study sections of<br />
the report.<br />
9/14/05 R. W. Beck 8-5
Section 8<br />
8.1.4 Reuse Facility Program<br />
A construction <strong>and</strong> deconstruction material reuse facility is a location where<br />
businesses <strong>and</strong> individuals may bring building material for reuse in the community. 2<br />
The goal of this facility is to reduce the construction industry’s burden on the solid<br />
waste stream by diverting new <strong>and</strong> used building materials from l<strong>and</strong>fills to be used in<br />
other construction. These facilities often accept materials such as various types of<br />
construction wood (i.e. plywood, framing wood, etc.), drywall, paint, carpet, metals,<br />
light fixtures, doors, windows <strong>and</strong> plumbing.<br />
8.1.4.1 Practical Application<br />
A reuse facility could be established at the city, county or subregional level <strong>and</strong> be<br />
located near an existing l<strong>and</strong>fill or transfer station. These facilities may be open on a<br />
limited basis, typically from Thursday through Sunday during the daytime. A reuse<br />
facility should be manned by at least one or two FTEs, to assist in the loading <strong>and</strong><br />
unloading of vehicles <strong>and</strong> monitor the amount <strong>and</strong> types of materials that are dropped<br />
off. As a cost-saving strategy, transfer station or l<strong>and</strong>fill staff may be used in place of<br />
hiring a new FTE for the operation of a reuse facility.<br />
In addition, it is common for residents or contractors to bring unacceptable materials,<br />
such as HHW or MSW, therefore a full-time monitor as well as signage detailing the<br />
types of acceptable materials is often necessary.<br />
The greatest limitation in establishing a reuse facility is funding for the program.<br />
While funding may limit a local government’s interest in a reuse facility, R. W. Beck<br />
would recommend the local government work with non-profit organizations such as<br />
Habitat for Humanity or co-locating a facility with an existing solid waste disposal<br />
facility (i.e. l<strong>and</strong>fill or transfer station).<br />
8.1.4.2 Examples<br />
The City of Huntsville established a reuse facility in 2002. The facility is co-located<br />
with the City’s transfer station <strong>and</strong> accepts various building materials from the public<br />
as well as businesses. The reuse facility is open on the weekends manned by one FTE<br />
<strong>and</strong> is operated under the City’s Solid <strong>Waste</strong> Department. The City has seen a<br />
significant amount of participation from the public <strong>and</strong> will continue to operate the<br />
reuse facility program.<br />
The Dallas Area Habitat for Humanity operates a Habitat Home Improvement Outlet<br />
Store that facilitates the reuse of building materials <strong>and</strong> gently used appliances by<br />
accepting donated building materials <strong>and</strong> selling them to residents <strong>and</strong> businesses<br />
(http://www.habitat.org/script/link.asp?url=www%2Edallas%2Dhabitat%2Eorg). The<br />
Outlet Store provides a market for these building materials that would otherwise by<br />
2 Deconstruction is the h<strong>and</strong> demolition of buildings in the reverse order of their construction in order to<br />
carefully remove materials for reuse <strong>and</strong> recycling. This technique reduces the disposal of materials into<br />
the l<strong>and</strong>fills, <strong>and</strong> provides materials for renovation <strong>and</strong> other small-scale construction projects.<br />
8-6 R. W. Beck 9/14/05
Public Sector Initiatives<br />
disposed of in the l<strong>and</strong>fill. The Outlet Store will accept materials at the store <strong>and</strong> also<br />
provides an on-site pick-up <strong>and</strong> deconstruction service.<br />
The Fort Worth Area Habitat for Humanity has two Habitat ReStores that operate fivedays<br />
per week <strong>and</strong> accept donated building materials. The ReStores are located in<br />
both the north <strong>and</strong> south <strong>and</strong> offer a variety of building materials at a reduced price to<br />
the consumer. An automated information line providing directions, specials, <strong>and</strong><br />
services is available at 817-926-3585.<br />
8.2 Increasing Participation through Incentives<br />
Communities around the United States have begun to encourage C&D recycling<br />
through sponsoring grants <strong>and</strong> other incentive based programs. The following are<br />
examples of innovative ways that provide incentives for C&D waste minimization by<br />
state <strong>and</strong> local governments. 3<br />
R. W. Beck recommends that the programs described in this section are implemented<br />
as a part of a comprehensive C&D waste diversion program. These incentives should<br />
be developed as a complement to existing infrastructure as a way to increase on-going<br />
or new participation.<br />
In addition, R. W. Beck recognizes that budgetary or facility constraints may inhibit<br />
some of these programs, <strong>and</strong> would encourage local governments to evaluate the type<br />
of incentive that would best serve their community on a case-by-case basis.<br />
8.2.1 Rebates for Contractors<br />
One option being used to encourage C&D recycling entails providing rebates to<br />
contractors for the delivery of C&D material to recycling facilities. Under such a<br />
program, levels of recyclables delivered to recycling facilities are documented <strong>and</strong><br />
communicated to a governmental authority which issues the rebates. The rebate<br />
program is typically a voluntary program as opposed to other programs like deposit<br />
requirements or fines for non-compliance.<br />
Currently this program would require the establishment <strong>and</strong> operation of a C&D MRF.<br />
At this time, no such facility exists in the NCTCOG region. However, R. W. Beck has<br />
included this program under the assumption that such a facility may be established in<br />
the future.<br />
8.2.1.1 Practical Application<br />
One financial constraint associated with implementing a rebate program could be the<br />
ongoing administrative costs incurred in using such a program both at the recycling<br />
facility (where the levels of recyclables delivered by each contractor must to be<br />
3 Many of these programs have taken place in California since California state law requires each of its<br />
cities <strong>and</strong> counties to divert 50 percent of all solid waste from l<strong>and</strong>fill or transfer stations through source<br />
reduction, recycling <strong>and</strong> composting activities. California State Law required this target be met by<br />
January 1, 2000 although extensions may be granted to communities for no more than five years <strong>and</strong> no<br />
extension may be granted for any period after January 1, 2006.<br />
9/14/05 R. W. Beck 8-7
Section 8<br />
certified) <strong>and</strong> at the governmental agency administering the program. A program of<br />
this nature may not be supported in many communities in the North Central Texas<br />
region due to the cost. This cost may be mitigated through grants or acquisition of<br />
funding sources on an interim basis.<br />
From an operational perspective, there may be the potential for collusion between the<br />
contractor <strong>and</strong> recycling facility managers to inflate the levels of recyclables delivered<br />
to the facility. This potential risk can be mitigated to a large extent by stationing a<br />
governmental representative onsite to monitor the delivery of recyclables.<br />
The greatest advantage of a rebate plan is also the most obvious: monetary incentives<br />
for C&D recycling may lead to action on the part of firms. If the rebate is large<br />
enough, contractors will have strong incentive to increase their recycling of C&D<br />
material. Rebates are also typically very easy to communicate to the construction<br />
industry. Most rebate programs are fairly straightforward <strong>and</strong> would be easy to<br />
incorporate into a public awareness campaign.<br />
8.2.1.2 Example<br />
In the late 1990’s, Alameda County, California lacked a mixed C&D recycling<br />
facility. To encourage the building of such a facility within the county <strong>and</strong> to promote<br />
C&D recycling, the Alameda County <strong>Waste</strong> Management Authority began offering a<br />
$10 per ton rebate to county contractors for the delivery of mixed C&D to qualifying<br />
recycling facilities either within or outside of Alameda County in 2001. The current<br />
tipping fee for C&D waste at a l<strong>and</strong>fill in Alameda County is $46 per ton.<br />
This rebate was offered as an interim measure but has stayed in place after a C&D<br />
recycling facility was built within the county. The <strong>Waste</strong> Management Authority<br />
expects to have these rebates in place at least until 2006 in order to continue to<br />
encourage contractors to recycle their C&D wastes.<br />
Ann Ludwig<br />
Alameda County <strong>Waste</strong> Management Authority<br />
(510) 614-1699<br />
8.2.2 Government Grants to Private Firms<br />
8.2.2.1 Program Description<br />
Public entities can appropriate funds for grants to private businesses or non-profit<br />
organizations for C&D recycling programs. This may include the development of an<br />
actual building or housing-start, developing of recycling infrastructure or<br />
administration of pilot C&D recycling project.<br />
The costs for this program may be associated with identifying <strong>and</strong> monitoring grant<br />
funding <strong>and</strong> programs. In this case the governmental agency must publicize the grant<br />
program, select the recipient, <strong>and</strong> then follow up with the recipient to make sure that<br />
the stated performance measures have been met.<br />
8-8 R. W. Beck 9/14/05
Public Sector Initiatives<br />
8.2.2.2 Practical Application<br />
A grants program may encourage recycling companies to increase C&D recycling<br />
capacity, thereby increasing the number of facilities capable of processing such waste<br />
<strong>and</strong> reducing the costs contractors incur in transporting the waste to a recycling<br />
facility. A successful grants program may also encourage further private sector<br />
investment in C&D recycling by illustrating the potential value of this type of<br />
recycling.<br />
R. W. Beck recognizes that the most significant factor inhibiting this type of program<br />
would be the financial investment required by the public sector. This program may<br />
best be suited for a regional or state entity. If a program were to be established at the<br />
state level, it may require appropriation of funds at the state level.<br />
The goal of a grant program is to assist in the comprehensive C&D waste<br />
minimization effort to aid in infrastructure development <strong>and</strong> foster increases in<br />
throughput. For example, funds for capital investments in the recycling industry (i.e.<br />
increasing recycling capacity) without providing funds for a way to increase contractor<br />
participating (i.e. increasing throughput by contractors) may not fully impact C&D<br />
waste diversion. To the extent possible, grant funds should be made available to both<br />
the recycling <strong>and</strong> construction industry.<br />
8.2.2.3 Example<br />
New York’s Empire State Development Agency awards grants to state businesses to<br />
help them increase their recycling capacity. Grants of up to $500,000 may be awarded<br />
for capital investments in businesses as long as the business contributes 50 percent<br />
matching funds. In 2000, the agency awarded a $500,000 grant to Taylor Recycling,<br />
which helped the company build a $3,000,000 C&D MRF in Montgomery, NY. This<br />
grant enabled the company to double its debris sorting capacity <strong>and</strong> increase its C&D<br />
recycling by 27,000 tons per year.<br />
Linda Hosking<br />
Empire State Development Agency, New York<br />
(518) 292-5349<br />
In the late 1990’s, Lake County, IL performed a waste characterization study which<br />
identified C&D material as a significant source of refuse. In order to illustrate the<br />
potential value of C&D recycling <strong>and</strong> thereby encourage the use of C&D waste<br />
minimization, the county funded four pilot projects for the recovery of C&D materials.<br />
Four towns in Lake County were awarded approximately $25,000 each to fund C&D<br />
recycling pilot projects employing a private waste hauler. Through these pilot<br />
projects, the vendor achieved a 43 percent diversion rate (as measured on a cubic<br />
yardage basis) by diverting cardboard, clean wood, <strong>and</strong> metal scraps.<br />
Pete Adrian<br />
Solid <strong>Waste</strong> Agency of Lake County, Illinois<br />
(847) 336-9340<br />
9/14/05 R. W. Beck 8-9
Section 8<br />
8.2.3 Contractor Educational Programs<br />
8.2.3.1 Program Description<br />
Contractor education programs aim to illustrate the value of C&D recycling to<br />
contractors, thereby encouraging a change in their beliefs in C&D recycling <strong>and</strong><br />
motivating them to participate in such programs.<br />
8.2.3.2 Practical Application<br />
Developing a contractor education program in accordance with a NCTCOG regional<br />
education program may be cost-effective for many local governments. Contractor<br />
education can often be achieved at a lower cost in comparison to other C&D waste<br />
minimization programs.<br />
Another advantage of an educational program is its potential to change contractors’<br />
attitude on C&D waste minimization. Contractors who have been convinced of the<br />
value of C&D waste minimization <strong>and</strong> practice it on the job may continue to do so<br />
long after an education program has concluded.<br />
A significant disadvantage to a contractor education program is the difficulty in<br />
convincing contractors to become involved in C&D waste minimization when the<br />
economic benefits to their business may be uncertain. While many may think C&D<br />
waste minimization is a good idea, contractors are concerned with the “bottom line”<br />
<strong>and</strong> can be expected to act accordingly. Even after they have been educated in the<br />
environmental value of C&D recycling, many contractors will also need to be<br />
convinced of the economic benefit.<br />
8.2.3.3 Example<br />
In 1996, DuPage County, IL established a 50 percent reduction goal for the disposal of<br />
C&D debris by 2000. At the time, there was no county-specific information available<br />
about C&D generation <strong>and</strong> management. The County believed that to reach the goal,<br />
more participation by builders <strong>and</strong> other contractors would be necessary.<br />
To achieve this, the county performed a C&D waste survey that asked contractors <strong>and</strong><br />
demolition companies using waste reduction <strong>and</strong> recycling strategies to quantify the<br />
economic effects of the program. The county published the results of this study in a<br />
booklet which was distributed to companies in the surrounding area to inspire other<br />
contractors to engage in similar practices.<br />
Joy Hems<br />
DuPage County, Illinois<br />
(630) 407-6700<br />
8-10 R. W. Beck 9/14/05
Public Sector Initiatives<br />
8.2.4 Fast Track Permitting<br />
8.2.4.1 Program Description<br />
A local government can give contractors or home-builders who participate in any of<br />
the waste minimization programs preferential treatment during the permitting process.<br />
This allows a project to potentially move ahead of all other projects awaiting a permit.<br />
In some cases, the program provides an opportunity for the permitting staff to conduct<br />
one-on-one reviews of the site plans with the developer to fix any issues that might<br />
delay permitting.<br />
8.2.4.2 Practical Application<br />
The primary purpose of this program is to reduce the time that a construction firm<br />
must wait during the permitting process required by the local government.<br />
The amount of time that developers wait for a permit may be up to six months<br />
depending on the workload of the permitting staff. Fast track permitting can reduce<br />
the wait time to less than a few weeks or a month. By reducing the amount of waittime<br />
associated with the permitting, the developer may begin the project sooner, thus<br />
potentially reducing costs.<br />
8.2.4.3 Example<br />
The City of Dallas has adopted a program that allows construction management firms<br />
to receive building permits in a shorter amount of time provided that the building<br />
plans are developed in an energy efficient manner or has a waste reduction component<br />
incorporated in it.<br />
In addition, the City allows the developer to meet with the permit staff member to<br />
identify <strong>and</strong> fix any potential problems with the plan. Through the one-on-one<br />
permitting process, the developer or contractor gains a greater underst<strong>and</strong>ing of the<br />
system in addition to being able in some cases to make changes to the design<br />
immediately. This process may lead to the immediate approval of the permit in cases<br />
where the problems are minor can be corrected during the one-on-one meetings.<br />
Based on discussions with City staff, this process has been very well received by<br />
builders in the Dallas area.<br />
Michael A. Kawecki<br />
City of Dallas<br />
214-670-6932<br />
8.2.5 First Choice Programs<br />
8.2.5.1 Program Description<br />
First choice programs aim to create a market for C&D materials by m<strong>and</strong>ating that<br />
government agencies buy these products as their first choice in purchasing supplies.<br />
9/14/05 R. W. Beck 8-11
Section 8<br />
The recycled materials, like new materials, must meet all existing building codes,<br />
st<strong>and</strong>ards or specifications.<br />
8.2.5.2 Practical Application<br />
The major advantage of a first choice program is its ability to substantially increase<br />
the market for a particular recycled product. Based on the research conducted in the<br />
North Central Texas area, the infrastructure for end markets in the region is still<br />
developing. If one or more local governments were to adopt this initiative it would<br />
not only show leadership in the area of C&D waste minimization, but would<br />
encourage businesses to provide these materials.<br />
The primary disadvantage to a first choice program is its potential to increase the costs<br />
of business for the entity purchasing the recycled goods. For example, if the price of<br />
alternative erosion control methods are higher than the price of traditional silt fencing<br />
<strong>and</strong> is purchased in large volumes, there will be a cost increase incurred by the<br />
consumer. In addition, local governments must be careful that the recycled products<br />
meet building code st<strong>and</strong>ards for quality of material.<br />
8.2.5.3 Example<br />
The Texas Department of Transportation (TXDOT) implemented the use of recycled<br />
materials internally <strong>and</strong> in road construction projects in 1998. TXDOT began to use<br />
recycled materials in road construction since quality materials are scarce in some areas<br />
of Texas. In addition, TXDOT has found that recycled materials can exceed the<br />
performance of traditional materials. TXDOT’s mission is to increase the use of<br />
recycled materials in road construction where economic <strong>and</strong>/or engineering benefits<br />
are identified. TXDOT is working in partnership with contractors, the Federal<br />
Highway Administration, county <strong>and</strong> municipal road builders, universities, the Texas<br />
Natural Resource Conservation Commission, material suppliers, generators, <strong>and</strong><br />
processors toward this goal.<br />
The United States Resource Conservation <strong>and</strong> Recovery Act requires all federal, state,<br />
<strong>and</strong> local agencies that use federal funds to buy products that contain recovered<br />
materials if they spend more than $10,000 annually on designated items. Agencies<br />
may opt out of this requirement if the cost of the material is unreasonable, a lack of<br />
competition in the supply of the material exists, the item is not available in a<br />
reasonable period of time, or the item does not meet the agency’s performance<br />
specifications.<br />
8.3 Increasing Participation through Ordinance<br />
Many cities have instituted ordinances or other laws directing builders to achieve<br />
waste minimization <strong>and</strong> green building targets. The following section is intended as<br />
an overview of various methodologies that have been employed to reach these goals.<br />
8-12 R. W. Beck 9/14/05
Public Sector Initiatives<br />
8.3.1 Deposit Requirements<br />
8.3.1.1 Program Description<br />
Deposit requirements force contractors to pay a deposit before beginning a C&D<br />
project. This money is to be returned to the contractor after the local government<br />
confirms that the project met the required waste diversion goal.<br />
Currently this program would require the establishment <strong>and</strong> operation of a C&D MRF.<br />
However, R. W. Beck has included this program under the assumption that such a<br />
facility could be established in the future.<br />
8.3.1.2 Practical Application<br />
The impact of a penalty for non-compliance yields the same advantage as does the<br />
rebate program. That is, if the penalty is large enough, profit maximizing firms will<br />
take action in order to meet the target diversion goal. This penalty can yield<br />
significant additional levels of C&D waste minimization for a community that<br />
implements such an ordinance. A second major advantage to this method of<br />
incentivizing C&D relates to the ease of communication of the program. The<br />
enforcement of a penalty for not meeting a diversion goal is easy for a contractor to<br />
underst<strong>and</strong> <strong>and</strong> this helps to facilitate action on the contactor’s part.<br />
One of the disadvantages of this program is the administrative cost monitoring<br />
whether a project has reached target goal. The contractor also faces increased costs in<br />
monitoring progress in meeting this goal <strong>and</strong>, in the case of non-compliance, increased<br />
costs associated with lost deposits. Should these costs become a significant<br />
percentage of total costs, contractors may discontinue operating in a given jurisdiction.<br />
Such a situation would lead to increased overall construction <strong>and</strong> demolition costs <strong>and</strong><br />
could yield decreased levels of construction growth for a given community.<br />
A final disadvantage to deposit requirements relates to the incentive structure these<br />
penalties create. The potential to lose deposits gives an incentive for contractors to<br />
divert C&D materials to a point. However, they provide no incentive for the<br />
contractors to divert material beyond this point. Thus, while a community may be able<br />
to reach a target goal by means of these penalties, there is a reduced chance this goal<br />
will be exceeded.<br />
8.3.1.3 Example<br />
The City of San Mateo, California found that about 30 percent of its l<strong>and</strong>filled waste<br />
was C&D material with a large percentage that could be recycled. Based on these<br />
findings, the city passed an ordinance in 2001 requiring construction <strong>and</strong> demolition<br />
projects to achieve waste diversion rates of up to 60 percent. The ordinance requires<br />
companies obtaining a building permit in the city to submit a security deposit <strong>and</strong><br />
documentation of the company’s intent to divert C&D waste via recycling. In order<br />
for the company to receive its deposit back, it must provide documentation proving<br />
that it diverted the required percentage of C&D material.<br />
9/14/05 R. W. Beck 8-13
Section 8<br />
http://www.ci.sanmateo.ca.us/dept/pubwks/ordinance.html<br />
8.3.2 Franchise Fees for C&D <strong>Waste</strong> Disposal at L<strong>and</strong>fills<br />
8.3.2.1 Program Description<br />
Some communities are incentivizing C&D waste minimization by requiring C&D<br />
collection service providers that intend to dispose of C&D waste at l<strong>and</strong>fills to pay a<br />
licensing fee; C&D recyclers are exempt from the fee.<br />
8.3.2.2 Practical Application<br />
Implementing franchise fees for C&D collection service providers establishes a clear<br />
incentive to recycle. Such fees impose greater costs on collection service providers<br />
intending to dispose of C&D at l<strong>and</strong>fills. C&D recyclers are not required to obtain a<br />
franchise. In essence, C&D waste minimization may become less costly compared to<br />
disposal at l<strong>and</strong>fills due to the additional fees imposed on collection service providers.<br />
The main disadvantage to franchising is that by instituting this program, the city incurs<br />
additional administrative costs associated with approving <strong>and</strong> overseeing franchisees.<br />
This cost may, however, be offset by the franchise fee. An additional disadvantage to<br />
franchising is the potential for reduced levels of competition for all types of refuse<br />
collection within a city due to collection companies opting to not serve the city at all<br />
because of the franchise fee.<br />
In addition, as described in the NCTCOG’s 2003 C&D Recycling, Reuse <strong>and</strong> Reduce<br />
Study, several limitations exist due to current franchising agreements in communities<br />
in the North Central Texas region. R. W. Beck would not recommend establishing<br />
franchising fees for C&D waste disposal until proper infrastructure is in place for<br />
collection service providers to divert waste. This may feasibly occur with the<br />
development of a C&D MRF.<br />
8.3.2.3 Example<br />
The City of Santa Rosa, California maintains a franchise fee for providers of C&D<br />
collection services of nine percent of the franchisee’s gross revenues. Self-haulers <strong>and</strong><br />
recyclers are exempt from this requirement.<br />
http://ci.santa-rosa.ca.us/City_Hall/City_Council/Documents/2002/cco3586.htm<br />
8.3.3 Fines <strong>and</strong> Penalties for Non-Compliance<br />
8.3.3.1 Program Description<br />
Increasing C&D waste minimization could also occur by implementing new<br />
requirements on business that incorporate fines or penalties. Under this option,<br />
contractors who do not meet required diversion goals are fined.<br />
Currently the feasibility of this program in the region is limited due to the lack of an<br />
established <strong>and</strong> operational C&D MRF in the region. However, R. W. Beck has<br />
8-14 R. W. Beck 9/14/05
Public Sector Initiatives<br />
included this program under the assumption that such a facility could be established in<br />
the future.<br />
8.3.3.2 Practical Application<br />
The practical application for the use of fines is similar to deposit programs. It is<br />
essential that fines for non-participation are large enough to economically affect the<br />
contractor or home-builder is economically affected. In addition, the local<br />
governments must enforce these fines.<br />
One of the disadvantages of using fines relates to the administrative costs the city<br />
incurs in monitoring whether projects have reached the required diversion rate. The<br />
contractor also faces increased costs in monitoring its progress in meeting a diversion<br />
goal <strong>and</strong>, in the case of non-compliance, increased costs associated with fines. A final<br />
disadvantage to fines is that they, like deposit requirements, provide no incentive for<br />
the contractors to divert material beyond the required level point.<br />
8.3.3.3 Example<br />
The City of La Habra, California requires all new construction, remodeling <strong>and</strong><br />
demolition projects over a certain size (these sizes vary based on the type of<br />
construction) to divert 50 percent of C&D debris. Contractors must submit two<br />
reports to the City. The first report is a waste management plans to the city describing<br />
the was diversion goal <strong>and</strong> the method of achieving it <strong>and</strong> a final report confirming<br />
that the diversion rate has been met after work has been completed. Contractors who<br />
fail to meet the diversion requirement are guilty of a misdemeanor. They may be<br />
fined or imprisoned for up to six months.<br />
http://www.ciwmb.ca.gov/ConDemo/SampleDocs/LaHabra.pdf<br />
9/14/05 R. W. Beck 8-15
Section 8<br />
(This page intentionally left blank)<br />
8-16 R. W. Beck 9/14/05
Section 9<br />
Legal Summary<br />
The purpose of this section is to build on the legal analysis developed in the 2003<br />
NCTCOG C&D Study, whereby R. W. Beck has expended the discussion of the laws<br />
concerning C&D waste minimization efforts. To achieve this, R. W. Beck has chosen<br />
to focus on specific rules <strong>and</strong> laws concerning the C&D waste minimization efforts<br />
described in the case studies. To further aid in the dialogue of future C&D waste<br />
minimization legislation, R. W. Beck has provided descriptions of some aggressive<br />
legislative measures established by other states in the U.S.<br />
9.1 Temporary Crushing Rules<br />
In an effort to clear any ambiguity as to the applicability of the State’s temporary<br />
crushing rules, R. W. Beck has provided a discussion of the rules as it applies to onsite<br />
grinding <strong>and</strong> rock crushing operations.<br />
9.1.1 On-site Grinding Operations<br />
Based on discussions with TCEQ <strong>and</strong> an analysis of the temporary crushing rules, onsite<br />
grinding operations, as described in Case Study 3, are not subject to any of the<br />
guidelines established by these rules. Therefore, no location restrictions or time<br />
limitations have been placed on on-site grinding operations at this time.<br />
R. W. Beck would like to emphasize that while there are no State laws in place for onsite<br />
grinders, local or neighborhood restrictions may affect operation of an on-site<br />
grinder. Operators should be considerate of their surroundings <strong>and</strong> check with the<br />
local code enforcement division prior to operation, certain neighborhoods may have<br />
noise or dust regulations that need to be followed.<br />
In addition, R. W. Beck recommends that all contractors <strong>and</strong> on-site grinder operators<br />
use good judgment (e.g. noise <strong>and</strong> dust control) when conducting grinding activities as<br />
to not disturb or upset the surrounding community.<br />
9.1.2 Rock Crushing Operations<br />
All operators of temporary rock or concrete crushers must obtain a permit from the<br />
Texas Commission on Environmental Quality (TCEQ). The two least time consuming<br />
methods of doing so include obtaining a permit through permit by rule (PBR) <strong>and</strong><br />
obtaining a permit through the st<strong>and</strong>ard permit for temporary rock crushers <strong>and</strong><br />
temporary concrete crushers (SPT). For the purposes of our analysis, R. W. Beck has<br />
chosen to focus on the SPT since many rock crushers will operate for no more than<br />
1,080 hours per year <strong>and</strong> will not have a throughput exceeding 250 tons per hour.<br />
9/14/05
Section 9<br />
To qualify for the SPT, the operations must be at least 440 yards from any building in<br />
use as a residence, school, or place of worship. Operators must qualify for the SPT as<br />
operators of either a Tier I or Tier II crusher. This classification is determined based<br />
on number of hours of operation, number of tons processed <strong>and</strong> other factors. 1<br />
An amendment to the SPT allowing for certain exemptions to this distance rule has<br />
been proposed <strong>and</strong> is now under review at the TCEQ. In order to receive a distance<br />
exemption, an operation must either have satisfied all of the distance requirements at<br />
the time the crushing facility was built or must meet all of the following criteria:<br />
• Crushing is the result of an on-site demolition <strong>and</strong> the materials being crushed are<br />
for use at the site<br />
• Crushing takes place for a period of no more than 180 calendar days; <strong>and</strong><br />
• The site is not located in Harris or adjacent counties.<br />
A maximum fine of $10,000 per day per violation <strong>and</strong> an immediate shutdown of any<br />
operations may be imposed on any operator crushing without a permit.<br />
9.2 “Sham” Recycling<br />
In the last four years, Texas enacted legislation in response to “sham” recycling<br />
operations across the State. A “sham” recycler accepts various “recyclable” materials<br />
for a fee under the premise these materials would be recovered or reused. However,<br />
these materials often contain high levels of putrescible or non-recyclable waste <strong>and</strong><br />
may accumulate onsite to the point of public nuisance or threat to public safety <strong>and</strong><br />
health.<br />
Texas Administrative Code Title 30 Chapter 328 established the regulations for<br />
recycling facilities to promote the recovery <strong>and</strong> reuse of material <strong>and</strong> to control the<br />
existence of “sham” recyclers. Under these rules, it requires that any entity serving as<br />
the collection <strong>and</strong> processing point for recyclables register with TCEQ. It also states<br />
that any operator of recycling facilities that stores combustible materials or poses a<br />
significant risk to public health must have financial assurance for closure.<br />
However, the rules also state that if the operation is affiliated with a governmental<br />
entity, a permitted or registered solid waste facility or a company permitted to build a<br />
registered or permitted solid waste facility, it need not register with TCEQ nor provide<br />
financial assurance. Since operators or affiliates of registered or permitted disposal<br />
facilities are regulated, <strong>and</strong> therefore less likely to violate restrictions on material<br />
storage, they are exempt from additional permitting requirements.<br />
According to the Texas Administrative Code Title 30 Chapter 328.4, any facility that<br />
accepts more than incidental amounts 2 of non-recyclable waste must obtain a permit or<br />
1 A Tier I crusher has throughput not exceeding 125 tons per hour, shall not operate for more than 360<br />
hours <strong>and</strong> must be located no less than 200 feet from the nearest property line. A Tier II crusher must<br />
have a throughput not exceeding 250 tons, may not operate for more than 1,080 hours per year, <strong>and</strong><br />
must be located no less than 300 feet from the nearest property line.<br />
2 “Incidental amounts” is defined by Texas Administrative Code Title 30 Chapter 328.1 as “no more<br />
than 10 percent by volume or scale weight of each incoming load, <strong>and</strong> averages no more than 5 percent<br />
9-2 R. W. Beck 9/14/05
Legal Summary<br />
registration as a Type V solid waste facility. 3 Since this restriction essentially requires<br />
a recovery rate of greater than 95 percent, R. W. Beck believes this requirement would<br />
be difficult to achieve in practice, particularly for a C&D material recovery facility<br />
(MRF), which is discussed in more detail in Section 3. As such, any C&D MRF<br />
constructed in Texas would require either a new permit or registration or be co-located<br />
with an existing permitted or registered facility.<br />
Once a facility obtains a permit or registration to operate as a Type V facility, there are<br />
no restrictions on the amount of material it must recover. This applies to a C&D<br />
MRF, transfer station, or any other Type V facility. It is in the best interest of a<br />
facility that operates as a MRF to maximize the amount of material recovered in order<br />
to maximize revenue from recyclable material <strong>and</strong> reduce costs associated with<br />
disposing of residual at a l<strong>and</strong>fill. However, since a permitted or registered MRF is<br />
not required to maintain a specified recovery rate, any entity (e.g. local government)<br />
looking to contract with such a facility should ensure the facility is operating as a<br />
legitimate C&D MRF. Since permitted facilities are currently required to report<br />
annually to the TCEQ, <strong>and</strong> registered facilities will be required to in the future, the<br />
entity could use this data to determine how much material a facility diverts from<br />
l<strong>and</strong>fills. An entity could also request the MRF, or other facility, to provide its<br />
internal reports of material recovery rates <strong>and</strong> could contractually require the facility<br />
to maintain certain recovery rates.<br />
9.3 Green Building Legislation<br />
The State of Texas has only a small amount of legislation relating to green building.<br />
Most rules or guidelines relating to green building within Texas have been instituted<br />
on the local level <strong>and</strong> are discussed in Section 8.<br />
9.3.1 Health <strong>and</strong> Safety Code Chapter 388<br />
In 2001, the State of Texas created Chapter 388 of the Texas Health <strong>and</strong> Safety Code<br />
to ensure compliance with the Federal Clean Air Act. In this rule, Texas adopted<br />
energy efficiency codes for the construction of residential, commercial, <strong>and</strong> industrial<br />
buildings. This m<strong>and</strong>ated that municipalities enforce the new energy efficiency codes,<br />
adopt energy-efficient building policies <strong>and</strong> implement cost-effective energy<br />
efficiency measures. However, no enforcement mechanisms included with the<br />
legislation.<br />
As another way for communities to achieve buy-in from decision-makers <strong>and</strong> the<br />
building community, information on this section of the Health <strong>and</strong> Safety Code should<br />
be made available.<br />
of the total weight or volume of all materials received in the last six-month period, as substantiated by<br />
the facility’s records.”<br />
3 According to by Texas Administrative Code Title 30 Chapter 330.41, Type V facilities “shall<br />
encompass processing plants that transfer, incinerate, shred, grind, bale, compost, salvage, separate,<br />
dewater, reclaim, <strong>and</strong>/or provide other processing of solid waste.”<br />
9/14/05 R. W. Beck 9-3
Section 9<br />
9.4 Clean-Air Legislation<br />
The Federal Clean Air Act (CAA) requires states with areas that fail to meet the<br />
National Ambient Air Quality St<strong>and</strong>ards for criteria pollutants to reduce <strong>and</strong> maintain<br />
air pollution emissions in order to comply with the federal st<strong>and</strong>ards. There are<br />
several regions of Texas that do not meet the st<strong>and</strong>ards, including the Dallas/Fort<br />
Worth area. Significant efforts are currently underway to achieve reductions in<br />
emissions of oxides of nitrogen (NOx). The highest source of NOx (approximately 51<br />
percent) in the Dallas/Fort Worth area is from motor vehicles.<br />
Many of the C&D waste reduction initiatives described in this study can have a<br />
positive impact on reducing NOx in the region based on their focus to reduce the<br />
transportation of materials. For example, on-site grinding focuses on reducing<br />
transportation <strong>and</strong> disposal costs by processing <strong>and</strong> reusing materials at the same<br />
location. For example, when the City of Dallas developed the American Airlines<br />
Center, the opportunity existed to recycle 47,000 cubic yards of used concrete directly<br />
at the site. This significantly reduced the need for hundreds of truck trips that would<br />
have needed to (1) haul used material to a processing facility or l<strong>and</strong>fill <strong>and</strong> (2) bring<br />
in material from quarries that are located west of the Dallas/Fort Worth area.<br />
It is also important to note that in the future, recycling facilities, such as a C&D MRF,<br />
may present opportunities to reduce air emissions. For example, recycling facilities<br />
can delay the need for new l<strong>and</strong>fills, which will likely need to be located further<br />
distances than they currently are due to siting issues. Also, since recycling facilities<br />
can be located closer, they can provide an opportunity to reduce transportation<br />
distances.<br />
9.5 Opportunities for Additional Legislation<br />
During the research conducted for the Study, R. W. Beck identified several aggressive<br />
laws associated with C&D recycling. Provided in this section are a few examples of<br />
laws from other states that have been enacted in order to increase C&D waste<br />
diversion.<br />
9.5.1 Banning C&D from L<strong>and</strong>fill<br />
Some states have banned C&D waste or other materials from l<strong>and</strong>fills. States have<br />
found that in order for a C&D l<strong>and</strong>filling ban to be effective, it must be done on a<br />
statewide basis. Otherwise, significant levels of C&D material will flow from areas<br />
where the waste is banned to areas where it is not banned.<br />
9.5.2 Performance Measures for Achieving Recycling Goals<br />
Several states in the U.S. have instituted performance measures that require local<br />
governments to report on their recycling rate annually or semi-annually. These<br />
performance measures may involve reporting diversion rates by material or on a<br />
whole. Typically, the state’s commission on environmental quality establishes the<br />
9-4 R. W. Beck 9/14/05
Legal Summary<br />
methods <strong>and</strong> materials for the reporting <strong>and</strong> often assists communities with advice on<br />
bringing up recycling rates or data reporting.<br />
9.5.3 Enforcement Mechanisms<br />
In an effort to ensure local governments are actively pursuing the state’s recycling<br />
goals or diversion rates, some states have created legislation that acts as an<br />
enforcement mechanism. These enforcement mechanisms typically are associated<br />
with restricting the amount of funding a community receives if the goal is not met.<br />
This type of legislation typically allows the local government a certain period to<br />
increase its recycling rate or by improving existing or developing new programs such<br />
as a C&D recycling program.<br />
9/14/05 R. W. Beck 9-5
Section 9<br />
(This page intentionally left blank)<br />
9-6 R. W. Beck 9/14/05
Section 10<br />
Funding Mechanisms<br />
The following serves as a brief overview of programs currently available for funding<br />
C&D waste minimization projects. R. W. Beck focused on funding opportunities<br />
geared toward local governments, businesses <strong>and</strong> individuals interested in C&D waste<br />
minimization.<br />
Further detail, as well as contact information on each of the programs sited in this<br />
section, can be found in Table 10.1 <strong>and</strong> 10.2.<br />
10.1 C&D <strong>Waste</strong> <strong>Minimization</strong> Funding<br />
Opportunities<br />
Pilot programs for C&D waste minimization may require alternative funding sources<br />
during the project initiation period. Typically these funding sources are short-term<br />
grants or loans intended to assist the program on a finite basis. The information<br />
provided below should be used as a guide for local governments or the private sector<br />
during the planning stages of a C&D waste reduction program or project.<br />
10.1.1 Local Governments<br />
10.1.1.1 U.S. Department of Agriculture<br />
Solid waste grant No. 10.762 is offered by the U.S. Department of Agriculture’s Rural<br />
Utility Service. It may be used to provide technical assistance <strong>and</strong>/or training to help<br />
associations divert materials from l<strong>and</strong>fills. This grant could be used by COGs to<br />
provide consulting to either public or private sector entities in the design of C&D<br />
processing facilities (including C&D MRFs), C&D recycling education programs,<br />
C&D recycling pilot programs, or other uses that promote C&D recycling.<br />
10.1.1.2 U.S. Environmental Protection Agency<br />
Solid waste grant No. 66.808 is offered by the U.S. EPA’s Office of Solid <strong>Waste</strong>. One<br />
purpose for the grant is to promote the use of integrated solid waste management<br />
systems to solve municipal solid waste management problems at the local levels <strong>and</strong> to<br />
assist in advancing waste minimization programs.<br />
The EPA also offers grants to clean up areas designated as “brownfields” across the<br />
country. Brownfields are ab<strong>and</strong>oned or underused commercial or industrial facilities<br />
where redevelopment is hindered by real or perceived environmental problems. In<br />
2003, the EPA provided $73,100,000 in funding for this program. Such grants could<br />
9/14/05
Section 10<br />
be used to fund C&D debris clean-up <strong>and</strong> recycling in some brownfield designated<br />
areas.<br />
10.1.1.3 U.S. Department of Commerce<br />
The Economic Development Association, which is a part of the U.S. Department of<br />
Commerce, offers grants to state <strong>and</strong> local governments geared towards the<br />
revitalization of depressed areas of cities <strong>and</strong> towns. Such grants could help to fund<br />
local private investment in the recycling industry tied to C&D waste or reuse/salvage<br />
(e.g. the funding of a C&D MRF).<br />
10.1.1.4 North Central Texas Council of Governments<br />
The NCTCOG’s Environment & Development Services Department manages a solid<br />
waste grant program where local governments may apply for various solid waste<br />
related grants. R. W. Beck recommends that a local government wishing to exp<strong>and</strong> or<br />
establish a C&D waste minimization program/project apply for this grant under with<br />
the underst<strong>and</strong>ing that the project must be in support of pre-existing subject categories.<br />
For example, if a local government applies for a grant to fund a new green building<br />
program in its community, R. W. Beck recommends that the green building program<br />
incorporate elements of the regional strategic plan for C&D waste minimization, as<br />
well as focus on the waste management aspects of green building. NCTCOG expects<br />
to have the FY2006 call for projects for State solid waste implementation funds once<br />
the 79th legislature authorizes the program.<br />
10.1.1.5 Amy Shelton McNutt Charitable Trust<br />
This San Antonio based charity provides grants focusing on a number of fields of<br />
interest within Texas, including “improving the environment.” Based on discussions<br />
with Foundation representatives, the foundation would consider awarding grants<br />
relating to increasing recycling efforts as a way of “improving the environment.”<br />
10.1.1.6 The Meadows Foundation<br />
This Dallas based charity, which awarded nearly $26,000,000 in grants in 2004,<br />
focuses on a wide array of fields of interest within Texas, including improving the<br />
environment. The charity has awarded five grants for recycling related programs since<br />
1996. Based on discussions with Foundation representatives, grants for C&D waste<br />
minimization are within the Foundation’s scope of interest.<br />
10.1.1.7 The Home Depot Foundation<br />
The Home Depot Foundation (Foundation) has four grant initiatives, one of which is<br />
associated with aiding the environment. Based on discussions with Foundation<br />
representatives, grants for C&D waste minimization projects are within the<br />
environmental topic area.<br />
10-2 R. W. Beck 9/14/05
Funding Mechanisms<br />
10.1.2 State Governments<br />
10.1.2.1 Environmental Protection Agency<br />
The U.S. Environmental Protection Agency’s Office of Enforcement <strong>and</strong> Compliance<br />
Assurance offers a grant to foster environmental enforcement <strong>and</strong> compliance<br />
assurance activities <strong>and</strong> to improve compliance with environmental laws. This grant<br />
could be applied for by the State of Texas to enforce any laws pertaining to the<br />
recycling of C&D materials.<br />
10.2 Green Building Funding Opportunities<br />
10.2.1 Local Governments<br />
10.2.1.1 North Texas Clean Air Coalition<br />
The “TXU Clean Air Grants” is a grant program sponsored by the North Texas Clean<br />
Air Coalition (NTCAC). These grants were designed to focus on ways to reduce<br />
ozone pollution in the North Central Texas region. Grants have been awarded for a<br />
wide variety of projects including several environmental events, projects targeted to<br />
school-age children <strong>and</strong> exhibits to help educate the public about air quality concerns<br />
<strong>and</strong> solutions.<br />
The City of Frisco was awarded a grant to hold a green home fair for Frisco residents<br />
in 2003. The green home fair showcased energy efficient homes that incorporated<br />
various waste minimization strategies including the use of on-site grinding <strong>and</strong><br />
alternative erosion control methods. This was one of nine grants that were awarded in<br />
the last year to cities <strong>and</strong> non-profit organizations in the North Central Texas region.<br />
10.2.1.2 The Home Depot Foundation<br />
The Home Depot Foundation provides grants for environmental initiatives. Since the<br />
Home Depot Foundation is interested building efficient <strong>and</strong> healthy homes, green<br />
building programs that promote this type of building are in line with the programs<br />
values. Grants for green building are within the Foundation’s stated scope of interest.<br />
10.2.1.3 StEPP Foundation<br />
The StEPP Foundation aims to increase the number of energy efficiency, clean energy<br />
<strong>and</strong> pollution prevention projects implemented across the country through the funding<br />
of projects performed by governmental, non-profit, <strong>and</strong> academic entities. Based on<br />
the latest available data thee foundation awarded over $500,000 in grants in 2003.<br />
9/14/05 R. W. Beck 10-3
Section 10<br />
10.2.2 State Governments<br />
10.2.2.1 U.S. Department of Energy<br />
The DOEs State Energy Program provides grants to states from DOE’s Office of<br />
Energy Efficiency <strong>and</strong> Renewable Energy. The grants may be used to fund the<br />
deployment of new renewable energy <strong>and</strong> energy efficient technologies.<br />
10.2.2.2 U.S. Department of Energy<br />
The DOEs Office of Codes <strong>and</strong> St<strong>and</strong>ards seeks to advance energy conservation by<br />
promoting the development <strong>and</strong> implementation of energy efficient codes <strong>and</strong><br />
st<strong>and</strong>ards. Based on the latest available data from 2003, the Office provided $200,000<br />
to support the implementation of new state energy codes within Texas.<br />
10.2.3 Developers<br />
10.2.3.1 Green Communities Program<br />
The Enterprise Foundation <strong>and</strong> the Natural Resources Defense Council created the<br />
Green Communities Program in 2004. The initiative provides $550,000,000 over five<br />
years in low interest financing, grants, <strong>and</strong> technical assistance for the development of<br />
8,500 housing properties across the nation that conserve energy <strong>and</strong> natural resources.<br />
10.2.4 Individuals<br />
10.2.4.1 U.S. Department of Housing <strong>and</strong> Urban Development<br />
The U.S. Department of Housing <strong>and</strong> Urban Development (HUD) allows borrowers to<br />
finance the cost of adding energy-efficiency features to new or existing housing as part<br />
of their mortgage through its Energy Efficient Mortgages Program.<br />
10.2.4.2 U.S. Department of Energy<br />
The U.S. Department of Energy (DOE)’s Weatherization Assistance Program provides<br />
funding for low-income individuals to insulate their homes to conserve energy <strong>and</strong><br />
reduce energy costs. This grant may be used to install insulation, seal ducts, make<br />
furnace efficiency modifications, <strong>and</strong> replace inefficient air-conditioners.<br />
10.2.4.3 U.S. Department of Agriculture<br />
The U.S. Department of Agriculture made available to agricultural producers <strong>and</strong> rural<br />
small businesses over $22,000,000 in 2004 to fund renewable energy systems <strong>and</strong><br />
energy improvements. All rural areas other than cities with populations greater than<br />
50,000 <strong>and</strong> their adjacent urbanized areas are eligible for these grants.<br />
10-4 R. W. Beck 9/14/05
Funding Mechanisms<br />
10.2.4.4 State of Texas General L<strong>and</strong> Office<br />
State of Texas General L<strong>and</strong> Office’s Texas Veterans L<strong>and</strong> Board offers low interest<br />
loans to veterans involved in green building. Veterans who build new houses that<br />
meet certain st<strong>and</strong>ards for green building are provided these reduced rate home loans.<br />
This special incentive for green building is only available to veterans <strong>and</strong> is the only<br />
program of its kind offered by the State of Texas.<br />
9/14/05 R. W. Beck 10-5
Section 10<br />
Table 10-1<br />
C&D Recycling Grant Information<br />
Name of Program Typical Value Website/ Contact Information Deadlines<br />
Available to Local Governments<br />
USDA Grant #10.762 $85,000 http://12.46.245.173/cfda/cfda.html 1 N/A<br />
U.S. EPA Grant #66.808 $76,000 http://12.46.245.173/cfda/cfda.html Varies by regional<br />
office<br />
U.S. EPA Brownfields Grant $200,000 http://www.epa.gov/brownfields/archive/gannounce_arch.htm N/A<br />
Economic Development Assoc N/A http://12.39.209.165/xp/EDAPublic/InvestmentsGrants/FFON.xml N/A<br />
NCTCOG $25,000 – $100,000 http://www.nctcog.org varies<br />
Amy Shelton McNutt Charity $ 50,000 -<br />
$100,000<br />
153 Treeline Park, Ste 300,<br />
San Antonio, TX 78209<br />
March <strong>and</strong> August<br />
of each year<br />
(210) 829-1800<br />
The Meadows Foundation $25,000 - $250,000 http://www.mfi.org/ N/A<br />
The Home Depot Foundation $5,000 - $25,000 http://www.homedepotfoundation.org/hfus/enus/apply.html Four deadlines<br />
throughout the year<br />
Available to State Governments<br />
U.S. EPA Grant N/A http://www.epa.gov/compliance/ N/A<br />
1 Link to Catalog of Federal Grant Search Engine; this search engine enables user to access all federal grants. These grants may also be located by using an internet search engine such as Google.<br />
10-6 R. W. Beck 9/14/05
Funding Mechanisms<br />
Table 10-2<br />
C&D Recycling Grant Information<br />
Name of Program Typical Value Website/ Contact Information Deadlines<br />
Available to Local Governments<br />
The Home Depot Foundation $5,000 - $25,000 http://www.homedepotfoundation.org/hfus/enus/apply.html Four deadlines<br />
throughout the year<br />
StEPP Foundation $100,000 http://www.steppfoundation.org/main.htm N/A<br />
Available to State Governments<br />
U.S. DOE State Energy Program $100,000 http://www.eere.energy.gov/state_energy_program/ N/A<br />
U.S. DOE Energy Codes $50,000 - $250,000 http://www.energycodes.gov/whatwedo/ N/A<br />
Available to Developers<br />
Green Communities Program $15,000 - $50,000 http://www.enterprisefoundation.org/resources/green/QA/index.asp N/A<br />
Available to Individuals<br />
HUD Energy Efficiency $8,000 maximum http://www.hud.gov/offices/hsg/sfh/eem/energy-r.cfm N/A<br />
U.S. DOE WAP $5,000 http://www.waptac.org/sp.asp?id=1437 N/A<br />
DOA Renewable Energy Sys $135,000 http://www.rurdev.usda.gov/rd/farmbill/9006resources.html July of each year<br />
General L<strong>and</strong> Office .2% lower interest rate http://www.glo.state.tx.us/vlb/vhap/gb.html N/A<br />
9/14/05 R. W. Beck 10-7
Section 10<br />
(This page intentionally left blank)<br />
10-8 R. W. Beck 9/14/05
Section 11<br />
Strategic Approach<br />
Throughout the previous sections of this report, R. W. Beck has provided specific<br />
information regarding C&D waste minimization strategies that can be implemented in<br />
the North Central Texas region. C&D waste minimization represents a relatively new<br />
focus for the North Central Texas region. Therefore, effectively implementing these<br />
strategies requires a strategic approach to implementing both the programs <strong>and</strong> the<br />
public awareness campaign. R. W. Beck developed a strategic approach that includes<br />
the following tactics, which are presented in order of when they should be<br />
implemented:<br />
• Obtain “buy-in” from local governments, recycling <strong>and</strong> construction industries<br />
<strong>and</strong> consumers.<br />
• Establish roles <strong>and</strong> responsibilities for the multiple participants.<br />
• Further investigate the feasibility of a C&D MRF in the North Central Texas<br />
region.<br />
• Provide necessary information to the recycling <strong>and</strong> construction industries that<br />
will encourage implementation of the strategies.<br />
• Distribute comprehensive public awareness materials to consumers who can<br />
directly affect the success of the program.<br />
• Implement applicable waste minimization programs.<br />
One of the keys to a successful C&D waste minimization program is to increase<br />
participation from key entities or individuals (stakeholders) including:<br />
• Regional Government;<br />
• Local Governments;<br />
• <strong>Construction</strong> <strong>and</strong> Recycling Industries; <strong>and</strong><br />
• Consumers.<br />
Due to the multiple participants involved, it is essential to identify <strong>and</strong> clarify the roles<br />
<strong>and</strong> responsibilities of the stakeholders involved in implementing the C&D waste<br />
minimization strategies. The following section outlines the identified roles <strong>and</strong><br />
responsibilities for each stakeholder. It is important for the stakeholders to underst<strong>and</strong><br />
that successful completion of a ‘responsibility’ may depend on assistance from another<br />
entity or may be an activity without a specific completion date. Therefore, R. W.<br />
Beck has provided a five-year action plan, provided in Table 11-2, that specifies the<br />
estimated time frame for the role or responsibility <strong>and</strong> the possible need for<br />
participation from another stakeholder.<br />
9/14/05
Section 11<br />
A public awareness campaign must be incorporated into the strategic plan that<br />
maximizes the opportunity to provide up-to-date information promoting the benefits of<br />
the program specific to each type of participant. Distributing the information to the<br />
multiple stakeholders is key to obtaining the results that have been seen in the case<br />
studies or research conducted in the previous sections.<br />
11.1 Regional Government - NCTCOG<br />
11.1.1 Become the regional coordinator of C&D waste<br />
minimization strategies.<br />
NCTCOG as the regional association of local governments should take a lead role in<br />
implementing the strategic approach for waste minimization programs <strong>and</strong> the public<br />
awareness campaign. Initiating the public awareness campaign at the regional level<br />
provides for the opportunity to leverage resources <strong>and</strong> to send a coordinated message.<br />
As regional coordinator, NCTCOG would be directly involved in the coordination of<br />
the multiple aspects of implementing the C&D waste minimization strategies.<br />
Coordination activities will include but not be limited to the following:<br />
• Establish waste minimization subcommittee.<br />
• Develop public awareness campaign.<br />
• Sponsor or host technical workshops.<br />
• Facilitate outreach <strong>and</strong> technical assistance activities.<br />
• Provide grant funding.<br />
These coordination activities are discussed in more detail in the following subsections.<br />
The active participation of NCTCOG in the waste minimization strategies should<br />
encourage local governments to become involved <strong>and</strong> take a greater role in<br />
implementing the programs that could be established at the local government level.<br />
11.1.2 Establish subcommittee for coordination of waste<br />
minimization programs <strong>and</strong> public awareness<br />
campaign.<br />
NCTCOG has been successful in implementation of other programs through the<br />
establishment of subcommittees. Establishment of a waste minimization<br />
subcommittee is a critical component to reaching out <strong>and</strong> involving the local<br />
governments <strong>and</strong> recycling <strong>and</strong> construction industries. Subcommittees can provide<br />
the opportunity to accomplish the following objectives:<br />
• Provide technical support <strong>and</strong> coordination for the implementation of waste<br />
minimization strategies.<br />
• Establish a network of contacts for the exchange of information.<br />
11-2 R. W. Beck 9/14/05
Strategic Approach<br />
• Identify future research that can be conducted through NCTCOG.<br />
• Conduct a thorough analysis of the C&D recycling market for the possible<br />
implementation of a C&D MRF.<br />
• Ensure consistency in the public awareness message that is being distributed to<br />
the stakeholders.<br />
NCTCOG would provide the facility space <strong>and</strong> a staff person to facilitate the<br />
subcommittee. NCTCOG staff can also schedule speakers to conduct “brown bag”<br />
luncheons for the subcommittee. Dedicating a portion of a NCTCOG staff’s time to<br />
waste minimization efforts helps to ensure that interested local governments <strong>and</strong><br />
industry participants will have a contact for up-to-date information.<br />
The subcommittee that is currently in place for this study could continue to serves as<br />
the subcommittee for the implementation of waste minimization strategies. This<br />
subcommittee would need to meet regularly (e.g. quarterly) to maintain the focus on<br />
these strategies.<br />
11.1.3 Further Investigate the Feasibility of a C&D MRF in the<br />
North Central Texas region.<br />
Section 3, “C&D Material Recovery Facility (MRF) Case Study,” examined the<br />
concept of operating a C&D MRF in the North Central Texas region. On a<br />
preliminary basis, this research indicated that a C&D MRF could be feasible in this<br />
region. However, there is still a need to conduct more detailed analyses. This analysis<br />
should focus on evaluating the feasibility of a C&D MRF in a specific area of North<br />
Central Texas that generates a significant quantity of C&D debris. One potential area<br />
for this analysis would be the North Texas Municipal Water District <strong>and</strong> its member<br />
communities — based on their projected high growth rates, operation of a subregional<br />
l<strong>and</strong>fill <strong>and</strong> interest in developing C&D waste minimization strategies. This feasibility<br />
analysis would ideally evaluate the following:<br />
• Current <strong>and</strong> projected amount <strong>and</strong> composition C&D debris generated<br />
• Market analysis concerning potential sales prices for processed commodities<br />
• Site visits to three other C&D MRFs in the U. S. to further evaluate facility needs<br />
(e.g. equipment, labor, buildings, etc.)<br />
• Potential locations for the C&D MRF (e.g. current l<strong>and</strong>fill or transfer station;<br />
closed l<strong>and</strong>fill)<br />
• Planning level cost analysis (based on research included in Section 3 of this report<br />
plus results from the waste composition analysis, market analysis, site visits to<br />
other MRFs <strong>and</strong> potential facility location)<br />
• Description of the conceptual facility<br />
• Planning level impact of C&D debris diversion on l<strong>and</strong>fill operations, finances,<br />
<strong>and</strong> remaining l<strong>and</strong>fill capacity<br />
• Development of budget <strong>and</strong> schedule to plan, design, <strong>and</strong> build a C&D MRF<br />
9/14/05 R. W. Beck 11-3
Section 11<br />
This type of analysis should be developed to provide other private <strong>and</strong> public sector<br />
entities in North Central Texas that have an interest in a C&D MRF with an<br />
underst<strong>and</strong>ing of the process they would need to initiate to also develop a facility.<br />
11.1.4 Provide outreach <strong>and</strong> technical assistance activities<br />
for local governments.<br />
In order to maintain interest in waste minimization strategies, NCTCOG should<br />
establish outreach activities focused on providing opportunities for local governments<br />
to continue to explore waste minimization programs. NCTCOG can sponsor<br />
workshops <strong>and</strong> seminars on topics that interest local governments. Examples of these<br />
workshop topics include:<br />
• How to establish a green building or LEED program.<br />
• Development of public sector initiatives (e.g. contractor education program, fast<br />
track permitting, ordinance establishing a green building or LEED rating<br />
program).<br />
• Establishment of a regional C&D MRF.<br />
• Review of funding mechanism for implement of waste minimization programs.<br />
NCTCOG can use these workshops to gauge the interest of the local governments. To<br />
the extent that local governments are interested in establishing a local program, the<br />
NCTCOG should be a technical assistance resource. R. W. Beck would emphasize<br />
that the expectation is not for NCTCOG staff to be experts in all areas of waste<br />
minimization programs. However, it should be the role of NCTCOG to direct the<br />
stakeholders to the appropriate resource provider.<br />
11.1.5 Develop a regional public awareness campaign.<br />
Due to NCTCOG’s involvement in other regional solid waste management programs,<br />
NCTCOG can use current resources <strong>and</strong> staff to design public awareness materials<br />
that can be provided to the local governments for distribution. Examples from<br />
national associations <strong>and</strong> other state agencies that focus on C&D waste minimization<br />
can help provide NCTCOG with examples for use in developing these marketing<br />
materials. Table 11-1 provides a list of websites that serve as examples of public<br />
awareness campaigns. In Appendix F, R. W. Beck has provided examples of logos<br />
<strong>and</strong> slogans used in other C&D waste minimization campaigns.<br />
11-4 R. W. Beck 9/14/05
Strategic Approach<br />
Table 11-1<br />
Public Awareness Campaign Examples<br />
Organization<br />
City of Austin, TX<br />
Metropolitan Partnership for<br />
Energy <strong>and</strong> Greater San Antonio<br />
Builders Association<br />
City of Seattle, Washington<br />
Florida Department of<br />
Environmental Protection<br />
Oregon Department of<br />
Environmental Quality<br />
Website<br />
www.ci.austin.tx.us/greenbuilder<br />
www.buildsagreen.org<br />
www.cityofseattle.net/dpd/sustainability<br />
www.dep.state.fl.us/waste/categories/recycling/pages/c<strong>and</strong>dmain.htm<br />
www.deq.state.or.us/wmc/solwaste/rsw.htm<br />
Similar to other public awareness campaigns currently being conducted (e.g. illegal<br />
dumping), NCTCOG should develop a regional public awareness campaign that<br />
includes the following:<br />
• A focused message through the use of slogans <strong>and</strong> emblems.<br />
• Development of information <strong>and</strong> tools that can be used by the local governments<br />
<strong>and</strong> Builders’ Associations including pamphlets, brochures, camera-ready<br />
artwork, <strong>and</strong> signs.<br />
• Distribution of regional information directly to the consumers through the use of<br />
the NCTCOG website, media kits, <strong>and</strong> press releases.<br />
In addition, the North Central Texas region can develop an awards program or design<br />
competition similar to the City of Seattle’s design competition that includes<br />
workshops <strong>and</strong> is geared toward increasing participation from the residential<br />
construction industry.<br />
NCTCOG also has the ability to readily distribute information to its subcommittee<br />
members either who are key individuals in the solid waste industry or who have direct<br />
connections to solid waste industry members. This distribution method can be used<br />
initially to gauge interest in the implementation of these strategies in the North Central<br />
Texas region. Once the initial information is distributed to key individuals in the local<br />
governments <strong>and</strong> the recycling <strong>and</strong> construction industries, R. W. Beck recommends<br />
that the long-term distribution of information be established by the subcommittee, as<br />
discussed in the previous subsection.<br />
11.1.6 Provide grant assistance to local governments for<br />
development of waste minimization programs.<br />
As discussed in Section 10 Funding Mechanisms, NCTCOG provides a Solid <strong>Waste</strong><br />
Grant program to local governments who may apply for solid waste related grants.<br />
One of the impediments to implementing a successful C&D waste minimization<br />
9/14/05 R. W. Beck 11-5
Section 11<br />
program can be finding the funding to develop a program that has start-up costs but<br />
has a limited revenue source. In addition, some local government waste minimization<br />
programs may not have a revenue stream because the local government’s role in the<br />
program is purely administrative. For example, a local government may decide to<br />
adopt an ordinance requiring certain buildings that are to be demolished or constructed<br />
receive a LEED rating. City staff will need to spend time developing materials <strong>and</strong><br />
enforcing the ordinance. The City may not realize any financial compensation for the<br />
administration of this program. However, a successful program will benefit the city<br />
by decreasing the amount of C&D waste hauled to the l<strong>and</strong>fill <strong>and</strong> increasing the reuse<br />
of materials. The NCTCOG grants program as well as the other grant programs<br />
mentioned in Section 10 should be utilized in circumstances in which the costs may<br />
prohibit the public sector from becoming involved even if there are substantial<br />
community benefits.<br />
11.1.7 Develop a website that promotes C&D waste<br />
minimization efforts in the North Central Texas region.<br />
Once the public awareness campaign has begun <strong>and</strong> stakeholders are aware of the<br />
C&D recycling goals of the region, then NCTCOG should develop <strong>and</strong> host a website<br />
that shares resources between all stakeholders. It is necessary for the success of waste<br />
minimization programs to develop a website that can be easily accessed by all<br />
stakeholders. The information contained on the website can include, but may not be<br />
limited to:<br />
• Specific information about current C&D waste minimization programs.<br />
• Listing of companies providing C&D waste minimization services.<br />
• Links to other information resources.<br />
11.1.8 Develop <strong>and</strong> implement regional green building<br />
program.<br />
As mentioned in Section 2 Green Building Case Study, the NCTCOG can also become<br />
involved in the actual implementation of a green building program. Based on the<br />
green building program research conducted, a regional or sub-regional green building<br />
program could be successful in the North Central Texas region. NCTCOG could take<br />
the lead in establishing a regional green building program which would provide<br />
economies of scale to more efficiently fund public awareness <strong>and</strong> technical assistance<br />
needs. In order to encourage the construction industry to become involved in green<br />
building, it is important to establish regional consistency of procedures or rules for<br />
green building programs.<br />
11-6 R. W. Beck 9/14/05
Strategic Approach<br />
11.2 Local Governments<br />
11.2.1 Participate in NCTCOG waste minimization<br />
subcommittee, if established.<br />
Local governments who have an interest in implementing waste minimization<br />
programs in their community should designate a representative to attend or participate<br />
in the NCTCOG waste minimization subcommittee, if established. Participating in the<br />
subcommittee will provide networking opportunities with other industry professionals<br />
in the North Central Texas region who are also working to implement these new<br />
strategies into their solid waste management operation. Encouraging representation<br />
from the various stakeholders throughout the region helps to ensure consistency<br />
throughout the region.<br />
11.2.2 Develop methods for increasing participation from the<br />
recycling <strong>and</strong> construction industries.<br />
As previously discussed, NCTCOG should be the regional coordinator for the<br />
implementation of the waste minimization strategies. However, local governments<br />
will play a key role in working with NCTCOG to increase participation from the<br />
recycling <strong>and</strong> construction industries. Section 8 Public Sector Initiatives provides<br />
detailed information on numerous initiatives that local governments can evaluate for<br />
implementation in their community. It is important that local government officials to<br />
take the time to consider which public sector initiatives are feasible for their<br />
community. These public sector initiatives may include:<br />
• Adopting an ordinance to establish a green building <strong>and</strong> or LEED rating program.<br />
• Providing a contractor education program that focuses on illustrating the value of<br />
C&D recycling to contractors.<br />
• Providing fast track permitting to those builders who are participating in a waste<br />
minimization program.<br />
• Encouraging the use of waste management plans that emphasize C&D waste<br />
minimization for projects that require city building permits.<br />
• Developing or supporting the development of a C&D reuse facility (i.e. Habitat<br />
for Humanity resale).<br />
• Development of a C&D MRF.<br />
11.2.3 Work with NCTCOG in developing <strong>and</strong> distributing<br />
public awareness materials focused on the recycling<br />
<strong>and</strong> construction industries.<br />
After the local government has determined the waste minimization programs that they<br />
will begin implementing, the local government should work with NCTCOG to<br />
9/14/05 R. W. Beck 11-7
Section 11<br />
distribute relevant public awareness materials. The regional public awareness<br />
materials developed by the NCTCOG may be adequate depending on the program.<br />
However, it may be necessary for the local government to develop additional public<br />
awareness materials containing specific information on local waste minimization<br />
programs.<br />
The construction industry already works directly with the city in obtaining building<br />
permits. Public awareness materials can be distributed during this time. In addition,<br />
the local government can use the following resources to distribute information to<br />
industry professionals:<br />
• Partnering with Builders’ Associations;<br />
• Internet site;<br />
• Promotional videos; <strong>and</strong><br />
• Telephone calls to answer questions from builders <strong>and</strong> recycling companies.<br />
11.2.4 Work with NCTCOG in developing <strong>and</strong> distributing<br />
public awareness materials focused on the consumers.<br />
Once the recycling <strong>and</strong> construction industries have become involved in the waste<br />
minimization programs, the NCTCOG <strong>and</strong> local governments can begin to inform<br />
consumers about the new programs. The local governments can assist NCTCOG in<br />
the distribution of information to their citizens through the following resources:<br />
• Pamphlets in utility bills;<br />
• Internet site with a list of certified green builders;<br />
• Articles for local newspapers;<br />
• Public service announcements <strong>and</strong> advertisements via television <strong>and</strong> radio;<br />
• Public speaking at community events; <strong>and</strong><br />
• Telephone calls to answer questions from consumers.<br />
Another method that has been used in other regions to promote green building<br />
programs is to host or participate in a parade of (green building) homes.<br />
11.3 Recycling <strong>and</strong> <strong>Construction</strong> Industries<br />
11.3.1 Participate in NCTCOG waste minimization<br />
subcommittee, if established.<br />
Similar to local governments, recycling <strong>and</strong> construction industry professionals who<br />
have an interest in implementing or providing waste minimization programs <strong>and</strong><br />
services should designate a representative to attend or participate in the NCTCOG<br />
waste minimization subcommittee, if established. Participating in the subcommittee<br />
will provide networking opportunities with other industry professionals in the North<br />
11-8 R. W. Beck 9/14/05
Strategic Approach<br />
Central Texas region who are also working to implement these new strategies into<br />
their solid waste management operation. Encouraging representation from the various<br />
stakeholders throughout the region helps to ensure consistency throughout the region.<br />
11.3.2 Utilize Builders’ Associations as primary resource for<br />
construction industry.<br />
Builders’ Associations (BA’s) should become an integral part in the implementation of<br />
waste minimization programs that require the involvement of the recycling <strong>and</strong><br />
construction industries. BA’s can utilize the following methods to assist in<br />
encouraging members to support waste minimization programs:<br />
• Host training <strong>and</strong> technical seminars for members that focus on specific topics.<br />
• Provide one-on-one technical assistance to members.<br />
• Include waste minimization articles in industry publications.<br />
• Work with local government to proactively attract green building conferences to<br />
the region.<br />
• Identify large production home builders to use as a resource to encourage other<br />
large production home builders to utilize waste minimization strategies such as<br />
on-site grinding.<br />
• Develop builder certificates, yard signs <strong>and</strong> camera ready art work for use in<br />
displaying on green or LEED certified buildings.<br />
BA’s can coordinate these events with the assistance of NCTCOG <strong>and</strong>/or local<br />
governments.<br />
11.3.3 <strong>Construction</strong> industry needs to recognize the value of<br />
<strong>and</strong> begin the implementation of waste minimization<br />
strategies.<br />
In order to implement waste minimization strategies, builders will need to “buy into”<br />
the concept that these strategies will benefit them. Conducting the activities described<br />
in the previous subsections will assist in helping promote the benefits of waste<br />
minimization to builders. It is the responsibility of the construction industry to take<br />
the time to participate in the technical sessions provided <strong>and</strong> to read the distributed<br />
public awareness materials. It is imperative that the construction industry underst<strong>and</strong><br />
that their participation in waste minimization efforts will drive the success of the<br />
programs.<br />
11.3.4 Recycling industry must be proactive in marketing<br />
services.<br />
A majority of the C&D recycling companies in the North Central Texas region are<br />
smaller companies. Therefore, it would be beneficial for companies in the recycling<br />
9/14/05 R. W. Beck 11-9
Section 11<br />
industry to collaborate in marketing their C&D waste minimization services. Working<br />
with NCTCOG to establish a website that allows for the exchange of information can<br />
benefit both the recycling companies as well as the waste minimization programs.<br />
11.3.5 Incorporate the benefits of waste minimization<br />
strategies in marketing campaigns.<br />
The final tactic in the strategic approach is for the recycling <strong>and</strong> construction<br />
industries to incorporate waste minimization information into their current marketing<br />
campaigns. By incorporating this information, the construction <strong>and</strong> recycling<br />
industries will be able to assist NCTCOG <strong>and</strong> local governments in providing public<br />
awareness information directly to the consumers.<br />
11-10 R. W. Beck 9/14/05
Strategic Approach<br />
Table 11-2<br />
Five-year Action Plan – Strategic Approach<br />
Recommendation<br />
Leader <strong>and</strong><br />
Involved<br />
Stakeholder<br />
FY<br />
2005 - 06<br />
FY<br />
2006 - 07<br />
FY<br />
2007 - 08<br />
FY<br />
2008 - 09<br />
FY<br />
2009 - 10<br />
North Central Texas Council of Governments (NCTCOG)<br />
11.1.1<br />
11.1.2<br />
11.1.3<br />
Become the regional coordinator of C&D waste<br />
minimization strategies.<br />
Establish subcommittee for coordination of waste<br />
minimization programs <strong>and</strong> public awareness campaign.<br />
Further investigate the C&D waste stream in the North<br />
Central Texas region<br />
NCTCOG<br />
NCTCOG<br />
• Local<br />
Governments<br />
• Recycling <strong>and</strong><br />
<strong>Construction</strong><br />
Industries<br />
NCTCOG<br />
11.1.4<br />
Provide outreach <strong>and</strong> technical assistance activities for<br />
local governments.<br />
11.1.5 Develop a regional public awareness campaign.<br />
11.1.6<br />
Provide grant assistance to local governments for<br />
development of waste minimization programs.<br />
NCTCOG<br />
• Local<br />
Governments<br />
NCTCOG<br />
• Local<br />
Governments<br />
• Recycling <strong>and</strong><br />
<strong>Construction</strong><br />
Industry<br />
NCTCOG<br />
• Local<br />
Governments<br />
x<br />
x<br />
9/14/05 R. W. Beck 11-11
Section 11<br />
11.1.7<br />
11.1.8<br />
Develop a website to promotes C&D waste<br />
minimization efforts in the North Central Texas region.<br />
Develop <strong>and</strong> implement regional green building<br />
program.<br />
NCTCOG<br />
• Local<br />
Governments<br />
• Recycling <strong>and</strong><br />
<strong>Construction</strong><br />
Industries<br />
NCTCOG<br />
• Local<br />
Governments<br />
• Recycling <strong>and</strong><br />
<strong>Construction</strong><br />
Industries<br />
Local Governments<br />
11.2.1<br />
11.2.2<br />
11.2.3<br />
11.2.4<br />
Participate in NCTCOG waste minimization<br />
subcommittee, if established.<br />
Develop methods for increasing participation from the<br />
recycling <strong>and</strong> construction industries.<br />
Work with NCTCOG in developing <strong>and</strong> distributing<br />
public awareness materials focused on the recycling <strong>and</strong><br />
construction industries.<br />
Work with NCTCOG in developing <strong>and</strong> distributing<br />
public awareness materials focused on the consumers.<br />
NCTCOG<br />
• Local<br />
Governments<br />
• Recycling <strong>and</strong><br />
<strong>Construction</strong><br />
Industries<br />
NCTCOG<br />
• Local<br />
Governments<br />
NCTCOG<br />
• Local<br />
Governments<br />
NCTCOG<br />
• Local<br />
Governments<br />
11-12 R. W. Beck 9/12/05
DRAFT<br />
Strategic Approach<br />
Recycling <strong>and</strong> <strong>Construction</strong> Industries<br />
11.3.1<br />
11.3.2<br />
11.3.3<br />
11.3.4<br />
11.3.5<br />
Participate in NCTCOG waste minimization<br />
subcommittee, if established.<br />
Utilize Builders’ Associations as primary resource for<br />
construction industry.<br />
<strong>Construction</strong> industry needs to recognize the value <strong>and</strong><br />
begin the process of implementing waste minimization<br />
strategies.<br />
Recycling industry must be proactive in marketing<br />
services.<br />
Incorporate the benefits of waste minimization<br />
strategies in marketing campaigns.<br />
NCTCOG<br />
• Local<br />
Governments<br />
• Recycling <strong>and</strong><br />
<strong>Construction</strong><br />
Industries<br />
Recycling <strong>and</strong><br />
<strong>Construction</strong><br />
Industries<br />
<strong>Construction</strong><br />
Industry<br />
Recycling<br />
Industry<br />
Recycling <strong>and</strong><br />
<strong>Construction</strong><br />
Industries<br />
9/14/05 R. W. Beck 11-13
Section 11<br />
(This page intentionally left blank)<br />
11-14 R. W. Beck 9/14/05
Appendix A<br />
Local Government Assistance Documents<br />
Green Building Program Single Family Residential Rating – City of Austin<br />
Green Building Ordinance – City of Frisco<br />
LEED/Green Building Resolution – City of Dallas<br />
Model <strong>Construction</strong> <strong>and</strong> <strong>Demolition</strong> Diversion Ordinance – California Integrated<br />
<strong>Waste</strong> Management Board<br />
9/13/05
Appendix B<br />
C&D Materials Summary<br />
Appendix B provides an overview of the types of C&D materials that may be recycled, reused or reduced <strong>and</strong> a materials matrix that a<br />
briefly describes some of the materials. Further detail on the costs <strong>and</strong> benefits of recycling specific materials are detailed in Sections<br />
2 through 6 of the Study. In the table below, the target column refers to the type of construction where the material is found in enough<br />
volume or quantity for waste minimization strategies to potentially cost-effective. The following abbreviations have been used for this<br />
analysis:<br />
<strong>Construction</strong> Audience<br />
NC = New <strong>Construction</strong> Comm = Commercial<br />
R = Renovation Res = Residential<br />
D = <strong>Demolition</strong>/Deconstruction All = All Types of <strong>Construction</strong>.<br />
All = All methods<br />
Appendix A-1<br />
C&D Materials Matrix<br />
Material<br />
Brick/Mortar<br />
Carpet<br />
Most Common Uses / Special Requirements<br />
In small quantities, brick <strong>and</strong> mortar can be reduced by a grinder <strong>and</strong> used<br />
on-site as a soil amendment or backfill. Larger quantities of brick can be<br />
taken to a concrete crushing facility.<br />
Varies by type <strong>and</strong> maker of carpet, such as vinyl-backed carpet, BASF or<br />
DuPont carpet may offer a “take-back” for the lifetime of the material.<br />
Dallas area Habitat for Humanity will also take in new carpet remnants,<br />
that may be resold to others.<br />
Target<br />
<strong>Construction</strong> Audience<br />
Incentive to User<br />
All All Brick <strong>and</strong> mortar is very<br />
dense <strong>and</strong> expensive to<br />
dispose if disposed by the<br />
ton, may be more costefficient<br />
to crush.<br />
All All Pick-up or self-haul options<br />
are typically available based<br />
on amount of material <strong>and</strong><br />
type of material as well as<br />
availability in the NCT region.<br />
Websites / Reports<br />
www.ciwmb.ca.gov<br />
www.habitatforhumanity.com<br />
Sarasota County: 2000<br />
Carpet Recycling Report 1<br />
King County, WA – Special<br />
Recycling Opportunities<br />
Report 2<br />
R. W. Beck 9/14/05
Appendix B<br />
Ceiling Tiles<br />
Armstrong requires that tiles to be picked up for recycling must be clean<br />
<strong>and</strong> dry <strong>and</strong> stacked in 4’ x 4’ shipping pallets. Armstrong will pick up this<br />
material at no cost provided there is enough recyclable to fill up one of its<br />
trucks (about 30,000 sq ft worth of ceiling tiles). In cases in which there<br />
are not enough recyclables to fill up a truck, the supplier of the tiles would<br />
bear the cost of delivering them to an Armstrong facility.<br />
Copper wire along with other metals is often more easily recycled since<br />
this material is in dem<strong>and</strong>. The recycling/reuse of this material is most<br />
likely already being done by the contractors. Copper is often stolen from<br />
construction sites.<br />
Concrete is recycled primarily for use as aggregate for road construction<br />
projects, for use as erosion control, <strong>and</strong> reuse in concrete production.<br />
Must meet st<strong>and</strong>ards for location of concrete crushing <strong>and</strong> material<br />
composition st<strong>and</strong>ards.<br />
R, D Comm No costs associated with<br />
transportation or disposal of<br />
materials if over 30,000 sq ft.<br />
www.armstrong.com<br />
King County, WA – Special<br />
Recycling Opportunities<br />
Report 2<br />
Copper Wire<br />
D Comm The general contractor could<br />
gain revenue by selling the<br />
rights to the copper in a<br />
building<br />
www.ciwmb.ca.gov<br />
Concrete<br />
All Comm Concrete is very dense <strong>and</strong><br />
expensive to dispose if<br />
disposed by the ton, may be<br />
more cost-efficient to crush.<br />
TxDOT Report: “The Year of<br />
Recycled Roadway<br />
Material” 3<br />
TCEQ St<strong>and</strong>ard Air Permit<br />
Reports 4<br />
Drywall<br />
New drywall that is free of contaminates can be reduced by grinding <strong>and</strong><br />
used on-site as a soil amendment. In cases where significant amounts of<br />
drywall exists (i.e. more than a residential new construction site), drywall<br />
can be used for agricultural purposes, in concrete, or to make new drywall.<br />
Based on conversations with TCEQ, the use of non-contaminated drywall<br />
in small amounts, like the amount you would find at a residential new<br />
construction site, is acceptable to be used as a soil amendment.<br />
NC, R All Cost avoidance strategy for<br />
backfill. May wish to explore<br />
other end markets for drywall<br />
such as agriculture if large<br />
amount of drywall is<br />
available.<br />
Florida DEP: Report on the<br />
Development of Drywall<br />
Processing 5<br />
UGA – On-site Beneficial<br />
Use of Scrap Wallboard in<br />
Georgia Residential<br />
<strong>Construction</strong> 6<br />
Lamps/Glass<br />
Tubes<br />
Fluorescent lamps have aluminum caps, glass, brass <strong>and</strong> mercury that<br />
can be recycled. Recycled glass used in the manufacture of fiber glass<br />
insulation now constitutes the second highest volume of post-consumer<br />
glass.<br />
R,D All Depending on the quantity of<br />
lamps <strong>and</strong> tubes, may be<br />
required to h<strong>and</strong>le as HHW.<br />
NRCAN.org – Fluorescent<br />
Tube Recycling (article) 7<br />
Old Corrugated<br />
Cardboard<br />
C&D cardboard is typically collected commingled with debris on-site <strong>and</strong><br />
separated at MRF’s, transfer stations or l<strong>and</strong>fills. The cardboard is then<br />
either baled directly on at the transfer station or l<strong>and</strong>fill or sold to a third<br />
party facility for processing <strong>and</strong> sale. Cardboard may be reused in<br />
cardboard or paperboard (ie cereal boxes) products. A small percentage<br />
of recycled cardboard is used for composting <strong>and</strong> roofing felt for new<br />
construction.<br />
NC,R All Typically bulky <strong>and</strong> lightweight<br />
may fill a disposal<br />
container, recycling OCC<br />
would be a way for a<br />
contractor to reduce the<br />
number of pick-ups (i.e.<br />
reduce costs)<br />
Various C&D MRF Studies<br />
<strong>and</strong> C&D recycling articles<br />
B-2 R. W. Beck 9/14/05
C&D Materials Summary<br />
Other Metals<br />
Roofing<br />
Structural<br />
Wood<br />
Untreated<br />
Wood<br />
Metals, such as steel, copper, tin, aluminum, <strong>and</strong> lead, are marketed to<br />
mills <strong>and</strong> smelting operations. Metals make up only 2% of the C&D waste<br />
stream tonnage, the recycling markets for these products are well<br />
established nationwide <strong>and</strong> within North Texas. Market prices of recyclable<br />
metals in general fluctuate significantly due to changes in dem<strong>and</strong>. The<br />
recycling/reuse of this material is most likely already being done by the<br />
contractors.<br />
Roofing materials (i.e. asphalt) is commonly recovered into new hot-mix<br />
asphalt, a material used for surfacing roadways. Few other options for the<br />
reuse of asphalt are currently available. The use of asphalt as fill is<br />
prohibited, despite the fact that research has indicated that recovered<br />
asphalt used as fill does not leach potentially toxic materials into the<br />
environment any more than would be expected in using crushed cement<br />
as fill. Built-up roofing should be tested for asbestos content.<br />
Framing, plywood sub-floor, studs, <strong>and</strong> decking can be reduced by<br />
grinding <strong>and</strong> applied as a backfill or used as a mulch berm. One of the<br />
most abundant materials at residential construction sites. Structural wood<br />
can also be taken to a reuse facility or picked up by a reuse facility staff.<br />
L<strong>and</strong> clearing debris can be reduced by grinding <strong>and</strong> applied as a soil<br />
amendment or used as a mulch berm. One of the most abundant<br />
materials at residential construction sites.<br />
D Comm The general contractor could<br />
gain revenue by selling the<br />
rights to the metals in a<br />
building<br />
R, D All Typically, there is a large<br />
quantity of roofing wastes<br />
during construction activities.<br />
May be cost-effective to avoid<br />
disposal fees through<br />
recycling.<br />
All Res Cost avoidance strategy for<br />
backfill or silt fencing.<br />
All All Cost avoidance strategy for<br />
backfill or silt fencing.<br />
www.ciwmb.ca.gov<br />
King County, WA – Special<br />
Recycling Opportunities<br />
Report 2<br />
Triangle J COG: Regional<br />
Wood <strong>Waste</strong> Stream<br />
Analysis 8<br />
Triangle J COG: Regional<br />
Wood <strong>Waste</strong> Stream<br />
Analysis 8<br />
Notes:<br />
1 Sarasota County - http://www.dep.state.fl.us/waste/quick_topics/publications/shw/recycling/InnovativeGrants/IGyear1/finalreports/sarasota.pdf<br />
2 King County - http://www.pprc.org/pubs/greencon/demo.cfm<br />
8 Triangle J COG - http://www.tjcog.dst.nc.us/<br />
3 TxDOT - http://www.dot.state.tx.us/GSD/recycle/default.htm<br />
4 TCEQ - http://www.tnrcc.state.tx.us/permitting/airperm/nsr_permits/files/amendtrc.pdf<br />
5 FDEP – http://www.dep.state.fl.us/waste/quick_topics/publications/shw/recycling/InnovativeGrants/IGyear2/reports/drywall2.pdf<br />
6 University of Georgia - http://pubs.caes.uga.edu/caespubs/pubs/PDF/C857.pdf<br />
7 NRCAN.org - http://www.nrcan.gc.ca/mms/canmet-mtb/mmsl-lmsm/rnet/consarte.htm<br />
9/14/05 R. W. Beck B-3
A Total <strong>Waste</strong> from Phase I 2,302.59 tons<br />
Appendix C<br />
Hensley Site Phase I Material Diversion Analysis<br />
B Determine Recoverable Materials<br />
Material / Item Amount Diverted from L<strong>and</strong>fill Amount Sent to L<strong>and</strong>fill<br />
(by refuse, salvage or recycle)<br />
1 L<strong>and</strong> Clearing Debris - lbs<br />
2 Fencing 250.00 lbs<br />
3 Asphaltic concrete - lbs<br />
4 Rigid foam Insulation lbs 1,350.00<br />
5 Asphalt Shingles lbs -<br />
6 Paint lbs -<br />
7 Window glass lbs 300.00<br />
8 Salvaged Equip. & Access. 414.00 lbs<br />
9 Lead 9,000.00 lbs<br />
10 HDPE (High density Polyethylene)<br />
- lbs<br />
11 Cardboard, Paper & Packaging - lbs<br />
12 Carpet & Pad - lbs 575.00<br />
13 Acoustical ceiling tile 17,950.00 lbs<br />
14 Acoustical Ceiling grid 6,310.00 lbs<br />
15 Acoustical Ceiling Insulaiton lbs 3,500.00<br />
16 HVAC Ductwork 47,060.00 lbs<br />
17 HVAC Insulation lbs 18,760.00<br />
18 HVAC Flexible Duct lbs 4,700.00<br />
19 HVAC Diffusers & Grilles - lbs<br />
20 HVAC Fiberglass Plennums lbs 2,250.00<br />
21 HVAC Pipe & Valves 30,900.00 lbs<br />
22 HVAC Pipe Insulation lbs 28,380.00<br />
23 HVAC Equipment 22,530.00 lbs<br />
24 Electrical Conduit & Connectors<br />
33,915.00 lbs<br />
25 Electrical Wiring 14,724.00 lbs<br />
26 Electrical Panels & Switches 10,200.00 lbs 930.00<br />
27 Electrical Transformers 930.00 lbs<br />
28 Electrical Ballasts 1,006.00 lbs<br />
29 Electrical Light Tubes 675.00 lbs<br />
30 Electrical Plugs & Siwtches - lbs 3,180.00<br />
31 Electrical Fittings 3,940.00 lbs<br />
32 Plumbing Fixtures 1,250.00 lbs<br />
33 Plumbing China Fixtures lbs 2,000.00<br />
34 Plumbing Pipe Cast Iron - lbs<br />
35 Plumbing Pipe Copper 7,276.00 lbs<br />
36 Plumbing Pipe Insulation lbs 16,000.00<br />
37 Structural Steel 17,560.00 lbs<br />
38 Decking 9,650.00 lbs<br />
39 Mezzanine Concrete 22,000.00 lbs
40 Concrete 2,904,040.00 lbs<br />
41 CMU Block 1,238,900.00 lbs<br />
42 Laminated Plywood lbs 10,820.00<br />
43 Gypsum Board lbs 66,445.00<br />
44 Wood Studs & Plywood 22,380.00 lbs<br />
45 Metal Studs 7,080.00 lbs<br />
46 Hollow Metal Materials 10,475.00 lbs<br />
47 OH Doors 5,570.00 lbs<br />
48 4,445,985.00 - 159,190.00<br />
Total amount of Diverted<br />
Materials<br />
2222.99 tons<br />
Total Amount of Nonrecoverable<br />
Materials<br />
79.60 tons<br />
Estimated Additional Hours to<br />
Source-Separate<br />
Labor Rate for Material H<strong>and</strong>ler<br />
768 mnhrs<br />
10.80 $/mnhr<br />
Total material H<strong>and</strong>ling Costs $<br />
8,294.40<br />
Percentage diverted To Date 97%
A Total <strong>Waste</strong> 2,450.90 tons<br />
Appendix D<br />
Hensley Site Phase II Material Diversion Analysis<br />
B<br />
Determine Recoverable Materials<br />
PHASE II<br />
1 Sheetrock 3,420.00 lbs<br />
2 Metal Studs & Track lbs<br />
3 Wood Framing & pallets 14,540.00 lbs<br />
4 Cardboard lbs<br />
5 Polyethylene lbs<br />
6 Short Steel 4,780.00 lbs<br />
7 Concrete - lbs<br />
9 Masonry lbs<br />
10 Roofing lbs -<br />
11 Iron Pipe 13,620.00 lbs<br />
12 Cardboard 1,520.00 lbs<br />
13 Tin 5,720.00 lbs -<br />
14 Misc. construction waste lbs 64,220.00<br />
15 Asphalt 188,500.00 lbs<br />
16 Misc. copper 308.00 lbs<br />
Total amount of Diverted<br />
Materials 116.20 tons<br />
Total Amount of Nonrecoverable<br />
Materials<br />
32.11 tons
Green Building Program Logos<br />
City of Austin, TX Green Building<br />
Program<br />
HBA of Central New Mexico<br />
BA of Metropolitan Denver<br />
City of Scottsdale, AZ Green Building<br />
Program<br />
City of Frisco, TX Green Building<br />
Program
C&D <strong>Waste</strong> <strong>Minimization</strong> Program Logos<br />
Artistic <strong>Waste</strong>, Central Recycling<br />
<strong>and</strong> Corell Recycling <strong>Construction</strong><br />
<strong>and</strong> <strong>Demolition</strong> Program<br />
RESÍDUO DE CONSTRUÇÃO E<br />
DEMOLIÇÃO<br />
City of Greenwood, South Carolina<br />
Building Department C&D Disposal
C&D <strong>Waste</strong> <strong>Minimization</strong> Reference Materials<br />
South Carolina's C&D<br />
Debris Guidebook<br />
The Austin Chronicle's Green<br />
Building issue of April 27,<br />
1994<br />
NAHB Deconstruction<br />
Brochure