Annual report 2010 - Hapimag
Annual report 2010 - Hapimag
Annual report 2010 - Hapimag

You also want an ePaper? Increase the reach of your titles
YUMPU automatically turns print PDFs into web optimized ePapers that Google loves.
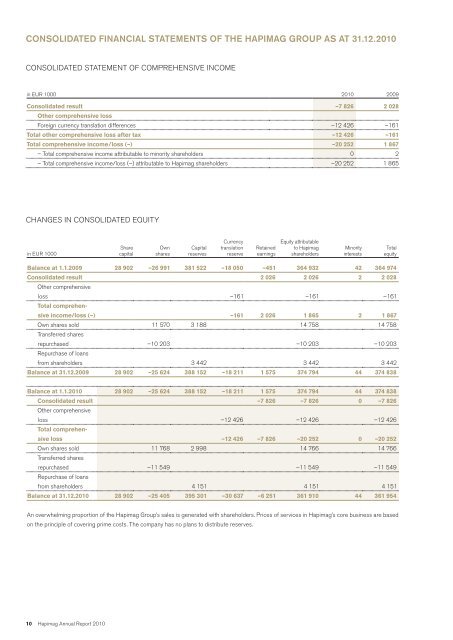
CONSOLIDATED FINANCIAL STATEMENTS OF THE HAPIMAG GrouP AS AT 31.12.<strong>2010</strong><br />
Consolidated Statement of comprehensive income<br />
in euR 1000 <strong>2010</strong> 2009<br />
Consolidated result –7 826 2 028<br />
Other comprehensive loss<br />
foreign currency translation differences –12 426 –161<br />
Total other comprehensive loss after tax –12 426 –161<br />
Total comprehensive income/loss (–) –20 252 1 867<br />
– Total comprehensive income attributable to minority shareholders 0 2<br />
– Total comprehensive income/loss (–) attributable to <strong>Hapimag</strong> shareholders –20 252 1 865<br />
CHANGES in consoliDateD EQuitY<br />
in euR 1000<br />
Share<br />
capital<br />
Own<br />
shares<br />
Capital<br />
reserves<br />
Currency<br />
translation<br />
reserve<br />
Retained<br />
earnings<br />
Equity attributable<br />
to Hhapimag<br />
shareholders<br />
Minority<br />
interests<br />
Total<br />
equity<br />
Balance at 1.1.2009 28 902 –26 991 381 522 –18 050 –451 364 932 42 364 974<br />
Consolidated result 2 026 2 026 2 2 028<br />
other comprehensive<br />
loss –161 –161 –161<br />
Total comprehensive<br />
income/loss (–) –161 2 026 1 865 2 1 867<br />
own shares sold 11 570 3 188 14 758 14 758<br />
transferred shares<br />
repurchased –10 203 –10 203 –10 203<br />
Repurchase of loans<br />
from shareholders 3 442 3 442 3 442<br />
Balance at 31.12.2009 28 902 –25 624 388 152 –18 211 1 575 374 794 44 374 838<br />
Balance at 1.1.<strong>2010</strong> 28 902 –25 624 388 152 –18 211 1 575 374 794 44 374 838<br />
Consolidated result –7 826 –7 826 0 –7 826<br />
other comprehensive<br />
loss –12 426 –12 426 –12 426<br />
Total comprehensive<br />
loss –12 426 –7 826 –20 252 0 –20 252<br />
own shares sold 11 768 2 998 14 766 14 766<br />
transferred shares<br />
repurchased –11 549 –11 549 –11 549<br />
Repurchase of loans<br />
from shareholders 4 151 4 151 4 151<br />
Balance at 31.12.<strong>2010</strong> 28 902 –25 405 395 301 –30 637 –6 251 361 910 44 361 954<br />
An overwhelming proportion of the <strong>Hapimag</strong> Group’s sales is generated with shareholders. Prices of services in <strong>Hapimag</strong>’s core business are based<br />
on the principle of covering prime costs. The company has no plans to distribute reserves.<br />
10 <strong>Hapimag</strong> <strong>Annual</strong> Report <strong>2010</strong>