Cylinder Pressure in a Spark-Ignition Engine - Harvard Computer ...
Cylinder Pressure in a Spark-Ignition Engine - Harvard Computer ...
Cylinder Pressure in a Spark-Ignition Engine - Harvard Computer ...

Create successful ePaper yourself
Turn your PDF publications into a flip-book with our unique Google optimized e-Paper software.
J. Undergrad. Sci. 3: 141-145 (Fall 1996)<br />
Eng<strong>in</strong>eer<strong>in</strong>g Sciences<br />
<strong>Cyl<strong>in</strong>der</strong> <strong>Pressure</strong> <strong>in</strong> a <strong>Spark</strong>-<strong>Ignition</strong> Eng<strong>in</strong>e: A<br />
Computational Model<br />
PAULINA S. KUO<br />
The project described <strong>in</strong> this article attempts to accurately<br />
predict the gas pressure changes with<strong>in</strong> the cyl<strong>in</strong>der<br />
of a spark-ignition eng<strong>in</strong>e us<strong>in</strong>g thermodynamic<br />
pr<strong>in</strong>ciples. The model takes <strong>in</strong>to account the <strong>in</strong>take, compression,<br />
combustion, expansion and exhaust processes<br />
that occur <strong>in</strong> the cyl<strong>in</strong>der. Comparisons with<br />
actual pressure data show the model to have a high<br />
degree of accuracy. The model is further evaluated on<br />
its ability to predict the angle of spark fir<strong>in</strong>g and burn<br />
duration.<br />
Introduction<br />
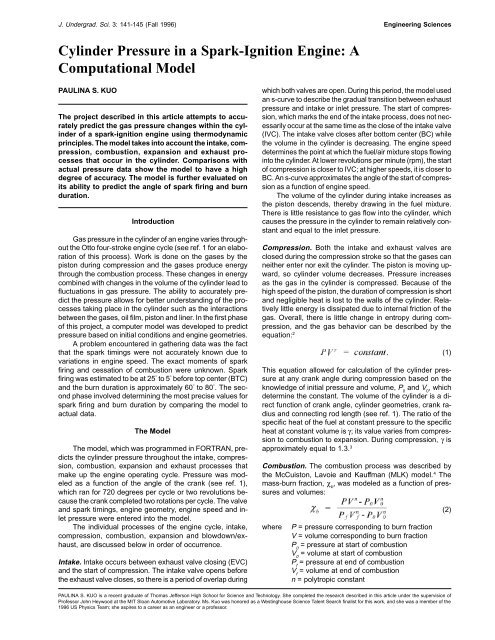
Gas pressure <strong>in</strong> the cyl<strong>in</strong>der of an eng<strong>in</strong>e varies throughout<br />
the Otto four-stroke eng<strong>in</strong>e cycle (see ref. 1 for an elaboration<br />
of this process). Work is done on the gases by the<br />
piston dur<strong>in</strong>g compression and the gases produce energy<br />
through the combustion process. These changes <strong>in</strong> energy<br />
comb<strong>in</strong>ed with changes <strong>in</strong> the volume of the cyl<strong>in</strong>der lead to<br />
fluctuations <strong>in</strong> gas pressure. The ability to accurately predict<br />
the pressure allows for better understand<strong>in</strong>g of the processes<br />
tak<strong>in</strong>g place <strong>in</strong> the cyl<strong>in</strong>der such as the <strong>in</strong>teractions<br />
between the gases, oil film, piston and l<strong>in</strong>er. In the first phase<br />
of this project, a computer model was developed to predict<br />
pressure based on <strong>in</strong>itial conditions and eng<strong>in</strong>e geometries.<br />
A problem encountered <strong>in</strong> gather<strong>in</strong>g data was the fact<br />
that the spark tim<strong>in</strong>gs were not accurately known due to<br />
variations <strong>in</strong> eng<strong>in</strong>e speed. The exact moments of spark<br />
fir<strong>in</strong>g and cessation of combustion were unknown. <strong>Spark</strong><br />
fir<strong>in</strong>g was estimated to be at 25 ° to 5 ° before top center (BTC)<br />
and the burn duration is approximately 60 ° to 80 ° . The second<br />
phase <strong>in</strong>volved determ<strong>in</strong><strong>in</strong>g the most precise values for<br />
spark fir<strong>in</strong>g and burn duration by compar<strong>in</strong>g the model to<br />
actual data.<br />
The Model<br />
The model, which was programmed <strong>in</strong> FORTRAN, predicts<br />
the cyl<strong>in</strong>der pressure throughout the <strong>in</strong>take, compression,<br />
combustion, expansion and exhaust processes that<br />
make up the eng<strong>in</strong>e operat<strong>in</strong>g cycle. <strong>Pressure</strong> was modeled<br />
as a function of the angle of the crank (see ref. 1),<br />
which ran for 720 degrees per cycle or two revolutions because<br />
the crank completed two rotations per cycle. The valve<br />
and spark tim<strong>in</strong>gs, eng<strong>in</strong>e geometry, eng<strong>in</strong>e speed and <strong>in</strong>let<br />
pressure were entered <strong>in</strong>to the model.<br />
The <strong>in</strong>dividual processes of the eng<strong>in</strong>e cycle, <strong>in</strong>take,<br />
compression, combustion, expansion and blowdown/exhaust,<br />
are discussed below <strong>in</strong> order of occurrence.<br />
Intake. Intake occurs between exhaust valve clos<strong>in</strong>g (EVC)<br />
and the start of compression. The <strong>in</strong>take valve opens before<br />
the exhaust valve closes, so there is a period of overlap dur<strong>in</strong>g<br />
which both valves are open. Dur<strong>in</strong>g this period, the model used<br />
an s-curve to describe the gradual transition between exhaust<br />
pressure and <strong>in</strong>take or <strong>in</strong>let pressure. The start of compression,<br />
which marks the end of the <strong>in</strong>take process, does not necessarily<br />
occur at the same time as the close of the <strong>in</strong>take valve<br />
(IVC). The <strong>in</strong>take valve closes after bottom center (BC) while<br />
the volume <strong>in</strong> the cyl<strong>in</strong>der is decreas<strong>in</strong>g. The eng<strong>in</strong>e speed<br />
determ<strong>in</strong>es the po<strong>in</strong>t at which the fuel/air mixture stops flow<strong>in</strong>g<br />
<strong>in</strong>to the cyl<strong>in</strong>der. At lower revolutions per m<strong>in</strong>ute (rpm), the start<br />
of compression is closer to IVC; at higher speeds, it is closer to<br />
BC. An s-curve approximates the angle of the start of compression<br />
as a function of eng<strong>in</strong>e speed.<br />
The volume of the cyl<strong>in</strong>der dur<strong>in</strong>g <strong>in</strong>take <strong>in</strong>creases as<br />
the piston descends, thereby draw<strong>in</strong>g <strong>in</strong> the fuel mixture.<br />
There is little resistance to gas flow <strong>in</strong>to the cyl<strong>in</strong>der, which<br />
causes the pressure <strong>in</strong> the cyl<strong>in</strong>der to rema<strong>in</strong> relatively constant<br />
and equal to the <strong>in</strong>let pressure.<br />
Compression. Both the <strong>in</strong>take and exhaust valves are<br />
closed dur<strong>in</strong>g the compression stroke so that the gases can<br />
neither enter nor exit the cyl<strong>in</strong>der. The piston is mov<strong>in</strong>g upward,<br />
so cyl<strong>in</strong>der volume decreases. <strong>Pressure</strong> <strong>in</strong>creases<br />
as the gas <strong>in</strong> the cyl<strong>in</strong>der is compressed. Because of the<br />
high speed of the piston, the duration of compression is short<br />
and negligible heat is lost to the walls of the cyl<strong>in</strong>der. Relatively<br />
little energy is dissipated due to <strong>in</strong>ternal friction of the<br />
gas. Overall, there is little change <strong>in</strong> entropy dur<strong>in</strong>g compression,<br />
and the gas behavior can be described by the<br />
equation: 2 (1)<br />
This equation allowed for calculation of the cyl<strong>in</strong>der pressure<br />
at any crank angle dur<strong>in</strong>g compression based on the<br />
knowledge of <strong>in</strong>itial pressure and volume, P 0<br />
and V 0<br />
, which<br />
determ<strong>in</strong>e the constant. The volume of the cyl<strong>in</strong>der is a direct<br />
function of crank angle, cyl<strong>in</strong>der geometries, crank radius<br />
and connect<strong>in</strong>g rod length (see ref. 1). The ratio of the<br />
specific heat of the fuel at constant pressure to the specific<br />
heat at constant volume is γ; its value varies from compression<br />
to combustion to expansion. Dur<strong>in</strong>g compression, γ is<br />
approximately equal to 1.3. 3<br />
Combustion. The combustion process was described by<br />
the McCuiston, Lavoie and Kauffman (MLK) model. 4 The<br />
mass-burn fraction, χ b<br />
, was modeled as a function of pressures<br />
and volumes:<br />
where<br />
P = pressure correspond<strong>in</strong>g to burn fraction<br />
V = volume correspond<strong>in</strong>g to burn fraction<br />
P 0<br />
= pressure at start of combustion<br />
V 0<br />
= volume at start of combustion<br />
P f<br />
= pressure at end of combustion<br />
V f<br />
= volume at end of combustion<br />
n = polytropic constant<br />
(2)<br />
PAULINA S. KUO is a recent graduate of Thomas Jefferson High School for Science and Technology. She completed the research described <strong>in</strong> this article under the supervision of<br />
Professor John Heywood at the MIT Sloan Automotive Laboratory. Ms. Kuo was honored as a West<strong>in</strong>ghouse Science Talent Search f<strong>in</strong>alist for this work, and she was a member of the<br />
1996 US Physics Team; she aspires to a career as an eng<strong>in</strong>eer or a professor.
142 Journal of Undergraduate Sciences<br />
Eng<strong>in</strong>eer<strong>in</strong>g Sci.<br />
The polytropic constant, n, is an empirically determ<strong>in</strong>ed constant<br />
about equal to γ which has a value close to 1.25 dur<strong>in</strong>g<br />
combustion. 3<br />
The fraction of fuel burned varies with an s-curve which<br />
runs from 0% burned at the start of combustion to 100%<br />
burned at the end of combustion. The Weibe function is an<br />
s-curve that is used to describe the burn fraction: 1 (3)<br />
θ 0<br />
is the angle at which combustion beg<strong>in</strong>s; it is about equal<br />
to the angle of spark fir<strong>in</strong>g. The angle of the duration of combustion<br />
is ∆θ. The constants a and m are determ<strong>in</strong>ed experimentally.<br />
Real burn fraction curves have been fitted by<br />
the Weibe function with a=5 and m=2.<br />
The terms <strong>in</strong> equation (2) can be rearranged to give an<br />
expression for pressure <strong>in</strong> terms of the crank angle and the<br />
conditions at the onset and end of combustion. The f<strong>in</strong>al<br />
conditions can be represented as functions of the <strong>in</strong>itial conditions<br />
by us<strong>in</strong>g the fact that the gases <strong>in</strong> the cyl<strong>in</strong>der act<br />
almost ideal and that negligible energy is lost or ga<strong>in</strong>ed by<br />
the system. S<strong>in</strong>ce the combustion process occurs almost<br />
symmetrically about top center (TC), the volume of the cyl<strong>in</strong>der<br />
at the spark is approximately equal to the volume at<br />
the end of combustion. Because the <strong>in</strong>itial and f<strong>in</strong>al volumes<br />
are about equal, little net work is done on the piston and the<br />
change <strong>in</strong> temperature between the spark and end of combustion<br />
is due to the burn<strong>in</strong>g of the fuel.<br />
Accord<strong>in</strong>g to the ideal gas law, the gas pressure at the<br />
end of combustion, P f<br />
, is a function of the gas constant of<br />
the fuel, mass of the gases, temperature, and volume. The<br />
gas constant of the fuel is equal to the universal gas constant<br />
divided by the molar mass of the fuel. The total mass<br />
of the gas mixture was calculated at IVC, just when the cyl<strong>in</strong>der<br />
is sealed, by us<strong>in</strong>g the ideal gas law. Temperature at<br />
the end of combustion was estimated us<strong>in</strong>g the assumption<br />
that nearly all of the chemical energy of the fuel caused a<br />
temperature change of the gases. This idea is expressed <strong>in</strong><br />
the follow<strong>in</strong>g equation: 5 (4)<br />
gases drives the piston down, does work by turn<strong>in</strong>g the crankshaft<br />
and, <strong>in</strong> turn, provides power to the car. Dur<strong>in</strong>g expansion,<br />
the heat transferred to the cyl<strong>in</strong>der l<strong>in</strong>er is small compared<br />
to the work done. Energy lost to <strong>in</strong>ternal friction of the<br />
gas is also m<strong>in</strong>imal. The gas behavior was described by<br />
equation (1) which is also used to model the compression<br />
process. The conditions at the end of combustion determ<strong>in</strong>ed<br />
the constant term. Dur<strong>in</strong>g expansion, γ has a value of about<br />
1.48. 3<br />
Blowdown and Exhaust. Exhaust valve open<strong>in</strong>g (EVO) occurs<br />
before the crank reaches BC. At this po<strong>in</strong>t, the pressure<br />
<strong>in</strong> the cyl<strong>in</strong>der is much greater than the exhaust system<br />
pressure. The higher pressure <strong>in</strong> the cyl<strong>in</strong>der helps push<br />
the burnt gases out of the cyl<strong>in</strong>der. The process by which<br />
the pressure aids <strong>in</strong> the expulsion of burnt gases is called<br />
blowdown. The flow of the gases can be described by a<br />
model of gas flow through an orifice where the valve acts<br />
like the flow restriction. 1 This model depends on the velocity<br />
of the gas. When the gas velocity at the smallest portion of<br />
the open<strong>in</strong>g, the throat, is equal to the speed of sound, the<br />
flow is said to be choked. The flow rate under choked flow is<br />
described by:<br />
where<br />
(5)<br />
.<br />
m real<br />
= real mass flow rate<br />
C D<br />
= discharge coefficient<br />
A T<br />
= cross-sectional area of throat<br />
p T<br />
= pressure at throat<br />
p 0<br />
= pressure <strong>in</strong> the cyl<strong>in</strong>der<br />
T 0<br />
= temperature <strong>in</strong> the cyl<strong>in</strong>der<br />
R = characteristic gas constant of the exit<strong>in</strong>g gases<br />
γ = ratio of specific heats of the exit<strong>in</strong>g gases<br />
Subsonic flow is described by the equation:<br />
(6)<br />
where<br />
m total<br />
= total mass of gases <strong>in</strong> the cyl<strong>in</strong>der<br />
c v<br />
= specific heat of gas mixture at constant vol.<br />
T f<br />
= temperature at the end of combustion<br />
T spark<br />
= temperature at the start of combustion<br />
C = coefficient for unburned fuel<br />
m fuel<br />
= mass of fuel <strong>in</strong> the cyl<strong>in</strong>der<br />
Q HV<br />
= heat<strong>in</strong>g value of the fuel<br />
The temperature at the spark was calculated by apply<strong>in</strong>g<br />
the ideal gas law to the conditions at the end of compression.<br />
The constant C took <strong>in</strong>to account the fact that not all of<br />
the fuel was burned and thus not all of the chemical energy<br />
available was changed <strong>in</strong>to thermal energy; C is approximately<br />
0.95. The mass of the fuel was calculated by us<strong>in</strong>g<br />
the air-to-fuel ratio and not<strong>in</strong>g that the total mass is equal to<br />
the mass of air plus the mass of fuel. The heat<strong>in</strong>g value is a<br />
constant dependent upon the type of fuel used. For gasol<strong>in</strong>e,<br />
the heat<strong>in</strong>g value is about 44 megajoules per kilogram.<br />
Expansion. The end of combustion occurs slightly after TC<br />
at which po<strong>in</strong>t expansion beg<strong>in</strong>s. The pressure of the burned<br />
The discharge coefficient is an experimentally determ<strong>in</strong>ed constant<br />
which relates the effective throat area to the actual throat<br />
area. It is roughly equal to 0.7. Secondary flow near the throat<br />
cause the ma<strong>in</strong> flow to pass through a smaller area than the<br />
actual cross-sectional area of the throat. The pressure at<br />
.<br />
the<br />
throat is equal to that of the gases <strong>in</strong> the exhaust system. m, p 0<br />
and T 0<br />
are variable but can be related by the ideal gas law:<br />
and the isentropic process gas model: 2 (8)<br />
These models are valid because there is negligible entropy<br />
change <strong>in</strong> the system and the gases <strong>in</strong> the cyl<strong>in</strong>der do not<br />
deviate far from ideal behavior.<br />
The resultant equation<br />
.<br />
is a differential equation where<br />
the mass flow rate, m, is dependent on the mass of the gases<br />
<strong>in</strong> the cyl<strong>in</strong>der, m. The value of m is computed numerically<br />
by us<strong>in</strong>g the three-step Runge-Kutta algorithm and then used<br />
to f<strong>in</strong>d the gas pressure.<br />
(7)
143 Journal of Undergraduate Sciences<br />
Eng<strong>in</strong>eer<strong>in</strong>g Sci.<br />
The flow of the gases depends on the area of the open<strong>in</strong>g<br />
of the exhaust valve. This area changes as the valve is<br />
pushed open and closed. It <strong>in</strong>creases quickly to a maximum,<br />
reaches a plateau and falls off aga<strong>in</strong> as the valve closes.<br />
The maximum area is determ<strong>in</strong>ed ma<strong>in</strong>ly by the shape of<br />
the duct to the exhaust system. <strong>Pressure</strong> <strong>in</strong> the cyl<strong>in</strong>der<br />
settles down to the exhaust system pressure as the exhaust<br />
valve rema<strong>in</strong>s open. The valve closes after TC after the next<br />
eng<strong>in</strong>e cycle has begun.<br />
The exhaust system pressure is a function of eng<strong>in</strong>e<br />
speed. There are several barriers to the exit<strong>in</strong>g gas <strong>in</strong> the<br />
exhaust system, such as the catalytic converter and the<br />
muffler, which resist the flow of the burnt gases and cause<br />
the pressure <strong>in</strong> the exhaust system to <strong>in</strong>crease roughly as<br />
the square of the speed of the exit<strong>in</strong>g gases. The speed of<br />
the gases is directly proportional to the eng<strong>in</strong>e speed. Generally,<br />
the exhaust pressure is between 1 atmosphere (atm)<br />
and 1.5 atm.<br />
Table 1. Model <strong>in</strong>puts. BTC stands for “before top center.”<br />
Table 2. Analysis of 2000 rpm HL. ATC stands for “after top center.”<br />
Model Evaluation<br />
Data was collected from a Renault production eng<strong>in</strong>e<br />
at different eng<strong>in</strong>e speeds and <strong>in</strong>let pressures. The geometries<br />
of the eng<strong>in</strong>e were entered <strong>in</strong>to the model and the<br />
model was then used to predict the pressure <strong>in</strong> the cyl<strong>in</strong>der.<br />
Specifications of the test eng<strong>in</strong>e are located <strong>in</strong> Appendix A.<br />
The angle of spark fir<strong>in</strong>g and burn duration angle were not<br />
explicitly known. Reasonable estimates for the tim<strong>in</strong>g were<br />
made from prior experiences and by visual approximation.<br />
The model was fairly accurate <strong>in</strong> its cyl<strong>in</strong>der pressure<br />
predictions. It was tested with eng<strong>in</strong>e pressure data at 2000<br />
rpm full load (FL), 2000 rpm half load (HL), 4000 rpm FL,<br />
and 4000 rpm HL. The first figure <strong>in</strong> Appendix B plots the<br />
actual and model data at 4000 rpm FL. Of the four trials, the<br />
model deviated the most at 4000 rpm FL. The differences of<br />
all four trials between the model data and the actual data<br />
are shown <strong>in</strong> the second figure of Appendix B. Differences<br />
were greatest at higher rpm and greater load.<br />
Under full load, the <strong>in</strong>let pressure was about 1 atm and<br />
0.5 atm at half load. The spark tim<strong>in</strong>g was changed from<br />
model to model. Generally, an <strong>in</strong>crease <strong>in</strong> eng<strong>in</strong>e speed was<br />
accompanied by earlier spark fir<strong>in</strong>g and longer combustion<br />
duration. An <strong>in</strong>crease <strong>in</strong> <strong>in</strong>let pressure meant that the spark<br />
fired later, and the burn duration was shorter. The exact values<br />
of the <strong>in</strong>let pressure <strong>in</strong> kilopascals (kPa) and the spark<br />
tim<strong>in</strong>g used <strong>in</strong> each model are given <strong>in</strong> Table 1.<br />
The model results were compared to actual eng<strong>in</strong>e data.<br />
Differences <strong>in</strong> P spark<br />
, θ peak pressure<br />
, P peak<br />
and P EVO<br />
were recorded<br />
and analyzed. The accuracy of P spark<br />
is a measure of the<br />
performance of the compression model. Discrepancies <strong>in</strong><br />
θ peak pressure<br />
and P peak<br />
gauge the model of combustion while<br />
P EVO<br />
shows how well the expansion model described the<br />
expansion process. Tables 2 through 5 show the performance<br />
of the model under different eng<strong>in</strong>e conditions.<br />
The compression model produced pressure values<br />
slightly greater than the actual values. The percent error of<br />
P spark<br />
was around 10%. In an actual eng<strong>in</strong>e, some energy is<br />
lost dur<strong>in</strong>g the compression process. Because the energy<br />
loss was not taken <strong>in</strong>to account <strong>in</strong> the model, the pressure<br />
predictions at the spark fir<strong>in</strong>g angle were larger than the<br />
actual pressure values.<br />
In some trials, the predicted angle of peak pressure <strong>in</strong><br />
the model was less than the actual angle. Because the encoder<br />
on the eng<strong>in</strong>e that records the crank angle is sometimes<br />
faulty at high eng<strong>in</strong>e speed, the actual pressure data<br />
Table 3. Analysis of 2000 rpm FL. ATC stands for “after top center.”<br />
Table 4. Analysis of 4000 rpm HL. ATC stands for “after top center.”<br />
Table 5. Analysis of 4000 rpm FL. ATC stands for “after top center.”<br />
may be slightly <strong>in</strong>accurate. The peak pressure was usually<br />
accurate but was at times lower than the actual value. These<br />
variations were, <strong>in</strong> part, due to the uncerta<strong>in</strong>ties <strong>in</strong> the angle<br />
spark fir<strong>in</strong>g and burn duration.<br />
The cyl<strong>in</strong>der pressure at EVO was the most variable.<br />
The model <strong>in</strong>corporated a representation for blowdown,<br />
which caused a visible drop off at EVO <strong>in</strong> the plots of the<br />
model, but the actual data did not show such a large decrease.<br />
The differences were more pronounced <strong>in</strong> the trials<br />
at higher eng<strong>in</strong>e speeds. These discrepancies <strong>in</strong> pressure<br />
dur<strong>in</strong>g combustion and expansion were partially due to the<br />
mechanics of the pressure transducer. The transducer does<br />
not work well at high temperatures or at quickly chang<strong>in</strong>g<br />
temperatures. Because of the rapidly chang<strong>in</strong>g conditions<br />
<strong>in</strong> the cyl<strong>in</strong>der, it may not have recorded all the changes <strong>in</strong><br />
pressure dur<strong>in</strong>g blowdown.<br />
Another reason for the differences is the <strong>in</strong>accuracy of<br />
the function that describes the area of the valve open<strong>in</strong>g.
144 Journal of Undergraduate Sciences<br />
Eng<strong>in</strong>eer<strong>in</strong>g Sci.<br />
Table 6. Load <strong>in</strong>let pressures.<br />
Table 7. Optimal spark tim<strong>in</strong>gs. BTC stands for “before top center.”<br />
Without actually measur<strong>in</strong>g the area of the valve open<strong>in</strong>g <strong>in</strong><br />
the test eng<strong>in</strong>e, it is impossible to predict the changes <strong>in</strong> the<br />
size of the open<strong>in</strong>g. Valves can be opened by more than<br />
one mechanism. The valves are opened at different rates,<br />
depend<strong>in</strong>g on the mechanism. Hence, the time it takes for<br />
the area to reach the maximum varies from eng<strong>in</strong>e to eng<strong>in</strong>e.<br />
The curve that predicted the area of the valve open<strong>in</strong>g<br />
may have been <strong>in</strong>correct for the test eng<strong>in</strong>e.<br />
On the whole, the model predicted the pressure <strong>in</strong> the<br />
cyl<strong>in</strong>der fairly accurately. The shape of the curve was well<br />
matched with the actual data. <strong>Pressure</strong> rose through compression,<br />
peaked dur<strong>in</strong>g combustion and fell dur<strong>in</strong>g expansion<br />
and blowdown. The standard deviation of the model<br />
was 1.33 for 2000 HL, 2.40 for 2000 FL, 3.13 for 4000 HL<br />
and 8.61 for 4000 FL. Consider<strong>in</strong>g that the pressure varies<br />
from 50 kPa to 5000 kPa, the model was very accurate.<br />
<strong>Spark</strong> and Burn Duration Determ<strong>in</strong>ation<br />
The exact angle of spark fir<strong>in</strong>g and duration of combustion<br />
were not known. The eng<strong>in</strong>e cycles are completed extremely<br />
quickly and the spark tim<strong>in</strong>g varies slightly each cycle<br />
which made it difficult to accurately measure the spark tim<strong>in</strong>g.<br />
By vary<strong>in</strong>g spark fir<strong>in</strong>g and burn duration <strong>in</strong>puts of the<br />
model, the best fit curve was obta<strong>in</strong>ed that gave a prediction<br />
of the spark tim<strong>in</strong>g.<br />
Data Fitt<strong>in</strong>g. The error of the model is calculated by an sum<br />
of the differences between the real and model pressure<br />
values:<br />
Data was sampled at <strong>in</strong>tegral crank angles. The error was<br />
m<strong>in</strong>imized to f<strong>in</strong>d optimal values for the angle of spark fir<strong>in</strong>g<br />
and burn duration. <strong>Pressure</strong> data came from a Renault production<br />
eng<strong>in</strong>e (see Appendix A for specifications). The pressure<br />
measurements were taken at 2000 rpm under quarter<br />
load, half load, three-quarters load and full load. The <strong>in</strong>let<br />
pressures correspond<strong>in</strong>g to the loads are given <strong>in</strong> Table 6.<br />
The optimal angle of spark fir<strong>in</strong>g, θ spark<br />
, and burn duration,<br />
∆θ, for the sets of pressure data are given <strong>in</strong> Table 7.<br />
The error, approximate area of the actual pressure curve<br />
and the error as a percentage of the area are also given <strong>in</strong><br />
the table.<br />
The percent error of the model was approximately 0.5%<br />
for all the trials. Error <strong>in</strong>creases with higher <strong>in</strong>let pressures<br />
because of the greater pressures <strong>in</strong> the data.<br />
<strong>Spark</strong> and Burn Duration Evaluation. The results of the<br />
spark fir<strong>in</strong>g and burn duration determ<strong>in</strong>ation are shown <strong>in</strong><br />
Table 7. Generally, the burn duration angle <strong>in</strong>creases with<br />
load and, with the exception of the quarter load data, the<br />
angle spark fir<strong>in</strong>g becomes later with <strong>in</strong>creas<strong>in</strong>g load. The<br />
(9)<br />
delay <strong>in</strong> spark fir<strong>in</strong>g as the <strong>in</strong>let pressure <strong>in</strong>creases is<br />
expected, however, the <strong>in</strong>crease <strong>in</strong> burn duration goes<br />
aga<strong>in</strong>st the predicted trend.<br />
In the model, an <strong>in</strong>crease <strong>in</strong> <strong>in</strong>let pressure is reflected<br />
as a larger pressure at the spark and a greater mass of fuel<br />
<strong>in</strong> the cyl<strong>in</strong>der. With more fuel to burn, the model lengthens<br />
the burn time. Burn duration is decreased only slightly by<br />
the <strong>in</strong>crease <strong>in</strong> pressure at the spark.<br />
In actuality, an <strong>in</strong>crease <strong>in</strong> the <strong>in</strong>itial pressure dur<strong>in</strong>g<br />
combustion can greatly alter the way the fuel burns. Higher<br />
pressure <strong>in</strong> a limited volume means that the temperature <strong>in</strong><br />
the cyl<strong>in</strong>der is higher and that the fuel and air molecules are<br />
more reactive. The mixture burns faster, so the burn duration<br />
becomes shorter. The delayed spark fir<strong>in</strong>g takes advantage<br />
of the more reactive nature of the fuel to get more<br />
power out of the stroke.<br />
The model does not take <strong>in</strong>to account the <strong>in</strong>creased<br />
temperature at the spark. The reactivity of the fuel is not a<br />
factor <strong>in</strong> the MLK combustion relation that is used by the<br />
model. Under higher <strong>in</strong>let pressure, the gases <strong>in</strong> the cyl<strong>in</strong>der<br />
are hotter throughout combustion and the combustion,<br />
which is an oxidation reaction, occurs faster. This <strong>in</strong>crease<br />
<strong>in</strong> reaction rate is due to the <strong>in</strong>creased k<strong>in</strong>etic energy so it<br />
takes a smaller amount of additional energy to reach the<br />
activation energy for the reaction. 6<br />
The MLK and similar burn fraction models were orig<strong>in</strong>ally<br />
formulated from burn profile pictures. These relations<br />
were empirically determ<strong>in</strong>ed by observ<strong>in</strong>g the photographs,<br />
which means that the models were not based on pr<strong>in</strong>ciples<br />
of thermodynamics. This fact caused the error <strong>in</strong> the model.<br />
An improvement would be to f<strong>in</strong>d a combustion model based<br />
on the work-energy theorem where pressure and temperature<br />
are related to the total energy of the system.<br />
Summary<br />
This model predicts the pressure of the gas <strong>in</strong> a cyl<strong>in</strong>der<br />
by <strong>in</strong>corporat<strong>in</strong>g the isentropic gas process model, the<br />
McCuiston, Lavoie and Kauffman model and the gas flow<br />
through an orifice model. It predicts the pressure <strong>in</strong> the cyl<strong>in</strong>der<br />
fairly accurately. The most significant weakness of the<br />
model is that is does not take the changes <strong>in</strong> fuel reactivity<br />
dur<strong>in</strong>g combustion <strong>in</strong>to account. However, the model is<br />
simple and can be used to give quick estimates of pressure<br />
for other models, such as oil film thickness.<br />
Acknowledgments<br />
This project would not have been possible without the<br />
help and advice of Professor John Heywood and Tian Tian<br />
at the Sloan Automotive Laboratory at MIT. Thanks also go<br />
to Bouke Noordzij and Peter H<strong>in</strong>ze for supply<strong>in</strong>g eng<strong>in</strong>e data.<br />
The author is grateful to Mr. Don Hyatt for provid<strong>in</strong>g the use<br />
of the Thomas Jefferson High School <strong>Computer</strong> Systems<br />
lab. Lastly, the author thanks Dr. John Dell for his support<br />
and help through all the difficulties.
145 Journal of Undergraduate Sciences<br />
Eng<strong>in</strong>eer<strong>in</strong>g Sci.<br />
References<br />
(1) Heywood, J. B. 1988. Internal Combustion Fundamentals (New<br />
York: McGraw-Hill, Inc.).<br />
(2) Gyftopoulos, E. P., and G. P. Beretta. 1991. Thermodynamics:<br />
Foundations and Applications (New York: Macmillan Publish<strong>in</strong>g<br />
Company).<br />
(3) Cheung, H. M., and J. B. Heywood. 1993. “Evaluation of a One-<br />
Zone Burn-Rate Analysis Procedure Us<strong>in</strong>g Production SI Eng<strong>in</strong>e<br />
<strong>Pressure</strong> Data.” SAE paper 932749.<br />
(4) Amann, C. 1985. “<strong>Cyl<strong>in</strong>der</strong>-<strong>Pressure</strong> Measurement and Its Use<br />
<strong>in</strong> Eng<strong>in</strong>e Research.” SAE paper 852067.<br />
(5) This equation was suggested by Professor John Heywood.<br />
(6) Rossotti, H. 1993. Fire (New York: Oxford University Press).<br />
Appendix A: Renault Eng<strong>in</strong>e Specifications<br />
Appendix B: Graphical Comparisons