Postgraduate Research Experience Survey 2008 Final report
Postgraduate Research Experience Survey 2008 Final report
Postgraduate Research Experience Survey 2008 Final report

You also want an ePaper? Increase the reach of your titles
YUMPU automatically turns print PDFs into web optimized ePapers that Google loves.
3. Overview of PRES <strong>2008</strong> results<br />
3.1 Introduction<br />
This chapter summarises the overall findings from PRES <strong>2008</strong> at the aggregate (sector)<br />
level. Individual sections deal with headline findings (Section 3.2), overall experience of<br />
the programme (Section 3.3), confidence about completing on schedule (Section 3.4) and<br />
mean scale scores (Section 3.5)<br />
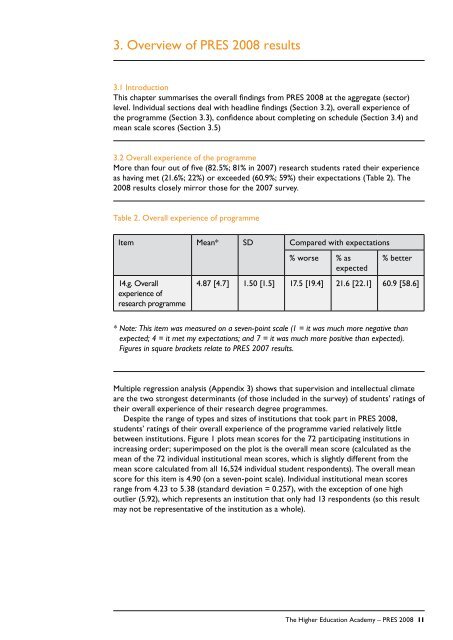
3.2 Overall experience of the programme<br />
More than four out of five (82.5%; 81% in 2007) research students rated their experience<br />
as having met (21.6%; 22%) or exceeded (60.9%; 59%) their expectations (Table 2). The<br />
<strong>2008</strong> results closely mirror those for the 2007 survey.<br />
Table 2. Overall experience of programme<br />
Item Mean* SD Compared with expectations<br />
% worse % as<br />
expected<br />
% better<br />
14.g. Overall<br />
experience of<br />
research programme<br />
4.87 [4.7] 1.50 [1.5] 17.5 [19.4] 21.6 [22.1] 60.9 [58.6]<br />
* Note: This item was measured on a seven-point scale (1 = it was much more negative than<br />
expected; 4 = it met my expectations; and 7 = it was much more positive than expected).<br />
Figures in square brackets relate to PRES 2007 results.<br />
Multiple regression analysis (Appendix 3) shows that supervision and intellectual climate<br />
are the two strongest determinants (of those included in the survey) of students’ ratings of<br />
their overall experience of their research degree programmes.<br />
Despite the range of types and sizes of institutions that took part in PRES <strong>2008</strong>,<br />
students’ ratings of their overall experience of the programme varied relatively little<br />
between institutions. Figure 1 plots mean scores for the 72 participating institutions in<br />
increasing order; superimposed on the plot is the overall mean score (calculated as the<br />
mean of the 72 individual institutional mean scores, which is slightly different from the<br />
mean score calculated from all 16,524 individual student respondents). The overall mean<br />
score for this item is 4.90 (on a seven-point scale). Individual institutional mean scores<br />
range from 4.23 to 5.38 (standard deviation = 0.257), with the exception of one high<br />
outlier (5.92), which represents an institution that only had 13 respondents (so this result<br />
may not be representative of the institution as a whole).<br />
The Higher Education Academy – PRES <strong>2008</strong> 11