FORM 12 TRACKING HEALTH OUTCOME MEASURES Annual ...
FORM 12 TRACKING HEALTH OUTCOME MEASURES Annual ...
FORM 12 TRACKING HEALTH OUTCOME MEASURES Annual ...
Create successful ePaper yourself
Turn your PDF publications into a flip-book with our unique Google optimized e-Paper software.
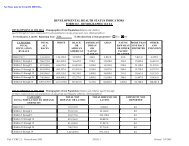
<strong>FORM</strong> <strong>12</strong><br />
<strong>TRACKING</strong> <strong>HEALTH</strong> <strong>OUTCOME</strong> <strong>MEASURES</strong><br />
[Secs. 505(a)(2)(B)(iii) and 506(a)(2)(A)(iii)]<br />
<strong>Annual</strong> Objective and Performance Data<br />
CY 1996 CY 1997 CY 1998 CY 1999 CY 2000<br />
<strong>OUTCOME</strong> MEASURE # 01<br />
The infant mortality rate per 1,000 live births (Outcome)<br />
<strong>Annual</strong> Outcome Objective 7.5 7.3 7.2 7.1<br />
<strong>Annual</strong> Outcome Indicator 7.7 7.6 7.3<br />
Numerator 1,145.0 1,090.0 1,063.0<br />
Denominator 147,890.0 143,967.0 145,606.0<br />
<strong>OUTCOME</strong> MEASURE # 02<br />
The ratio of the black infant mortality rate to the white infant mortality rate<br />
(Outcome)<br />
<strong>Annual</strong> Outcome Objective 2.5 2.4 2.5 2.4<br />
<strong>Annual</strong> Outcome Indicator 2.6 2.9 2.6<br />
Numerator 16.6 17.4 15.4<br />
Denominator 6.4 6.0 6.0<br />
<strong>OUTCOME</strong> MEASURE # 03<br />
The neonatal mortality rate per 1,000 live births (Outcome)<br />
<strong>Annual</strong> Outcome Objective 5.3 5.2 5.2 5.1<br />
<strong>Annual</strong> Outcome Indicator 5.4 5.3 5.3<br />
Numerator 796.0 758.0 772.0<br />
Denominator 147,890.0 143,967.0 145,606.0<br />
Title V ERP; Pennsylvania 2001 SD <strong>12</strong>.CORE (1996-2000).1 Printed: 4/26/2000
<strong>FORM</strong> <strong>12</strong><br />
<strong>TRACKING</strong> <strong>HEALTH</strong> <strong>OUTCOME</strong> <strong>MEASURES</strong><br />
[Secs. 505(a)(2)(B)(iii) and 506(a)(2)(A)(iii)]<br />
<strong>OUTCOME</strong> MEASURE # 04<br />
The postneonatal mortality rate per 1,000 live births (Outcome)<br />
<strong>Annual</strong> Objective and Performance Data<br />
CY 1996 CY 1997 CY 1998 CY 1999 CY 2000<br />
<strong>Annual</strong> Outcome Objective 2.4 2.3 2.0 1.9<br />
<strong>Annual</strong> Outcome Indicator 2.4 2.3 2.1<br />
Numerator 349.0 332.0 306.0<br />
Denominator 147,890.0 143,967.0 145,606.0<br />
<strong>OUTCOME</strong> MEASURE # 05<br />
The perinatal mortality rate per 1,000 live births (Outcome)<br />
<strong>Annual</strong> Outcome Objective 11.1 11.0 10.5 10.4<br />
<strong>Annual</strong> Outcome Indicator 11.2 10.8 10.6<br />
Numerator 1,664.0 1,571.0 1,543.0<br />
Denominator 148,908.0 145,538.0 145,606.0<br />
<strong>OUTCOME</strong> MEASURE # 06<br />
The child death rate per 100,000 children aged 1-14 (Outcome)<br />
<strong>Annual</strong> Outcome Objective 20.8 20.3 21.0 20.0<br />
<strong>Annual</strong> Outcome Indicator 21.3 22.3 22.1<br />
Numerator 474.0 526.0 485.0<br />
Denominator 2,228,767.0 2,357,225.0 2,192,611.0<br />
Title V ERP; Pennsylvania 2001 SD <strong>12</strong>.CORE (1996-2000).2 Printed: 4/26/2000
<strong>FORM</strong> <strong>12</strong><br />
<strong>TRACKING</strong> <strong>HEALTH</strong> <strong>OUTCOME</strong> <strong>MEASURES</strong><br />
[Secs. 505(a)(2)(B)(iii) and 506(a)(2)(A)(iii)]<br />
<strong>Annual</strong> Objective and Performance Data<br />
CY 2001 CY 2002 CY 2003 CY 2004 CY 2005<br />
<strong>OUTCOME</strong> MEASURE # 01<br />
The infant mortality rate per 1,000 live births (Outcome)<br />
<strong>Annual</strong> Outcome Objective 7.0 6.9 6.9 6.9 6.9<br />
<strong>Annual</strong> Outcome Indicator<br />
Numerator<br />
Denominator<br />
<strong>OUTCOME</strong> MEASURE # 02<br />
The ratio of the black infant mortality rate to the white infant mortality rate<br />
(Outcome)<br />
<strong>Annual</strong> Outcome Objective 2.3 2.2 2.2 2.2 2.2<br />
<strong>Annual</strong> Outcome Indicator<br />
Numerator<br />
Denominator<br />
<strong>OUTCOME</strong> MEASURE # 03<br />
The neonatal mortality rate per 1,000 live births (Outcome)<br />
<strong>Annual</strong> Outcome Objective 5.0 4.9 4.9 4.9 4.9<br />
<strong>Annual</strong> Outcome Indicator<br />
Numerator<br />
Denominator<br />
Title V ERP; Pennsylvania 2001 SD <strong>12</strong>.CORE (2001-2005).1 Printed: 4/26/2000
<strong>FORM</strong> <strong>12</strong><br />
<strong>TRACKING</strong> <strong>HEALTH</strong> <strong>OUTCOME</strong> <strong>MEASURES</strong><br />
[Secs. 505(a)(2)(B)(iii) and 506(a)(2)(A)(iii)]<br />
<strong>Annual</strong> Objective and Performance Data<br />
CY 2001 CY 2002 CY 2003 CY 2004 CY 2005<br />
<strong>OUTCOME</strong> MEASURE # 04<br />
The postneonatal mortality rate per 1,000 live births (Outcome)<br />
<strong>Annual</strong> Outcome Objective 1.8 1.7 1.7 1.7 1.7<br />
<strong>Annual</strong> Outcome Indicator<br />
Numerator<br />
Denominator<br />
<strong>OUTCOME</strong> MEASURE # 05<br />
The perinatal mortality rate per 1,000 live births (Outcome)<br />
<strong>Annual</strong> Outcome Objective 10.3 10.2 10.2 10.2 10.2<br />
<strong>Annual</strong> Outcome Indicator<br />
Numerator<br />
Denominator<br />
<strong>OUTCOME</strong> MEASURE # 06<br />
The child death rate per 100,000 children aged 1- 14 (Outcome)<br />
<strong>Annual</strong> Outcome Objective 19.0 18.0 18.0 18.0 18.0<br />
<strong>Annual</strong> Outcome Indicator<br />
Numerator<br />
Denominator<br />
Title V ERP; Pennsylvania 2001 SD <strong>12</strong>.CORE (2001-2005).2 Printed: 4/26/2000




![Session B - [24 x 80] - Pennsylvania Department of Health](https://img.yumpu.com/22208291/1/190x146/session-b-24-x-80-pennsylvania-department-of-health.jpg?quality=85)

