The Status of Clinic Committees in Primary Level - Health Systems ...
The Status of Clinic Committees in Primary Level - Health Systems ...
The Status of Clinic Committees in Primary Level - Health Systems ...

Create successful ePaper yourself
Turn your PDF publications into a flip-book with our unique Google optimized e-Paper software.
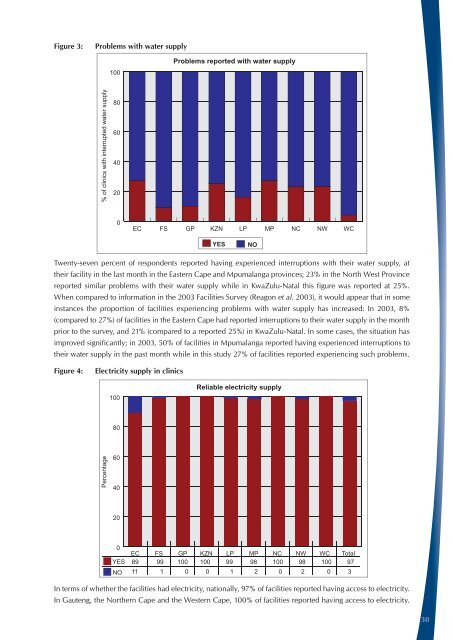
Figure 3:<br />
Problems with water supply<br />
100<br />
Problems reported with water supply<br />
% <strong>of</strong> cl<strong>in</strong>ics with <strong>in</strong>terrupted water supply<br />
80<br />
60<br />
40<br />
20<br />
0<br />
EC<br />
FS<br />
GP<br />
KZN<br />
LP<br />
MP<br />
NC<br />
NW<br />
WC<br />
YES<br />
NO<br />
Twenty-seven percent <strong>of</strong> respondents reported hav<strong>in</strong>g experienced <strong>in</strong>terruptions with their water supply, at<br />
their facility <strong>in</strong> the last month <strong>in</strong> the Eastern Cape and Mpumalanga prov<strong>in</strong>ces; 23% <strong>in</strong> the North West Prov<strong>in</strong>ce<br />
reported similar problems with their water supply while <strong>in</strong> KwaZulu-Natal this figure was reported at 25%.<br />
When compared to <strong>in</strong>formation <strong>in</strong> the 2003 Facilities Survey (Reagon et al. 2003), it would appear that <strong>in</strong> some<br />
<strong>in</strong>stances the proportion <strong>of</strong> facilities experienc<strong>in</strong>g problems with water supply has <strong>in</strong>creased: In 2003, 8%<br />
(compared to 27%) <strong>of</strong> facilities <strong>in</strong> the Eastern Cape had reported <strong>in</strong>terruptions to their water supply <strong>in</strong> the month<br />
prior to the survey, and 21% (compared to a reported 25%) <strong>in</strong> KwaZulu-Natal. In some cases, the situation has<br />
improved significantly; <strong>in</strong> 2003, 50% <strong>of</strong> facilities <strong>in</strong> Mpumalanga reported hav<strong>in</strong>g experienced <strong>in</strong>terruptions to<br />
their water supply <strong>in</strong> the past month while <strong>in</strong> this study 27% <strong>of</strong> facilities reported experienc<strong>in</strong>g such problems.<br />
Figure 4:<br />
Electricity supply <strong>in</strong> cl<strong>in</strong>ics<br />
100<br />
Reliable electricity supply<br />
80<br />
Percentage<br />
60<br />
40<br />
20<br />
0<br />
YES<br />
NO<br />
EC FS GP KZN LP MP NC NW WC Total<br />
89 99 100 100 99 98 100 98 100 97<br />
11 1 0 0 1 2 0 2 0 3<br />
In terms <strong>of</strong> whether the facilities had electricity, nationally, 97% <strong>of</strong> facilities reported hav<strong>in</strong>g access to electricity.<br />
In Gauteng, the Northern Cape and the Western Cape, 100% <strong>of</strong> facilities reported hav<strong>in</strong>g access to electricity.<br />
30