No Smoking Day 2003 - Health Promotion Agency
No Smoking Day 2003 - Health Promotion Agency
No Smoking Day 2003 - Health Promotion Agency

Create successful ePaper yourself
Turn your PDF publications into a flip-book with our unique Google optimized e-Paper software.
<strong>No</strong> <strong>Smoking</strong> <strong>Day</strong> <strong>2003</strong><br />
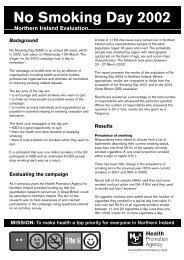
Background<br />
<strong>No</strong> <strong>Smoking</strong> <strong>Day</strong> (NSD) is an annual UK event, which<br />
takes place every year on the second Wednesday in<br />
March. The <strong>2003</strong> campaign, which was the 20th <strong>No</strong><br />
<strong>Smoking</strong> <strong>Day</strong>, took place on Wednesday 12 March<br />
and the slogan was ‘sick of smoking?’.<br />
The NSD campaign is funded and run by an alliance<br />
of organisations including health promotion bodies,<br />
professional organisations and charities, all committed<br />
to reducing smoking-related disease.<br />
The key aims of the day are:<br />
• to encourage and assist smokers who want to quit;<br />
• to make as many people as possible aware of the<br />
campaign;<br />
• to involve as many individuals and organisations as<br />
possible in activities relating to smoking cessation<br />
and education.<br />
Evaluating the campaign<br />
As in previous years, the <strong>Health</strong> <strong>Promotion</strong> <strong>Agency</strong> for<br />
<strong>No</strong>rthern Ireland provided funding so that the<br />
quantitative research carried out in Great Britain, to<br />
assess awareness of and participation in NSD, could<br />
be extended to <strong>No</strong>rthern Ireland. The questions were<br />
entered on an omnibus survey.<br />
A total of 1,018 interviews were carried out in<br />
<strong>No</strong>rthern Ireland with a representative sample of the<br />
adult population (aged 16 years and over). The<br />
probability sample was stratified by region with<br />
demographic quotas set on the basis of age, sex and<br />
social class characteristics. The fieldwork took place<br />
from 20-27 March <strong>2003</strong>.<br />
This report presents the results of the evaluation of<br />
<strong>No</strong> <strong>Smoking</strong> <strong>Day</strong> <strong>2003</strong> in <strong>No</strong>rthern Ireland (NI).<br />
Where appropriate, results are compared to those<br />
from the evaluation of <strong>No</strong> <strong>Smoking</strong> <strong>Day</strong> 2002 and the<br />
<strong>2003</strong> Great Britain (GB) evaluation.<br />
Results are quoted as a percentage of the total<br />
number of respondents who answered the particular<br />
question. Where the number of respondents who<br />
answered the question is 30 or less, results may also<br />
be given as a frequency (n).<br />
Results<br />
Prevalence of smoking<br />
Respondents were asked to choose from a list of<br />
statements describing their current smoking status.<br />
More than one third (34%) of the sample currently<br />
smoked cigarettes. A very small proportion smoked<br />
either a pipe or cigars (1%). One fifth (20%) of<br />
respondents said they used to smoke but ‘don’t<br />
anymore’ and 45% said they had never smoked.<br />
All cigarette smokers were asked about the number of<br />
cigarettes they smoked in a typical day. As shown in<br />
Table 1, the number of cigarettes smoked in a typical<br />
day is a similar to that reported in 2002. Half (50%)<br />
of all cigarette smokers smoke between 11 and 20<br />
cigarettes a day. Less than one fifth (15%) smoke 21<br />
or more cigarettes a day.<br />
Table 1: Number of cigarettes smoked in a typical day<br />
NI <strong>2003</strong> NI 2002<br />
n % n %<br />
5 or less a day 44 13 31 9<br />
Between 6-10 a day 78 23 91 25<br />
Between 11-20 a day 172 50 184 51<br />
21 or more a day 51 15 52 15<br />
Base: all smokers 345 100 358 100<br />
How smokers feel about stopping smoking<br />
To find out how smokers feel about stopping smoking<br />
and so gain an insight into smokers’ readiness to<br />
change (based on the stages of change model),<br />
smokers were asked, prior to any questions about <strong>No</strong><br />
<strong>Smoking</strong> <strong>Day</strong>, about their interest in stopping smoking.<br />
Smokers were presented with statements to describe<br />
how they felt about stopping smoking and<br />
asked to choose those that applied to them<br />
(respondents could select more than one
answer). Table 2 details the responses and provides<br />
comparisons with the previous year and GB.<br />
Table 2: Smokers’ feelings about stopping smoking<br />
NI <strong>2003</strong> NI 2002 GB <strong>2003</strong><br />
% % %<br />
I’ve never really<br />
thought about it 18 11 8<br />
I’d like to stop one day 29 31 30<br />
I’d like to stop soon 12 15 23<br />
I’m actually trying to<br />
stop at the moment 6 9 9<br />
I did stop smoking<br />
for a while but have<br />
since started again 18 21 29<br />
I like smoking and have<br />
no intention of stopping 18 14 22<br />
<strong>No</strong>ne of these 1 5 1<br />
Base: all smokers 345 358 583<br />
Those who were content with their smoking came<br />
from the AB socioeconomic grouping, smoked more<br />
than 20 a day or were aged over 55 years.<br />
Awareness of <strong>No</strong> <strong>Smoking</strong> <strong>Day</strong><br />
Eighty two percent of respondents in <strong>No</strong>rthern Ireland<br />
were aware that Wednesday 12 March <strong>2003</strong> was <strong>No</strong><br />
<strong>Smoking</strong> <strong>Day</strong>. The level of awareness has increased from<br />
last year when it was 65%.<br />
As in previous years, awareness was higher among<br />
smokers (88%) than non-smokers (79%). Awareness<br />
was also slightly higher among men (85%) than<br />
women (82%). Awareness was also generally higher<br />
among those who smoked between 11 and 20<br />
cigarettes a day (91%) and lowest for those who<br />
smoked more than 20 per day (81%).<br />
Analysis by age group shows that awareness of NSD<br />
was highest for the 45-54 age group (87%) and<br />
lowest for those aged 55 years and over.<br />
As in previous years, awareness of NSD in <strong>No</strong>rthern<br />
Ireland remains higher than in GB as a<br />
whole (64%).<br />
Table 3: Awareness of <strong>No</strong> <strong>Smoking</strong> <strong>Day</strong><br />
<strong>2003</strong> 2002 2001 2000<br />
All Smokers All Smokers All Smokers All Smokers<br />
% % % % % % % %<br />
<strong>No</strong>rthern<br />
Ireland 82 88 65 76 86 92 81 89<br />
Great<br />
Britain 64 74 55 61 71 78 77 83<br />
When analysed in relation to how smokers felt about<br />
their smoking, awareness was higher for those smokers<br />
who were trying to stop at the moment (100%, n=21) or<br />
those who stopped smoking for a while but have<br />
recently started again (98%). Awareness was lowest for<br />
those who had never thought about their smoking (77%)<br />
or who were content with their smoking (79%).<br />
Participation in <strong>No</strong> <strong>Smoking</strong> <strong>Day</strong><br />
Smokers’ intentions<br />
All those smokers who were aware of <strong>No</strong> <strong>Smoking</strong><br />
<strong>Day</strong> were asked if they intended to participate in it. A<br />
range of suggested actions was shown to smokers.<br />
More than one quarter of smokers (27%) said they<br />
intended participating in NSD. Fifteen percent of<br />
smokers said they intended to stop smoking for a<br />
specific amount of time and 3% (n=8) said they would<br />
try to stop smoking for good. Nine percent (n=29) said<br />
they intended to think about stopping smoking.<br />
Eighteen percent of smokers intended to make a quit<br />
attempt. A quit attempt includes everyone who<br />
intends to stop smoking for a specific amount of time<br />
or for good on NSD. There was little variation in these<br />
responses between males and female and between<br />
the different age groups. Based on the stages of<br />
change model, a greater proportion of the ‘currently<br />
trying to stop’ group intended to make a quit attempt<br />
on <strong>No</strong> <strong>Smoking</strong> <strong>Day</strong> (12 out of 21).<br />
Table 4: Smokers’ intended behaviour on <strong>No</strong><br />
<strong>Smoking</strong> <strong>Day</strong><br />
NI <strong>2003</strong> GB <strong>2003</strong><br />
% %<br />
Any positive response 27 25<br />
Short/long term quit attempt 18 13<br />
Thinking about stopping 9 14<br />
Base: all smokers aware of NSD n=310 n=430
Table 5: Participation in <strong>No</strong> <strong>Smoking</strong> <strong>Day</strong> (participants could select multiple responses)<br />
NI NI NI GB<br />
<strong>2003</strong> 2002 2001 <strong>2003</strong><br />
% % % %<br />
Thought about stopping smoking 11 15 14 15<br />
Picked up information about stopping smoking 2 1 2 2<br />
Talked to someone about helping me to stop smoking 1 1 2 2<br />
Helped someone else to stop smoking - - - 1<br />
Smoked less than usual 4 9 12 10<br />
Stopped for part of the day* 7 6 7 5<br />
Stopped for the whole day* 7 6 7 5<br />
Stopped for longer* 1 1 2 2<br />
Took part in a NSD event - 1 - 2<br />
Entered the quit and win contest (question added to 2002 survey) - - n/a -<br />
Smoked more than usual 4 2 2 9<br />
<strong>No</strong>ne of these 67 65 58 60<br />
*Quit attempt<br />
Smokers’ actual participation<br />
Twenty nine percent of smokers who were aware of<br />
NSD in <strong>No</strong>rthern Ireland participated in the day by<br />
quitting for a time, cutting down, accessing<br />
information or taking part in an event or competition.<br />
Details of participation can be seen in Table 5.<br />
Participation was lower than in previous years.<br />
The proportion of smokers in <strong>No</strong>rthern Ireland who<br />
were aware of NSD, and made a quit attempt on the<br />
day, was 15%. This is slightly higher than in GB<br />
(12%). As shown in Table 6, a higher proportion of<br />
35-44 year olds (24%) made a quit attempt<br />
compared to other age groups.<br />
Table 6: Percentage making a quit attempt by age<br />
group<br />
NI <strong>2003</strong> All 16-24 25-34 35-44 45-54 55+<br />
% making a<br />
quit attempt 15 15 8 24 12 12<br />
Across social class groupings fewer C2s (13%) or<br />
DEs (10%) made a quit attempt compared to ABs<br />
(24%) or C1s (20%).<br />
Awareness of publicity or advertising<br />
All respondents were asked if they had seen or heard<br />
any advertising or publicity for NSD. Awareness of<br />
publicity for the day increased from 61% in 2002 to<br />
77% in <strong>2003</strong>. As shown in Table 7, this year’s level<br />
of awareness is similar to that in the 2000 and 2001<br />
campaigns. The 2002 campaign was the only one<br />
over this four year period that did not have a<br />
television advertising campaign to promote it.<br />
Table 7: Awareness of <strong>No</strong> <strong>Smoking</strong> <strong>Day</strong><br />
advertising/publicity<br />
NI <strong>2003</strong> NI 2002 NI 2001 NI 2000<br />
% % % %<br />
Awareness of<br />
advertising/publicity 77 61 79 72<br />
Base: all adults<br />
aged 16 and over 1,018 1,158 1,121 1,131<br />
Awareness of publicity or advertising was slightly<br />
higher for females (81%), those aged 45 to 54 years<br />
(83%) and smokers (80%). In Great Britain a smaller<br />
proportion of people (46%) were aware of NSD<br />
advertising or publicity than in <strong>No</strong>rthern Ireland.<br />
Prompted source of awareness<br />
All those respondents who were aware of any<br />
publicity or advertising for <strong>No</strong> <strong>Smoking</strong> <strong>Day</strong> were<br />
asked about the source of their awareness (see Table<br />
8). Respondents could give more than one answer.<br />
As in GB the most common source of awareness<br />
was TV advertisements (62%) followed by<br />
TV programmes (30%). More people cited<br />
radio programmes (16%) in GB than in<br />
NI (6%).
Table 8: Source of awareness about NSD<br />
<strong>2003</strong> NI 2002 NI <strong>2003</strong> GB<br />
% % %<br />
TV advertisement 62 61 35<br />
TV programme 30 22 32<br />
National press advertising 10 12 15<br />
Poster 12 11 9<br />
Local press article 13 10 8<br />
Radio advertising 10 9 14<br />
Doctor’s surgery/health centre 13 9 7<br />
Radio programme 6 8 16<br />
At work 4 6 5<br />
Chemist’s shop 8 4 3<br />
Magazine 3 3 4<br />
Cinema