H A N D B U C H - Kirchner Elektronik
H A N D B U C H - Kirchner Elektronik
H A N D B U C H - Kirchner Elektronik

Create successful ePaper yourself
Turn your PDF publications into a flip-book with our unique Google optimized e-Paper software.
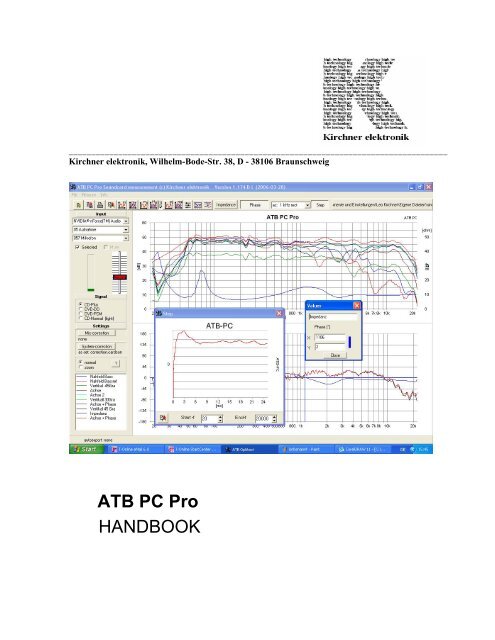
____________________________________________________________________________________<br />
<strong>Kirchner</strong> elektronik, Wilhelm-Bode-Str. 38, D - 38106 Braunschweig<br />
ATB PC Pro<br />
HANDBOOK
H A N D B OOK<br />
ATB PC Pro<br />
Project Manager<br />
Dipl.-Ing. Leo <strong>Kirchner</strong><br />
Programdevelopment<br />
Dipl.-Inf. Elmar Meyer-Carlstädt<br />
Joachim Metzner<br />
Copyright 1995 by<br />
<strong>Kirchner</strong> elektronik<br />
Wilhelm-Bode-Str. 38<br />
38106 Braunschweig<br />
Telefon +49(531)46412<br />
Fax +49(531)2407434<br />
Email: <strong>Kirchner</strong>-elektronik@t-online.de<br />
2
1. AN INTRODUCTION TO THE SYSTEM.......................................................................................................5<br />
2. GETTING STARTED ....................................................................................................................................6<br />
2.1 INSTALLATION OF THE PROGRAM...........................................................................................................6<br />
2.2 INSTALLATION OF THE USB DONGLE......................................................................................................7<br />
3. SHORT INSTRUCTIONS................................................................................................................................10<br />
3.1 SOUNDCARD ADJUSTMENT.....................................................................................................................10<br />
3.2 CHOOSING A MEASUREMENT SIGNAL..................................................................................................10<br />
3.3 ATTACHING THE TEST BOX .....................................................................................................................10<br />
3.4 STARTING THE DVD PLAYER...................................................................................................................11<br />
3.5 SOUNDCARD ADJUSTMENT.....................................................................................................................11<br />
3.6 CARRYING OUT MEASUREMENTS..........................................................................................................12<br />
4. SOUNDCARD....................................................................................................................................................15<br />
5. MEASUREMENT SIGNAL.............................................................................................................................16<br />
6. ADJUSTMENT..................................................................................................................................................17<br />
7. THE MICROPHONE .......................................................................................................................................20<br />
7.1 MICROPHONE ADJUSTMENT ...................................................................................................................20<br />
7.2 MICROPHONE SENSITIVITY .....................................................................................................................21<br />
8. PLOT MANAGEMENT ...................................................................................................................................22<br />
8.1 HANDLING SINGLE MEASUREMENTS ...................................................................................................22<br />
8.2 CURSOR.........................................................................................................................................................24<br />
8.3 THE ZOOM FUNCTION ...............................................................................................................................25<br />
9. GENERAL PARAMETERS ............................................................................................................................26<br />
9.1 RESOLUTION................................................................................................................................................26<br />
9.2 SMOOTHING.................................................................................................................................................26<br />
9.3 THE SMOOTHING FUNCTION ...................................................................................................................26<br />
10. WINDOWS - PROGRAM............................................................................................................................27<br />
10.1 STARTING ATB PC PRO ...............................................................................................................................27<br />
10.2 USER DEFINED MEASUREMENT PROGRAM .........................................................................................28<br />
11. OPENING DATA FILES .............................................................................................................................29<br />
12. SAVING DATA.............................................................................................................................................31<br />
13. EXPORTING DATA ....................................................................................................................................32<br />
14. PRINTING.....................................................................................................................................................34<br />
14.1 ADJUSTMENT...............................................................................................................................................34<br />
14.2 PRINT START................................................................................................................................................35<br />
15. WORKING WITH THE WINDOWS CLIPBOARD................................................................................36<br />
15.1 COPYING.......................................................................................................................................................36<br />
15.2 COPYING SINGLE MEASUREMENTS.......................................................................................................36<br />
16. DIAGRAM.....................................................................................................................................................37<br />
16.1 DIAGRAM INSCRIPTION ............................................................................................................................37<br />
3
17. MEASUREMENT PROGRAM ...................................................................................................................38<br />
17.1 PARAMETERS...............................................................................................................................................38<br />
17.2 SIGNAL ..........................................................................................................................................................38<br />
17.3 MEASURING WITH CD, DVD .....................................................................................................................39<br />
17.4 THE MEASUREMENTS................................................................................................................................39<br />
17.5 COMBINE.......................................................................................................................................................40<br />
17.5 THE TEST SIGNAL .......................................................................................................................................41<br />
17.6 MEASUREMENT DESCRIPTION................................................................................................................42<br />
18. AMPLITUDE-FREQUENCY RESPONSE ................................................................................................44<br />
18.1 LINE-IN ..........................................................................................................................................................44<br />
18.2 MIC-IN............................................................................................................................................................44<br />
19. IMPEDANCE MEASUREMENT................................................................................................................45<br />
19.1 THEORY...........................................................................................................................................................45<br />
19.2 ARRANGEMENT ..........................................................................................................................................45<br />
19.3 MEASURING .................................................................................................................................................45<br />
20. PHASE MEASUREMENT...........................................................................................................................47<br />
20.1 BASICS...........................................................................................................................................................47<br />
20.2 ELECTRICAL PHASE MEASUREMENT ....................................................................................................49<br />
20.3 ACOUSTICAL PHASE MEASUREMENT ...................................................................................................50<br />
21. STEP RESPONSE.........................................................................................................................................51<br />
21.1 THEORY.........................................................................................................................................................51<br />
21.2 THE MEASUREMENT ..................................................................................................................................52<br />
22. MEASURING CAR INTERIORS WITH THE CD...................................................................................53<br />
22.1 ROOM CORRECTION...................................................................................................................................53<br />
22.2 NEAR FIELD MEASUREMENTS.................................................................................................................54<br />
23. SOUND SYSTEM CALIBRATION USING THE DVD ...........................................................................55<br />
23.1 AMPLIFIER....................................................................................................................................................55<br />
23.2 MICROPHONE...............................................................................................................................................56<br />
23.3 DVD PLAYER...................................................................................................................................................56<br />
23.4 SINGLE MEASUREMENTS .........................................................................................................................56<br />
23.5 CUMULATIVE SIGNALS.............................................................................................................................60<br />
23.6 CUMULATIVE SIGNALS AND BASS.........................................................................................................61<br />
23.7 THE AUDIO TEST .........................................................................................................................................63<br />
24. CALIBRATING THE HIFI STEREO SYSTEM.......................................................................................64<br />
24.1 MICROPHONE...............................................................................................................................................64<br />
24.2 POSITIONING LOUDSPEAKERS AND THE SEATING POSITION .........................................................64<br />
24.3 ROOM ACOUSTIC MEASUREMENT .........................................................................................................66<br />
25. SURROUND-TEST DVD .............................................................................................................................68<br />
26. DIGITAL MEASUREMENTS.....................................................................................................................69<br />
27. AUXILLIARY INSTRUMENTS, MICROPHONE AND ADAPTER.....................................................70<br />
4
1. AN INTRODUCTION TO THE SYSTEM<br />
The ATB PC Measuring program combined with the computer’s soundcard forms an exact and<br />
extensive Audio Analyser.<br />
The following measurements are available:<br />
Electric and acoustic amplitude frequency response, SPL<br />
electric and acoustic phase frequency response<br />
Impedance measurement<br />
Step response<br />
The measuring system itself consists of a Surround-Test DVD for measurement signals, a PC<br />
with (USB) soundcard for the recording and valuation of sound production and the ATB PC<br />
measurement program to carry out measurements. Using the most modern measurement<br />
technology allows handling as simple as with an analyser.<br />
The Windows ATB PC measuring program contains all the properties for frequency<br />
characteristic measurement featured in the professional ATB precision program.<br />
The DVD includes signals for audible surround sound control.<br />
The ATB PC measurement program also allows a reliable car soundsystem check. As a DVD<br />
player is not usually installed in cars we have included the Auto-Test CD to ensure that all<br />
requirements are met for satisfying measurements in car interiors.<br />
The Windows measuring program corresponds to a frequency characteristic measurement<br />
reduced ATB precision program offering all the functions of the Windows operating system. For<br />
the soundcard we have developed a new measurement technology which optimises<br />
instrumentation. Measurement signal generation using a CD or DVD player bypasses the low<br />
quality multiplex operation of the soundcard which simultaneously tasks play and record. Only<br />
the record function of the soundcard is used in conjunction with system compatible speech<br />
recognition technology. Notebooks and external USB soundcards prove to be ideal for this field<br />
of work. The frequency characteristic errors of the soundcard are avoided with a correction<br />
curvature. With the help of the adapter the correction curvature is easy to create. The frequency<br />
errors of the soundcard, due to sample rate inaccuracy and fluctuation, are bypassed with a new<br />
correlation method. The new correlation method allows an acoustic measurement independent<br />
from distance definition. Thus making a time window superfluous, which results in handling as<br />
easy as operating a terz analyser.<br />
For CAD or calculation program or data base the ATB PC data can be exported in many<br />
formats. The export is to MLSSA, LAUD, IMP and CLIO file.<br />
5
2. GETTING STARTED<br />
2.1 INSTALLATION OF THE PROGRAM<br />
To install the program place the CD “ATB-PC Software” into the hard disk drive.<br />
Double click on the workplace icon on the Windows desktop. Open the disk drive e.g.<br />
“NEW (D : )”<br />
Double click on the CD icon “ATB-PC”<br />
A double click on the Icon SETUP.EXE will start the installation.<br />
To continue click on the NEXT buttons. Follow by clicking on the INSTALL button and complete<br />
the installation by clicking on the FINISH button.<br />
6
2.2 INSTALLATION OF THE USB DONGLE<br />
In order to operate the ATB PC II program a USB Dongle has to be installed.<br />
To install the Dongle, first insert the Dongle into a free USB slot.<br />
Important: The chosen USB slot is to be kept whilst operating with the program.<br />
Inserting the dongle should activate the Hardware Wizard<br />
After clicking on the message the following menu will appear (it may also appear automatically)<br />
If there is the message “Unknown device” the computer is not compactible with the dongle.<br />
In this case you have to look for another USB input.<br />
Please choose the manual installation.<br />
The driver is located on the ATB PC Software CD-ROM. Please choose the correct drive letter<br />
(eng. F:).<br />
7
For WindowsXP choose the file ATBUSXP.<br />
The driver has not been Microsoft certified<br />
Please select Continue Installation.<br />
8
Click on the Finish button.<br />
You’re ready to go!<br />
With the short instruction of the Handbook you will get your first measurement .<br />
If you want to check the correct installation of the dongle then open SYSTEMCONTROL in the<br />
START menu then open SETTINGS choose SYSTEM from the list then HARDWARE and then<br />
DEVICE MANAGER where you will find a list containing various devices including the BUS<br />
controllers :<br />
“ ATB-LOCK-USB by Otte <strong>Elektronik</strong> GmbH” should be listed.<br />
9
3. SHORT INSTRUCTIONS<br />
3.1 SOUNDCARD ADJUSTMENT<br />
Choose the soundcard required and set to “Record”, “Recording Control” or “Wave IN” and also<br />
“Microphone”. If “Selected” is not activated, please click on the box to activate it.<br />
3.2 CHOOSING A MEASUREMENT SIGNAL<br />
At this point you have the choice between taking measurements with the Surround-Test DVD or<br />
the Auto-Test CD. For the Surround-Test DVD the option DVD-DD is chosen (as shown above).<br />
CD-Plus is chosen for the CD.<br />
3.3 ATTACHING THE TEST BOX<br />
Audio analog out<br />
left<br />
System-correction<br />
Soundcard<br />
MIC<br />
Connect the Test box by inserting the cinch cable to the left (channel) analogue socket of the<br />
DVD player. The end with the jack plug is connected to the Microphone in slot (red-pink)<br />
of the soundcard. The switches are to be set to 1 and correction.<br />
10
3.4 STARTING THE DVD PLAYER<br />
The Surround-test DVD is to be placed into the DVD player and “Single signal” is to be<br />
selected in the Surround-test DVD’s menu. In the following summary the left front loudspeaker<br />
should be flash on and off (DVD track 3).<br />
When using the CD please choose CD track 2.<br />
3.5 SOUNDCARD ADJUSTMENT<br />
Start the program atb.exe<br />
After pressing the button “system correction”<br />
The correction menu will appear :<br />
A measurement can be initiated by pressing the top start button, switch position 1 and correction<br />
are also initiated. First of all the program will find and adjust to the optimum level. The procedure<br />
can be observed at the top left of the modulation display.<br />
After a successful first measurement a blue frequency response curvature will be displayed.<br />
After switching the Test-box to position 2 and pressing the bottom start button, the adjustment is<br />
carried out. The result is displayed by a red curvature.<br />
11
The measurement correction is herewith completed and is now available for all following<br />
measurements.<br />
3.6 CARRYING OUT MEASUREMENTS<br />
Audio analog out<br />
left<br />
SPL<br />
CD in<br />
left<br />
Speaker left<br />
Soundcard<br />
MIC<br />
Please connect your DVD player back to the HiFi system.<br />
Position the microphone 1m away and in front of the left front loudspeaker and connect the<br />
microphone to the microphone socket of the soundcard. The test-box is not necessary for this<br />
measurement. The microphone should be positioned at “ear height”. Usually about 80-90 cm<br />
above the floor, as music is usually listened to whilst in a seated position (unless you are<br />
intending to dance of course!)<br />
A double click on the desktop connection will activate the atbpc.exe program.<br />
Choose “parameter” from the menu and position the smooth value to1/6 :<br />
12
Play DVD track 3 once again (Dolby Digital left hand front loudspeaker, Menu-single signals)<br />
and activate the button “mean measure”.<br />
When using the CD, please use CD track 2. The modulation display indicates microphone-level.<br />
With the slide controller (record) you can adjust the microphone sensitivity.<br />
The green bar should fill ¾ of the display window.<br />
The bar turns red if the microphone is overriding (set to a too sensitive position).<br />
13
The frequency response curvature of the left hand loudspeaker should appear on the screen.<br />
14
4. SOUNDCARD<br />
The program runs with all newer soundcards with a sample rate capacity of 48kHz. If 48kHz is<br />
not possible an error message will be given at the start of the program or the measurement<br />
curvature will tend to fluctuate extremely whilst operating in system correction (is not a constant<br />
line).<br />
Before carrying out the initial test you must activate the program mixer.<br />
In the menu INPUT you must carry out the following adjustments:<br />
In the top line you must choose the soundcard you selected in system control ( here for example<br />
NVIDIA nForce(TM)Audio ).In the middle line RECORD (AUFNAHME) or WAVE IN should be<br />
selected. In the bottom line MICROPHONE (MIKROFON) should be selected. If MICROPHONE<br />
cannot be selected in the bottom line then select AUFNAHME or WAVE IN in the top line after<br />
this you should be able to select MIKROFON. If a tick does not appear in the box next to<br />
SELECTED then you have to select a different soundcard and then the soundcard you intend to<br />
use.<br />
If the adjustments are not possible with this menu, then they can also be carried out as follows:<br />
To adjust the soundcard first click on the SETTINGS button in the START menu and select<br />
SYSTEM CONTROL. There you will find SOUNDS/AUDIODEVICES. Open it up with a double<br />
click and the AUDIO card will appear. Click on the button SOUNDRECORD and select the<br />
soundcard you intend to use. After this click on the button VOLUME and the MIXER will be<br />
opened. Activate the microphone and set the controller to maximum. You can now exit the<br />
menu, the microphone is ready to operate. Now we need to test the recording function. Connect<br />
the Test box by inserting the cinch cable to the left AUDIO OUT socket of the CD or DVD player.<br />
The end with the jack plug is connected to the Microphone IN socket (red-pink) of the<br />
soundcard. The switches are to be set to 1 and correction. When using a CD player the auto test<br />
is carried out using CD track 1.The left hand loudspeaker is selected in the surround test DVD<br />
menu when using a DVD player. After initiating a test with button<br />
of the input signal is displayed in the input window.<br />
the volume (amplitude)<br />
15
5. MEASUREMENT SIGNAL<br />
Before carrying out a test the measurement signal must be adjusted.<br />
There are 2 signals on the CD and 2 signals on the DVD available for measurement purposes.<br />
The signals CDplus and CDnormal are to be found on the CD.<br />
CDplus is the usual test signal used in most measurement processes. It corresponds to the<br />
DVD signal in relation to it’s frequency distribution. The signal with it’s x 4 oversampling is<br />
almost analogue.<br />
The signal CDnormal with it’s measurement period of 1/3 s allows extremely fast results to be<br />
acquired. This makes the equalizing of filter switches very easy to carry out. The signal with it’s x<br />
4 oversampling is almost analogue.<br />
The quality of measurement reproduction is constant even when operating with high<br />
frequencies.<br />
Dolby Digital (DD) signals and PCM signals are located on the DVD.<br />
The surround test uses the surround test DVD and the DD signal as source.<br />
The DD and the PCM signal differ in their higher threshold frequencies. The DD signal has a<br />
threshold of 20kHz and the PCM signal 22kHz.<br />
The PCM signal is used for loudspeaker testing. It has a 24 bit resolution and a sample rate of<br />
48kHz. Up to 22kHz can be measured with the signal.<br />
The PCM signal is also used for digital measurements.<br />
IMPORTANT!<br />
The adjustments and system correction must comply with the test signal.<br />
16
6. ADJUSTMENT<br />
Most soundcards have a good recording function. The problem is that the microphone input<br />
channels do not possess a sufficient linear frequency characteristic required for a satisfying<br />
result when testing, therefore they need to be corrected.<br />
When undertaking a correction the DVD player is also corrected. The Dolby Digital and the PCM<br />
signals also require different correction curvature. Even the measurement space can be entailed<br />
in the correction. Therefore as many card correction curves as desired can be used.<br />
If you have started a measurement without using already measured or previously saved system<br />
corrections an error message will appear.<br />
The message tells you that you have selected either a wrong or no system correction. Therefore<br />
you must either select or create an appropriate system correction. After closing the message by<br />
clicking on the OK button the menu system correction will appear.<br />
(The menu can also be opened under SETTINGS).<br />
To create the SYSTEM CORRECTION you must first connect the Testbox by inserting the cinch<br />
cable to the left AUDIO OUT socket of the CD or DVD player. The end with the jack plug is<br />
connected to the Microphone IN socket (red-pink) of the soundcard. The switches are to be set<br />
to 1 and correction. When using a CD player the auto test is carried out using CD track 1.The<br />
left hand loudspeaker is selected in the surround test DVD menu when using a DVD player.<br />
After pressing the SYSTEM CORRECTION button the CORRECTION menu will appear.<br />
17
A measurement can be initiated by pressing the top start button, switch position 1 and correction<br />
are also initiated. First of all the program will find and adjust to the optimum level. The procedure<br />
can be observed at the top left of the modulation display.<br />
After a successful first measurement a blue frequency response curvature will be displayed.<br />
After switching the Test-box to position 2 and pressing the bottom start button, the adjustment is<br />
carried out. The result is displayed by a red curvature.<br />
The measurement correction is herewith completed and is now available for all following<br />
measurements.<br />
Whilst CORRECTION is taking place, the following error indication messages may appear :<br />
“missing/weak signal” or “no signal”<br />
Check to see if the testbox is properly connected. (The left AUDIO OUT socket of the DVD/CD<br />
player are connected to the MICROPHONE IN of the soundcard.<br />
When using the surround-test DVD in conjunction with a DVD player check that the left hand<br />
loudspeaker is selected.<br />
When using a CD player, track 1 or 2 should be selected from the CD.<br />
It is also possible that the microphone needs to be amplified (boosted). To enable this,<br />
SETTINGS are to be selected from the START menu on the Windows desktop, from there on<br />
select SYSTEMCONTROL then SOUNDS/AUDIO DEVICES. From the card select AUDIO and<br />
click on RECORDVOLUME, the record mixer should appear. Click on the EXTENDED option in<br />
the microphone window and activate the microphone boost.<br />
“signal too strong”<br />
Set the soundcard settings in the main menu to RECORD or WAVE IN and MICROPHONE.<br />
Switch the Testbox to CORRECTION.<br />
18
Turn the microphone amplifier (booster) off. To do this SETTINGS are to be selected from the<br />
START menu on the Windows desktop, from there on select SYSTEMCONTROL then<br />
SOUNDS/AUDIO DEVICES. From the card select AUDIO and click on RECORDVOLUME, the<br />
record mixer should appear. Click on the EXTENDED option in the microphone window and<br />
deactivate the microphone boost.<br />
“insufficient record level”<br />
It is also possible that the microphone needs to be amplified (boosted). To enable this,<br />
SETTINGS are to be selected from the START menu on the Windows desktop, from there on<br />
select SYSTEMCONTROL then SOUNDS/AUDIO DEVICES. From the card select AUDIO and<br />
click on RECORDVOLUME, the record mixer should appear. Click on the EXTENDED option in<br />
the microphone window and activate the microphone boost.<br />
“same level”<br />
For the second measurement turn the Testbox to position 2<br />
“level too high”<br />
Repeat the measurement, use position 1 on the Testbox switch for the first measurement and<br />
position 2 for the second measurement.<br />
When the measurement curvatures correspond with the figure below then the correction<br />
measurement was successful.<br />
After successful completion the curvature should be saved along with the name of the<br />
soundcard, input and DVD/CD player.<br />
After leaving the menu with OK, a test measurement can be taken. A test signal is used in<br />
compliance with the systemcorrection measurement. The measurement is started with the<br />
button M. When the correction curvature has been correctly measured then the result is a<br />
straight line, that descends steeply at 20 kHz.<br />
19
7. THE MICROPHONE<br />
7.1 MICROPHONE ADJUSTMENT<br />
The ATB PC microphone MC 1 corresponds in precision of frequency response to the<br />
professional electret measuring microphones and does not need to be adjusted.<br />
The ATB PC measurement program makes the adjustment of as many microphones as desired<br />
possible. This function allows a lot of other adjustments:<br />
1. The adjustment of bass elevation.<br />
First choose the position where loudspeakers and microphone are to be installed. A loudspeaker<br />
that has been already tested in an open space, large hall or outside, should be chosen. After the<br />
test has been carried out the frequency characteristics are compared and the difference with<br />
MIC-CORRECTION curve negatively adjusted.<br />
2. Acoustic adjustment of car interiors.<br />
A linear frequency characteristic is not recommended for car interiors. Frequency characteristics<br />
that comply with CAR&HiFi are audibly better. These frequency characteristics can also be<br />
adjusted with MIC-CORRECTION. Thus only the straight frequency characteristic must be taken<br />
into consideration. Audible adjustment is the appropriate adaption. Open MIC-CORRECTION in<br />
the SETTINGS menu.<br />
Using the pointer the curve representing the recorded frequency characteristic of the<br />
microphone applied is adjusted. To carryout this the negative curve is applied, a bank in the<br />
recorded frequency characteristic becomes a fall (break).<br />
20
7.2 MICROPHONE SENSITIVITY<br />
MICROPHONE SENSITIVITY is necessary for SPL measurements. Because of the differing<br />
input sensitivity of soundcards the measurement cannot be directly applied. Thus a correction<br />
factor is used. The correction factor is to be found in MIC.-CORRECTION and is a part of the<br />
microphone adjustment. A frequency characteristic correction is not necessary when using the<br />
delivered microphone MC1. Nevertheless after ascertainment of the microphone correction<br />
factor is the unchanged curve with the name MC1 to be saved.<br />
The correction factor is also to set in the parameter menu.<br />
Measuring the correction factor<br />
The value for the correction factor is to be ascertained with instrumentation. The microphone<br />
controller of the soundcard is to be put to full volume and a loudspeaker, who’s SPL curve has<br />
been measured by the manufacturer, is placed 1 metre away. The input voltage of the speaker<br />
should be 2.8V for a 8Ω or 2V for a 4Ω speaker. After the measure the SPL values are<br />
compared for a part being well balanced and in both curves identical. The difference in dB<br />
between both curves is noted in MIC-SENS. After testing both curves should have the same dB<br />
values.<br />
21
8. PLOT MANAGEMENT<br />
8.1 HANDLING SINGLE MEASUREMENTS<br />
Up to 32 single measurements can be handled with the window in the programm or the menu<br />
PLOTS.<br />
With a right mouse click at the plot name there is to activate the menu.<br />
The menu performs following tasks:<br />
1. To select a colour for the plot:<br />
Click the colour in the colour window.<br />
2. Selecting PLOT line type with style:<br />
In front of the field for plot name the colour and line type are displayed.<br />
After selecting the plot to be changed with the cursor the colour/style menu is opened<br />
with a right mouse click. After selecting style the menu<br />
for he different types of line is displayed, choose the one desired.<br />
This function allows the different lines to be identified when printing in black and white.<br />
Important! This only functions with a Print-line width of 1.<br />
3. To name the plot:<br />
After actuation of the RENAME button enter the name of the graph in the NAME window.<br />
4. To ERASE the graph:<br />
Actuation of the DELET button erases the graph.<br />
5. To ERASE only the phase of a plot:<br />
Actuation of the KILL PHASE button only erases the phase of a graph.<br />
22
The menu is opened with<br />
The PLOT menu performs following tasks:<br />
1. To select a colour for the plot:<br />
Click the colour in the colour window.<br />
2. Selecting PLOT line type:<br />
In front of the field for plot name the colour and line type are displayed.<br />
After selecting the plot to be changed with the cursor the colour/style menu is opened<br />
with a right mouse click. After selecting style the menu<br />
for he different types of line is displayed, choose the one desired.<br />
This function allows the different lines to be identified when printing in black and white.<br />
Important! This only functions with a Print-line width of 1.<br />
3. To name the plot:<br />
Enter the name of the graph in the NAME window.<br />
23
4. To copy the graph into the clipboard:<br />
Click on the COPY field. The measured values are copied into the clipboard in the ATB<br />
format.<br />
Retrieval can proceed with any Windows program.<br />
5. To ERASE the graph:<br />
Actuation of the DEL button erases the graph.<br />
8.2 CURSOR<br />
The cursor enables plot value evaluation. Activate the function with a double click on the plot<br />
you wish to evaluate (the mouse cursor appears as a cross when led over a curvature). The<br />
window VALUES will appear.<br />
The VALUES displays following values:<br />
X = Frequency<br />
Y = Amplitude<br />
When the values are read out the frequency is predefined. The X value is selected with the<br />
cursor.<br />
24
8.3 THE ZOOM FUNCTION<br />
A zoom function is contained in the optitest basic menu. After clicking ZOOM with the left mouse<br />
button<br />
it is possible to (the left mouse button is held pressed) mark the area intended for closer<br />
inspection. The area selected will then automatically be enlarged. The frequency range remains<br />
unchanged for further measuring. To return from the zoom function NORMAL is then selected.<br />
The frequency range can also be adjusted with the zoom function.<br />
25
9. GENERAL PARAMETERS<br />
9.1 RESOLUTION<br />
The resolution gives the scale of the Y-axis. It’s upper limit is fixed at 0dB, which automatically<br />
gives the lower limit a negative value. Reduction of the shown can thus be compared to a<br />
zooming in to an existing diagram. ’Zooming’ presupposes, however, adequate transformer level<br />
control.<br />
9.2 SMOOTHING<br />
The parameter SMOOTH is there to smooth out a line described by a plot curve.<br />
It is in the nature in particular of acoustical measurements to produce rather coarse<br />
graphs. Such irregularities in the graph may blur its major characteristics; hence the<br />
smoothing option.<br />
The SMOOTHING parameter determines the smoothing radius, which is the number of<br />
previous and subsequent measured values used in calculating the value currently<br />
displayed. The setting range is displayed in octaves (1/24, 1/12, 1/6, 1/3, 1/2, 1).<br />
9.3 THE SMOOTHING FUNCTION<br />
The smoothing option compares with a digital filter<br />
The amplitude values to the left and to the right of f 0 are multiplied by a factor in compliance<br />
with the illustration and added, including f 0. The result will be divided and indicated for f 0.<br />
The advantage of this smoothing procedure lies in the fact that the graph characteristics are<br />
maintained.<br />
Smoothing implies that the different plots are redrawn, while the measured values remain intact.<br />
To return to the original (unsmoothed) plot, change the smoothing factor back to 0. Except for<br />
waterfall diagrams where for optical reasons some smoothing is indispensable, a smoothing<br />
parameter 0 implies that there is actually no smoothing. Apart from such intended smoothing<br />
there is no hidden measured value manipulation.<br />
The resultant of a smoothed plot is similar to that of a wobble measurement, or, in other words,<br />
the smoothing radius corresponds to the wobble range of the sinusoidal wave.<br />
26
10. WINDOWS - PROGRAM<br />
10.1 STARTING ATB PC Pro<br />
If the program group ATB for Windows is shown as a symbol, it must be opened with a double<br />
click on the symbol. After this the ATB is opened with a double click on the program symbol :<br />
The ATB user interface for Windows:<br />
Program operation complies with the Windows standard operating method.<br />
27
10.2 USER DEFINED MEASUREMENT PROGRAM<br />
When leaving the ATB precision program the actual adjustments are saved. When reopening<br />
the program the saved adjustments will automatically be loaded, the last measurement carried<br />
out to be started immediately. Data is saved in the INI file - ATB.INI.<br />
Because more than one user often operate with the same system or if one user has a lot of<br />
different operating sequences with corresponding parametric adjustments, it is possible to keep<br />
user defined parametric records (Basic adjustments) and load them when required.<br />
This is activated with a program link to a *.INI file. The INI file data is saved when leaving the<br />
program.<br />
Creating a test program with a user defined *.INI file:<br />
After a right mouse click on the ATB program icon the following menu will appear, where<br />
CREATE LINK should be chosen (left mouse click).<br />
The Icon „Link with ATB_P, should appear, a right click on the icon opens the next menu where<br />
you should left click on the option “PROPERTIES”. The menu PROPERTIES OF LINK WITH<br />
ATB_P in LINK under TARGET (GOAL) first press „space“ on your keyboard and choose a<br />
name extention fort he file e.g. for user Leo the name LEO.INI.<br />
28
11. OPENING DATA FILES<br />
With the command FILE • OPEN you can open a file saved on the disk drive.<br />
The following pop up window will appear:<br />
The pop up window shows the data in a file.<br />
Disk drive and files can be changed with SEARCH IN:<br />
Click on the desired data, the name will appear in the box DATA NAME. Clicking on open will<br />
open the following menu :<br />
29
The buttons in the menu have the following functions:<br />
OPEN<br />
LOAD ALL<br />
Clicking on OPEN jumps back to the menu OPEN to enable a new data<br />
selection.<br />
loads all plots in the file list (previous plots will be deleted).<br />
LOAD SELECTED<br />
loads a selected plot into the diagram.<br />
CLOSE<br />
closes the function LOAD SELECTED<br />
The name of the opened file is shown in the program.<br />
30
12. SAVING DATA<br />
After creating or changing a file, the file should be saved. This enables you to retrieve and work<br />
with the file later.<br />
When saving for the first time the following pop up window will appear :<br />
The name of the data to be saved should be written in the box data name. It is suggested that<br />
the name extension .ana be used. Im Feld SPEICHERN IN wird Laufwerk und Ordner gewählt,<br />
in dem Ihr Dokument gespeichert werden soll. The pop up window is closed by clicking SAVE.<br />
.<br />
31
13. EXPORTING DATA<br />
The ATB program has many export formats so that data can be exported to other programs. It is<br />
an ASCII text format. This allows the data to be read by many programs.<br />
A lot of CAD programs need a special format to read loudspeaker data for example. To be<br />
compatible with nearly all known programs the ATB PC Pro has the function to export data in<br />
several formats.<br />
The EXPORTMENU is to open in the menu FILE<br />
In this menu there is to set the format.<br />
32
When saving data in the ATB export format it is important to differentiate between saving<br />
measurements with multiple curves and singular measurements.<br />
1. Saving measurements.<br />
Open EXPORT in the menu FILE.<br />
The pop up window SAVE AS will appear and the measurements saved.<br />
2. Saving plots with the clipboard.<br />
After measuring the menu PLOTS is opened. Pick out the plots to be saved with the pointer.<br />
After that press the clipboard button :<br />
The plot data will be stowed in ASCII Format in the clipboard.<br />
3. Autoexport<br />
The autoexport function saves the latest frequency response curvatures automatically in a<br />
predefined file. Thus the results are open for evaluation from other programs.<br />
In the context menu the target path can be chosen. The separator/slash can be selected using<br />
the EXPORTMENU.<br />
33
14. PRINTING<br />
Of course you wish to see your documents in black and white, to do this they have to be printed.<br />
A printer must be connected to your PC to enable the printing of a diagram. The printer must be<br />
installed properly, power on and switched to »On Line«. Your printer can only receive data from<br />
your PC when the printer is switched On Line.<br />
14.1 ADJUSTMENT<br />
By opening printconfig in the menu FILE you can choose the printratio (length/height) and the<br />
print line width<br />
34
14.2 PRINT START<br />
The button<br />
prints the whole document.<br />
If PRINT is activated in the menu FILE the following print menu will appear<br />
In COPIES you can choose the amount of copies to be printed.<br />
35
15. WORKING WITH THE WINDOWS CLIPBOARD<br />
The Windows clipboard is available to any application. It is an outstanding tool when exchanging<br />
data between different applications.<br />
15.1 COPYING<br />
To copy the diagram produced from all the measurements made into the clipboard press:<br />
15.2 COPYING SINGLE MEASUREMENTS<br />
Single measurements can also be copied into the clipboard. The format for the files saved is<br />
the ATB-format. These data are ASCII-Data. The copying procedure for single measurements is<br />
described in the chapter EXPORTING DATA.<br />
36
16. DIAGRAM<br />
16.1 DIAGRAM INSCRIPTION<br />
The diagram can be marked in the window PLOTS. PLOTS is opened with<br />
Measurement diagrams can be marked in the PLOT window. The diagram elements,<br />
HEADLINE, LEFT, RIGHT and OPTION, are those above each diagram. Options are also<br />
available for marking the diagram axes and the required units. This window is adjusted to the M-<br />
TYPE (measurement type) in question. The HEADLINE is shown to be presenting ATB<br />
precision. It can, however, be overwritten by the user for each relevant measurement.<br />
Set the mouse cursor in the field to be written in and activate the menu “script”.<br />
37
17. MEASUREMENT PROGRAM<br />
17.1 PARAMETERS<br />
SMOOTHING<br />
Smoothing radius in octaves, 1/24, 1/12, 1/6, 1/3 = Terz, ½, 1<br />
SCALE (RESOLUTION)<br />
Field of scale from 5 to 60dB<br />
MIC<br />
In this window there is to set the lowest dB level for the dB scale.<br />
17.2 SIGNAL<br />
38
The program has the capability to task various assignments.<br />
It is possible to use either the CD or the DVD as a signal source for measuring. The CD is used<br />
for car interiors (most cars lacking a DVD Player). The surround sound system can only be<br />
tested in conjunction with the DVD . The signal source and signal type are to be chosen in the<br />
signal menu.<br />
The signals Normal und Plus are to be found on the CD.<br />
The signals Dolby Digital (DD) und PCM are to be found on the DVD .<br />
17.3 MEASURING WITH CD, DVD<br />
The signal for the Optitest can come either from CD or DVD player. The signals for the program<br />
are on the Auto-Test CD or the Surround-Test DVD. It is especially important for car sound<br />
systems to use the CD. The advantages are :<br />
1. There are no complicated cable systems from ATB output to the (hard to reach)<br />
sound system input necessary. This is especially important when serial testing.<br />
2. The whole system is measured. The qualities of CD player, equaliser, amplifier and<br />
loudspeakers are tested at once. This is especially important when testing the<br />
surround system. The qualities and adjustments of the Dolby Digital Decoder are<br />
included in the test.<br />
17.4 THE MEASUREMENTS<br />
An especially important function of the Optitest measurement is the mean of the measurements.<br />
With this function the mean average of the measurement is in real-time, so that results can be<br />
read whilst measuring is in progress.<br />
The Measurements mean average M and M+ are activated with the buttons shown above.<br />
The number of mean averages , for the test duration , is unlimited.<br />
Another function of the Optitest is the M D und M+D continous measurement. This test is a<br />
constant measurement where the actual measurement is shown. This allows the comparison of<br />
instruments, new adjustments will be shown immediately. With the buttons<br />
39
testing is started and stopped. After a test new start it is possible keep the first plot (to allow<br />
comparison) or to allow it to be deleted. This is done by marking the box next to the M+D button.<br />
To compare instruments a target plot is measured or loaded. After this the test is carried out with<br />
M+D on the instrument to be compared. For the duration of the test only the last measurement is<br />
shown. If the new plot complies to the referred plot then the instrument has been equalized and<br />
the test is stopped.<br />
17.5 COMBINE<br />
The Optitest has the special function COMBINE<br />
The menu allows the simple combination of nearfield and distance (SPL) measurement. The<br />
combine menu is opened with the button<br />
In this menu the last two measurements will be shown. With the field<br />
can the distribution of nearfield and distance (SPL) plots be changed.<br />
The next step is to set the cut frequency between distance (SPL) and nearfield plots with the<br />
low/high connector.<br />
Low/high-connector can be adjusted to make room resonance vanish. To make both plots into a<br />
single line the near field plot is to be set with the low-frequency level connection.<br />
40
For proper results the following is to be considered : The remote field measurements are to be<br />
carried out as an SPL measurement. The microphone distance is 1 metre. The amplifiers outputvoltage<br />
is set to 2,8V for 8Ω loudspeakers and 2V for 4Ω loudspeakers. This measurement<br />
provides the reference level for the plot and will not be changed . Through adaption of the near<br />
field measurement the plot remains realistic.<br />
17.5 THE TEST SIGNAL<br />
For measuring the PPN (Pseudo-Pink-Noise) signal is used. It is a deterministic noise. Through<br />
the function of 4X oversampling it is an analogue signal. One of the considerations during the<br />
development of the signal was the adaption of the measurement technology to the later function<br />
of the instruments tested. A loud speaker is for the transmission of music and speech. In<br />
correspondence with this the capacity of the loudspeaker is defined for the frequency range. In<br />
accordance with DIN is the performance at 100% total capacity as follows:<br />
Low frequency from 40Hz – 600Hz 62%<br />
Midrange from 600HZ – 4kHz 30%<br />
Tweeter from 4kHz – 20kHz 8%<br />
Because of it’s steady energy distribution the Pink-Noise signal is adapted to the frequency<br />
characteristic of the music. The MLS (Maximum Length Sequence) signal is the exact opposite.<br />
PPN<br />
MLS<br />
The pictures show the analyser measurements of the PPN and MLS signals. Both signals are a<br />
deterministic noise (a frequency mix). The PPN signal shows a pink noise. Practically all terz<br />
bars have the same amplitude. The drop in the low frequency range is not to be taken into<br />
consideration for measurements. The MLS signal tends to comply with white noise. This is easily<br />
audible when testing. The high frequencies have an extremely high amplitude and the low<br />
frequencies are contained in the signal with –45dB. In opposition to terz analysis the MLS signal<br />
appears after testing through the correlation with a straight frequency characteristic. A<br />
correlation has the following functions:<br />
41
The loudspeaker is steered with the MLS signal shown above. If the loudspeaker has for<br />
example a linear frequency characteristic then the same signal will be recorded by the<br />
microphone used. It is changed into a digital signal within the measuring instrument. This signal<br />
as well as the MLS signal are withheld in the computer in digital form. During the correlation both<br />
signals are compared. The result ( frequency characteristic ) consists of a picture of the<br />
differences. If both signals are the same(in the case of the linear loudspeaker) the result is a<br />
straight line. If the loudspeaker does not transmit the low frequency range very well, then the<br />
difference between the signal measured and the output signal are pictured as a drop in the<br />
frequency characteristic.<br />
That the MLS signal is not suitable for testing is proved by the following :<br />
The loudspeaker is steered with the MLS signal. The energy distribution of the MLS the exact<br />
opposite of the music signal ; in the high a lot and in the low range nearly no energy.<br />
The results of this are:<br />
1. The extremely high energy of the high frequencies overload the high tones, so that a<br />
part of the frequency characteristic measured consists of dynamic compression and<br />
distortion. The result is that one of the music transmission frequency characteristics<br />
cannot be measured.<br />
2. Because of the very small signals in the low frequency range an exact and<br />
reproducible measurement is nearly impossible. This leads to the need for at least 10<br />
measurements with the MLS signal before an exact result (with adaptive windows)<br />
can be expected.<br />
The PPN Signal owns a steady energy distribution. It doesn’t overload the high tones and has<br />
enough signal amplitude in the low frequency range. Each measurement is reliable (even<br />
without an average mean).<br />
17.6 MEASUREMENT DESCRIPTION<br />
Carrying out a measurement is very simple, thanks to the new correlation type. The test signal<br />
can come from either a CD or DVD.<br />
Computers are usually unsuitable for the playback of CDs. This lies in the properties of<br />
soundchips and soundcards. Soundcards are not able to transmit the frequency of a sinus signal<br />
with a constant frequency. The frequency fluctuates between +/- 10%, with a 4kHz sinus<br />
between 3,6kHz und 4,4kHz.<br />
42
Frequency character of PPN signal : red = ATB-selftest, green = DVD-player, blue = soundcard<br />
The picture shows the frequency characteristic of the soundcard. The distorted frequency<br />
characteristic is created by frequency changes that were not considered in the correlation. Even<br />
with the correct measuring instruments it is not possible to await correct results through this<br />
property of the soundcard.<br />
For example if a soundcard measuring system shows extreme jumps when measuring distortion<br />
it is often held for high accuracy. The truth is that high quality, renounced measuring instruments<br />
do not display these jumps because they are not really there.<br />
The strong correlation used by ATB proves itself with unsensitivity against delays and extreme<br />
phase shifts. This means no distance need be adjusted when measuring loudspeakers. Digital<br />
switches and equalizers can also be measured without problems.<br />
Whilst measuring, the output voltage is to be chosen so that the instrument or loudspeaker is at<br />
listening volume.<br />
The input voltage range is chosen so that the curve is in upper range of the diagram. It should<br />
not surpass the top edge though.<br />
One of the four test signals (according to which operation) is used for measuring.<br />
43
18. AMPLITUDE-FREQUENCY RESPONSE<br />
Amplitude-frequency response is the difference between the electronic measurements of the<br />
LINE-IN and the acoustic measurements, SPL, of the MIC input.<br />
18.1 LINE-IN<br />
Using this measurement the frequency response of amplifiers, electronic switches and the<br />
equalizers of CD and DVD players can be tested. Depending on the soundcard it is also for the<br />
impedance measurement. For this test the device’s audio output is connected to the LINE IN of<br />
the soundcard.<br />
System-correction for LINE IN soundcard :<br />
The left AUDIO OUT channel of the CD/DVD player is connected to Testbox. The jack plug is<br />
connected to LINE IN of the soundcard. The switch position of the Testbox is 1 and impedance.<br />
There should be no devices connected to the banana jacks. The soundcard should be set to<br />
RECORD or WAVE IN and LINE IN. The signal to be used is CD plus or, for studio purposes,<br />
PCM.<br />
After starting track 1 on the CD player or with left loudspeaker in the DVD player’s menu,<br />
SYSTEM CORRECTION is to be activated in the program menu. An impedance measurement<br />
cannot be carried out when using LINE IN therefore only one measurement is necessary. This<br />
measurement is carried out with the lower start button. A red curvature is rendered. The<br />
soundcard modulation, top left in the program, should be green and be in within ¾ of the<br />
indicating range. If this is not so then the level controller is to be adjusted and the correction to<br />
be repeated. The measurement is to be saved with the name LINE and is always to be used<br />
when measuring with LINE IN.<br />
The device to be tested is to be connected to the left AUDIO OUT channel of the CD/DVD<br />
player.<br />
Studio devices can also be digitally connected using the DIGITAL OUT socket.<br />
The LINE IN socket can also be used for SPL measurements when using microphones with preamplifiers.<br />
18.2 MIC-IN<br />
SPL frequency response measurements are carried out in conjunction with the MICROPHONE<br />
IN socket. Depending of the soundcard it is also for the impedance measurement. SYSTEM<br />
CORRECTION is carried out in correspondence with the correction.<br />
How to carry out acoustic measurements with loudspeakers and rooms are described in the<br />
following chapters.<br />
44
19. IMPEDANCE MEASUREMENT<br />
19.1 THEORY<br />
Impedance is the frequency dependent resistance of alternative currents. It consists of the value<br />
Z in Ω and the phase ϕ = ° . The measurement displays both values above the frequency range.<br />
The phase ϕ displays the values of reactive and active resistance which together result in the<br />
value Z. ϕ = 0° consists of resistance only and ϕ = 90° consists of reactive resistance<br />
(reactance) only.<br />
The impedance measurement is needed when developing and testing loudspeakers. It is a value<br />
for the demand on amplifiers from loudspeakers. Smaller Z values demand powerful amplifiers.<br />
The phase ϕ reveals possible instability in amplifiers, which can create oscillation and damage<br />
loudspeakers. The phase angle should not be > + 60° .<br />
The impedance measurement enables the testing of electronic devices, resistors, condensors<br />
and spools.<br />
19.2 ARRANGEMENT<br />
Audio analog out<br />
left<br />
Impedance<br />
Soundcard<br />
MIC<br />
19.3 MEASURING<br />
The impedance measurement can use the LINE or MIC input of the soundcard.<br />
The impedance measurement uses the same graphics as used when amplitude frequency<br />
response is measured.<br />
The measurement range reaches from 20Hz -20kHz. The right-hand axis displays the value Z.<br />
The range is from 0 – 50 Ω .<br />
The change over between amplitude and phase measurements is initiated with the button<br />
after changing over the usual buttons are available. The constant measurement using averages<br />
is not necessary for impedance measurements and is deactivated. When carrying out an<br />
45
impedance measurement the Testbox is connected to the left AUDIO OUT analogue socket of<br />
the CD/DVD player. The jackplug is inserted into the soundcard’s MICROPHONE IN socket. The<br />
switch is set to 1 or 2 and impedance. When working with a CD player, track 1 on the auto test<br />
CD is selected. When using a DVD player the option left loudspeaker is selected on the<br />
surround test DVD’s menu. The loudspeaker is connected to the sockets on the Testbox.<br />
Important :<br />
The loudspeaker is to be connected directly to the Testbox without being connected to an<br />
amplifier. An amplifier may not be connected to the sockets on the Testbox. If doing so the<br />
soundcard or computer may be seriously damaged.<br />
The measurement is started with:<br />
The result is displayed in Ω on the right-hand axis of the diagram created.<br />
The two buttons at the left are for a single measurement.<br />
The two buttons in the middle are for a duration measurement with shows always the last curve.<br />
The two buttons at right are for a duration mean measurement. This measurement is important<br />
for the impedance because errors will be out of the curve.<br />
46
20. PHASE MEASUREMENT<br />
20.1 BASICS<br />
The phase is used when describing sinus shaped processes such as mechanical oscillation,<br />
alternate currents, radio waves and sound waves.<br />
U<br />
α<br />
ωt<br />
U(t) = Us cos (ωt+α)<br />
t Time, U(t) Instantaneous value of voltage, Us peak value (max. Amplitude),<br />
f Frequency, T = 1/f Period duration, ω = 2π f = 2π/T Angular frequency,<br />
α Null phase angle<br />
The phase angle α already appears in the in the basic equation. It is purposefully positioned with<br />
the point of reference TIME 0. With two or more oscillations (waves), as with e.g. acoustic<br />
signals, the phase angle is of absolute importance for measurement description.<br />
U<br />
U1<br />
U2<br />
ϕ<br />
ωt<br />
α<br />
U(t) = Us1 cos(ωt+α) + Us2 cos(ωt+α+ϕ)<br />
The angle ϕ defines how the oscillations (waves) overlap.<br />
47
Examples of how the angle ϕ effects the waves :<br />
ϕ = 180° => blanked out<br />
U<br />
U1<br />
U2<br />
ωt<br />
ϕ<br />
ϕ = 0°, 360° => maximum amplitude<br />
U<br />
U2<br />
U1<br />
ωt<br />
ϕ = 90°, 270° => partly amplified, or also partly blanked out<br />
U<br />
U2<br />
U1<br />
ωt<br />
The phase and loudspeakers<br />
48
Loudspeakers also have to comply with the basics of physics. Amplitude and phase are<br />
essential for a correct description of the sound pressure emitted. The common theory that the<br />
phase can be determined in the frequency response is not true. This only complies to simple<br />
electronic circuits. The complicated transfer function, including duration, inhibits phase<br />
recognition in the amplitude frequency response. A box with an absolutely smooth frequency<br />
response can produce extreme and therefore audible phase jumps.<br />
A common method for detecting the phase relation in loudspeakers is as follows :<br />
To determine the phase relation from the frequency response in the transition between e.g. the<br />
high and middle tones of two single loudspeakers, the crossover network is constructed to<br />
produce the maximum blanking out (extinction). When, after switching the poles of one of the<br />
loudspeakers, the frequency response is well balanced then the phase position is also correct.<br />
The phase values are usually about 180°, 360° or 540° apart and the transient behaviour is bad.<br />
This method is not successful beyond the break frequency.<br />
ϕ<br />
180°<br />
90° A<br />
-90° B f<br />
-180°<br />
The figure shows the phase relation of the low and high pass<br />
A = the determined phase of 180° using the method described above<br />
B = phase angle of 270° . This angle partially erases the sound elements of the middle and high<br />
tones. A switching of poles on the loudspeaker shows the same frequency response, thus the<br />
fault cannot be detected with the usual method. With a phase angle of 90°, 270° the<br />
loudspeakers are too loud and produce an annoying sound quality. In this case the usual<br />
frequency response measurement has no meaning.<br />
Many tests show that a balanced phase frequency response is absolutely necessary for a<br />
natural sound reproduction.<br />
20.2 ELECTRICAL PHASE MEASUREMENT<br />
49
With the electrical phase measurement we can measure for example a loudspeakers<br />
impedance. This measurement is essential for a fault free operation of loudspeakers. Large<br />
phase angles show a capacitive and inductive behaviour of the loudspeaker impedance. The<br />
result is an overloading of the amplifier. The amplifier can also become instable and cause<br />
oscillation. After a system correction has been made available the loudspeaker can be<br />
connected to the clamps of the Testbox. Using the button IMPEDANCE we can switch from<br />
frequency response measuring function to the impedance measuring function and activate<br />
phase measurement function. In phase the option ELECTRIC is selected.<br />
With the phase measurement the quality of soundcard and CD/DVD player are shown. For<br />
frequencies > 5kHz the measurements can be faulty. This is shown by the toward negative<br />
angle descending curvature.<br />
Whilst measuring it is important that there are no other noise sources in the vicinity. Noises can<br />
cause the measurement to be incorrect because the loudspeaker acts like a microphone during<br />
the impedance measurement.<br />
20.3 ACOUSTICAL PHASE MEASUREMENT<br />
The acoustical phase measurement of a loudspeaker can only be carried out in quiet rooms.<br />
This test is more sensitive to disturbances than the frequency response measurement. Strong<br />
reflection in the in which the test is being carried out can also influence results. In small rooms<br />
the distance should not be less than 0.5m.<br />
The measurement should be carried out as a continuous measurement :<br />
The automatical phase calculation is highly complex and faults can occur. This can be easily<br />
recognized as the curvature will appear to be broken up. Next to the phase button there is a<br />
drop down list with a series of adjustment possibilities to support the measurement.<br />
Whilst the continuous measurement is running one of the three ranges are selected.<br />
The correct range has been found when the phase curvature remains the same. When the<br />
curvature is intact in the high amplitude range then a correct result has been attained. When<br />
measuring loudspeakers separately it is only possible to compare the phase behaviour. Phase<br />
differences of 180° cannot always be correctly determined. After the simultaneous measurement<br />
of loudspeakers the results are once again correct. Because distance measurement is not<br />
necessary with ATB PC, every measurement technician gets the same results.<br />
50
21. STEP RESPONSE<br />
21.1 THEORY<br />
The step response shows the amplitude and the phase simultaneously. It is calculated using<br />
both measurements. The first thing done is to calculate the impulse of the sinus oscillation<br />
through a complicated addition, with value and phase. Because the impulse is a mathematical<br />
factor, ideally the amplitude is infinite, it’s image is hardly determinable. For instance the<br />
frequencies are not distinguishable. Therefore the integration of the step response is calculated<br />
with a mathematical function. The image of the step response entails all the important<br />
information about the qualities of the transfer distance.<br />
The ATB PC program contains an analysis function for the step response. Usually all<br />
frequencies within the range of 20 Hz – 20 kHz of the step are displayed. This is especially<br />
difficult by loudspeakers e.g. when testing the cross over between subwoofer and middle/high<br />
tones, it is better to not even starting to show the high tones. Therefore in the ATB PC program<br />
the frequency range for the frequencies displayed by the step response can be adjusted.<br />
Step response of a linear transfer distance<br />
A<br />
t<br />
Step response of the loudspeaker<br />
A<br />
t<br />
51
The signal ascends steeply and falls in correspondence with the e – function. The descent is<br />
caused by the differentiating function of the air.<br />
The picture shows an ideal loudspeaker. The steep ascent of the step response displays a high<br />
top frequency border. The e – function’s corresponding descent shows a linear frequency<br />
characteristic. The lower frequency border can be deducted from the steepness of descent. The<br />
deciding factor in this measurement though is the statement brought about by the phase<br />
relation.<br />
Because the step response only shows ascent and descent this means that all loudspeakers are<br />
on the same acoustic level and are poled identically. The phase is also linear. Average<br />
loudspeakers display many peaks and falls depending on the number of single chassis.<br />
21.2 THE MEASUREMENT<br />
The step response is not a measurement on it’s own but an evaluation of frequency<br />
characteristic and phase.<br />
The window for the display is activated with the button :<br />
The display for the lower and top frequencies are adjusted under the curve. The scale for the x –<br />
axis is in msec.<br />
52
22. MEASURING CAR INTERIORS WITH THE CD<br />
Before testing, the system-correction is to be measured once. The system-correction is for<br />
comparison of the soundcard. Thus any CD/DVD Player can be used.<br />
For comparison, the left audio output of the CD/DVD player is connected (through the<br />
measuring adapter) to the microphone input on the soundcard. The RESOLUTION is set to CD-<br />
Plus. The CD is played left with Signal Plus. First of all the modulation is set with the controller<br />
so that the bar takes up the first half of the scale. After this the system-correction menu called up<br />
and the measurement can begin. If the plot lies within the diagram the menu can be closed with<br />
OK.<br />
After that a test measurement is started with M. When the plot appears as a straight line (only<br />
dropping when above 20kHz ) then the system-correction has been successful.<br />
After opening the system-correction menu the plot can be given a name. The name should entail<br />
the name of the soundcard and CDnormal. The correction curve is saved (with SAVE) and used<br />
for the following measurements. Only when the soundcard or resolution are changed is there a<br />
need for a new system-correction.<br />
22.1 ROOM CORRECTION<br />
In car frequency character : blue = single measurement in Standard position,<br />
red = room correction<br />
Acoustically considered, because of the lack of room within automobiles there is no proper or<br />
steady sound distribution. The interference of the sound waves that result show a different<br />
frequency character for each microphone position when measuring. A test with the standard<br />
position shows interferences but no certain frequency characteristics. Only when a<br />
measurement with multiple microphone positions in head height of the passengers is carried out<br />
can a satisfying frequency characteristic for sound be attained. The ATB Optitest operates by<br />
showing then mean average of the frequency characteristics of multiple microphone positions.<br />
53
22.2 NEAR FIELD MEASUREMENTS<br />
Nearfield measure : blue = Bass, green = Middle, red = roomcorrected Middle- Hightone,<br />
light green = Bass reflex, black = Bass mean average, Middle and Bass reflex<br />
The room correction for the low frequency range cannot be carried out as described. To<br />
suppress room resonance the low frequencies are measured in nearfield. Because of the<br />
nearfield effect during simple measurement the results are falsified, through a super elevation in<br />
the sound pressure curve and a loss of sound in the bass reflex opening. The ATB Optitest<br />
measurement avoids this effect by moving the microphone between woofer and Reflex opening<br />
whilst measuring. Start and end points of the movement are the edges of Bass loudspeaker and<br />
vented opening. This is how the influence of the nearfield effect are avoided. The mean average<br />
of the frequency characteristics measured whilst moving show the real low frequency given. In<br />
the “Combine“ menu the bass and middle-high tone frequencies are put together. The<br />
transitional frequencies and amplitudes can be chosen at will.<br />
54
23. SOUND SYSTEM CALIBRATION USING THE DVD<br />
For a real cinema feeling in your living room, as well as the proper picture, sufficient sound is a<br />
must. For good sound first of all you need good loudspeakers. Sound differences between high<br />
quality DVD players and amplifiers are present but are not as important for attaining the cinema<br />
sound. More important is the proper adjustment of the amplifier and the balance between<br />
loudspeakers and room acoustics. This is only possible with measuring technology. Thanks to<br />
computers and the ATB-PC program it is possible even for the interested layman to measure<br />
and adjust his/her home system.<br />
Before testing, the system-correction is to be measured first.<br />
For comparison, the left audio output of the CD/DVD player is connected (through the<br />
measuring adapter) to the microphone input on the soundcard. The RESOLUTION is put to DVD<br />
DD. After starting the DVD player, with the surround single signal left, the modulation next to the<br />
controller is adjusted. The controller is to be adjusted so that the bar takes up the first half of the<br />
scale. After this the system-correction menu is opened and the measurement can begin. If the<br />
plot lies within the diagram the menu can be closed with OK. After that a test measurement is<br />
started with M. When the plot appears as a straight line (only dropping when above 20kHz ) then<br />
the system-correction has been successful .<br />
After opening the system-correction menu the plot can be given a name. The name should entail<br />
the name of the soundcard and DVD DD. The correction curve is saved (with SAVE) and used<br />
for the following measurements. Only when the soundcard or resolution are changed is there a<br />
need for a new system-correction.<br />
23.1 AMPLIFIER<br />
To operate the amplifier (Receiver) it is connected to the television.<br />
In the amplifier menu (Receivers) the setting SPEAKER SETTING is to be actuated. All<br />
SPEAKER are to be set to LARGE and the SUBWOOFER to ON.<br />
Further adjustments are, in CHANNEL BALANCE the volume for all loudspeakers is to be set at<br />
0dB.<br />
In the CHANNEL DELAYS menu the different distances are adjusted. These adjustments are<br />
important because the soundwaves spread through the air with the speed of sound. Because<br />
the sound from a surround system comes out of the speakers at the same time but is to reach<br />
the listener at the same time, CHANNEL DELAY is adjusted to compensate. With home<br />
systems the surround loudspeakers are nearer to the listener. This is why the tone is delayed,<br />
to make sure that all tones are heard at the same time as the front loudspeakers. To adjust the<br />
difference, the distance of the front loudspeakers – surround loudspeakers is ascertained and<br />
noted in the menu. In some menus the entries are to made in msec. The msec are calculated<br />
with the formula 1m = 2.94msec. The values do not have to be 100 % perfect. Important is that<br />
the tone is first heard from the front loudspeakers. Some manufacturers recommend for small<br />
rooms 10ms, middle 15ms and 20ms for large rooms. The centre is delayed with about 2-3ms if<br />
possible.<br />
55
23.2 MICROPHONE<br />
The microphone is connected to the INPUT slot of the soundcard.<br />
Microphone positioning:<br />
First of all the seating places for the audience are decided. The microphone is positioned on the<br />
back of the sofa or armchair, so that the head of the microphone is in the same position as the<br />
head of the spectator. If two different seating places are favoured then the microphone is placed<br />
between the two places.<br />
23.3 DVD Player<br />
Connecting the DVD player<br />
The DVD player is, with it’s coaxial cinch or optical digital audio output, to be connected to the<br />
amplifier (receiver). The video signal is also connected to the amplifier.<br />
Starting the Surround-Test DVD<br />
The DVD is started and the single measurements are chosen in the menu.<br />
23.4 SINGLE MEASUREMENTS<br />
Front loudspeakers FL, FR<br />
The measurements are carried out as single measurements and are started with the front<br />
loudspeaker FL. The position of the loudspeaker is to be tested with this measurement. The test<br />
is started with the measuring program M D. The volume for the PPN is to enlarged until the plot<br />
is in the upper half of the diagram.<br />
The following measurements were done in Analog.on Studio. The loudspeakers used are<br />
reliable, favourable in price and quality.<br />
The blue curve is the FL loudspeaker, the red curve is the FR loudspeaker with large and<br />
the green curve with small distance from the corner of the room.<br />
The position of the loudspeaker is now sought for where the frequency characteristics show<br />
no great elevations or extreme falls. A fall in the high tone range is compensated by<br />
56
positioning the loudspeaker obliquely in the direction of the seating position. Elevation or<br />
drops in the Middle tone range can be compensated through a greater distance to the<br />
bordering walls. A super elevation in the low frequency range shows a corner position.<br />
Enlarging the distance to the back lowers the elevation. It is not yet possible to avoid an<br />
elevation in the low frequency range within a living room (using the room size as a function).<br />
Because the ear does not react critically to bass, but even finds it pleasant, a compromise<br />
between a minimal bass accent and room comfort is certainly possible. After measuring FL,<br />
FR is to be placed symmetrically to FL. The symmetrical positioning is more important than<br />
small irregularities in the frequency character. The measurements are started with M+D.<br />
Differences in low frequency playback between the left and right loudspeakers are not<br />
important because the audience hears the sum of both loudspeakers. Large drops or<br />
elevations in the frequency characteristics of the FR loudspeaker make it necessary to<br />
reposition the loudspeaker. FL is positioned symmetrically to the new position of FR and<br />
then measured. If FL displays large breaks in linearity then both loudspeakers should be<br />
positioned between both optimal positions.<br />
Small loudspeakers should be positioned so that the sound pressure curve runs steadily<br />
above 100 Hz.<br />
Center<br />
The center is for voice playback. Therefore the center has to have a steady frequency<br />
characteristic. The high tone playback should not be emphasized, this making the voices<br />
sound too hard. The low frequency range may drop below 100 Hz, being transmitted from<br />
either the Subwoofer or the FL, FR loudspeakers.<br />
The plots show the frequency characteristics of the centre with a small distance from the<br />
room floor (blue curve). The red curve shows an increased distance of 20 cm.<br />
When positioning the centre it is important to consider the distance to the floor. With the M+D<br />
measurement the Centre is measured with different distances to the floor. The distance with the<br />
steadiest frequency characteristics should be chosen.<br />
57
Surround Loudspeaker<br />
Special rules are needed for the positioning of surround sound loudspeakers. The Home<br />
Cinema owner should be aware of the fact that films are not made for the living room but for the<br />
cinema. Just as the picture format is not suitable for a television screen so has the sound been<br />
mixed for the cinema. The surround sound in a cinema is transmitted with up to 24 small<br />
loudspeakers. The loudspeakers are positioned on the walls and the back of the hall. When<br />
positioning it is important that each spectator has a loudspeaker in the near so that a direct<br />
sound portion reaches him/her. The rest of the loudspeakers create a diffused sound. These<br />
conditions should be reproduced in the living room. Because the room does not allow more than<br />
two surround loudspeakers, the loudspeakers should create a direct and diffused sound. This is<br />
why the usual direct sound radiating loudspeakers are not suitable. Even the earlier used THX<br />
Dipoles with diffused sound radiation are not really ideal. The frequency characteristics of the<br />
surround loudspeakers should lie between 100Hz and 10k’Hz. The border frequency of 100Hz<br />
allows that the low frequencies (that radiate to the front) can be found at the back. The high<br />
frequency range should not be emphasized. In cinemas the high frequency range above 10kHz<br />
is limited to stop the singling out of each loud speaker. For measuring the microphone is turned<br />
in the direction of the loudspeaker. M+D is used to carry out the measurement.<br />
The picture shows both S loudspeakers. The blue one is in a corner.<br />
The loudspeaker position is changed until the rough inconsistencies are gone. To measure the<br />
volume the microphone is put into it’s old position.<br />
Subwoofer<br />
The Subwoofer takes over the low frequency range. The steady transmission of the lower<br />
frequencies in living rooms proves to be a problem because the size of the rooms are similar to<br />
the wavelengths of the sounds. Therefore the soundfield in the room is not steady and the<br />
sound pressure owns Maxima and Minima. This means that the lower frequencies are either<br />
louder or quieter in different positions in the room. The Subwoofer must be placed so that no<br />
minimum occurs at the seating position.<br />
58
The picture shows plots for the SW in different positions. The difference to each position<br />
being 20cm. The red curve is the FL loudspeaker.<br />
Simultaneously it is an advantage to place the subwoofer between the FL and FR loudspeakers.<br />
Through multiple tests with M+ and repositioning of the Subwoofer it is possible to find the ideal<br />
position quite quickly. This is the position where the measured plot is at it’s highest.<br />
Volume adjustment<br />
The loudspeakers of the surround system must have the same volume. The loudspeakers are<br />
measured with single signals and the adjustments are made in the amplifiers menu under<br />
CHANNEL BALANCE. For the loudspeaker FL 0dB is chosen and the sound pressure is<br />
measured with M.<br />
The single measurements of the loudspeakers shown in one diagram<br />
light green = SW, red = C, green = FR, blue = FL, brown = SR, light blue = SL<br />
59
The volume complies to the height of the sound pressure curve. After this FR is measured with<br />
M+ and the adjustments in the amplifier menu are changed so that the plots lie over each other.<br />
The same is done with the centre and surround sound loudspeakers. The room influence should<br />
be considered when adjusting the volume of the Subwoofer. Although an elevation is measured<br />
seating position it is still possible to attain a steady sound when the mean average of the Bass in<br />
the room is steady. The correct measurement is carried out by comparing the Bass curve with<br />
the curves of the large (Bass corrected) FL, FR loudspeakers. The SW curve should have the<br />
Amplitude of the large loudspeakers. The smaller FL, FR loudspeakers are to be given a ca. 6dB<br />
louder Bass, because it has to take over the low frequency range of the FL and FR<br />
loudspeakers.<br />
23.5 CUMULATIVE SIGNALS<br />
The measurement of the cumulative signals from FL and FR shows the collaboration of the<br />
loudspeakers in the room. Seen measurement technically there are special problems to be<br />
conquered. Because the soundwaves of the loudspeakers overlay each other (having the same<br />
signal) interferences are created. Drops in the frequency characteristics appear, depending on<br />
the microphone position. These interferences are audible when moving the head (the sound of<br />
the noise changes). To be able to measure the correct sound pressure curve it is necessary to<br />
move the microphone (held in the hand) within a perimeter of 50cm around the seating position.<br />
This curve is a statement for the sound. The measurement is carried out with M mittel .<br />
Cumulative signals for the front loudspeakers<br />
The movement of the microphone causes a drop when reaching the higher frequencies. This<br />
drop should be steady. The measurement FL+C+FR is important here.<br />
60
The Equalizer<br />
Some instruments have an equalizer to adjust the loudspeakers to the room. Cumulative signals<br />
prove best for adjusting equalizers because the acoustic properties of the room are shown. To<br />
adjust the equalizer properly a few rules should be followed. The problem with equalizers is that<br />
when linearising the frequency characteristics, the Impulse- and phase behaviour changes<br />
simultaneously. The time allocations of the signals are changed. When the equalizer is used for<br />
the FL and FR loudspeakers the adjustments should be identical for both loudspeakers. To<br />
adjust the low frequency ranges the cumulative+bass signals are used.<br />
23.6 CUMULATIVE SIGNALS AND BASS<br />
The Subwoofer<br />
The bass of a surround system is transmitted by the subwoofer or the large loudspeakers FL<br />
and FR. It is contained in the Dolby Digital Signal as an independent channel. In Dolby Digital<br />
the bass is defined as the lower frequencies < 100Hz. Because the recording of the bass with<br />
the microphones for FL, FR, C, SL and SR (simplified) are the same, it is separated and fed into<br />
the SUB channel. During playback the sound source for the single tone cannot be located. This<br />
is why only one loudspeaker (the subwoofer) is necessary for playback. This is a simplified<br />
observation and does not take into account that the cinema sound does not just consist of one<br />
signal with one frequency. The sound consists of many frequencies with independent time<br />
allocations (the Phase). This is why it cannot be concluded from this simple observation that a<br />
subwoofer can be placed in many different positions in a room. The following measurements will<br />
prove this. The subwoofer cannot be seen as a single instrument in a system because the<br />
frequency range around the splitting frequency 94Hz from Subwoofer and Front/Surround<br />
loudspeakers is transmitted simultaneously. When soundwaves are overlayed the phase<br />
position of the individual waves (in conjunction with one another) are decisive for the sound<br />
pressure. That is why Subwoofer have a phase switch or even a controller. The correct<br />
adjustment of the amplifier and subwoofer are almost impossible without measuring technology.<br />
The measurement signals must come from the DVD to correctly compensate for the properties<br />
and adjustments of the Dolby Digital Decoder.<br />
Measurement of the cumulative signals of the front loudspeaker<br />
The subwoofer is turned off for this measurement, the amplifier menu remains active. The sound<br />
pressure is measured with the cumulative signal FL+C+FR+SW with M Mitteln.<br />
Because for this measurement only the lower frequencies are considered. It is not necessary to<br />
move the microphone as in the previous measurement.<br />
Measuring the Subwoofer<br />
The following measurement is carried out with the single signal SW. The measurement is started<br />
with M+D.<br />
61
The picture shows the plots for the front loudspeaker and SW<br />
Whilst the test is running the controller of the subwoofer (for the splitting frequency) is to be<br />
operated until the plot for the front loudspeaker and the bass plot are symmetrically mirrored<br />
with one another. The steepness of the bass curve can be adjusted with the controller or switch<br />
for the Filter steepness to be adapted to the steepness of the front loudspeaker curve. The point<br />
of intersection of both plots should be –3dB in reference to the front loudspeakers curve. The<br />
bass curve can be 4db higher than the front loudspeakers curve.<br />
Measuring the cumulative+bass signals<br />
Taken from the adjustment work described before it is seen that the cumulative and the Bass<br />
curves (measured separately) fit together. Now all we have to do is test if the soundwaves<br />
overlap. This is determined with the phase behaviour of the single loudspeakers. By constant<br />
phase position the sound waves add up. With a phase difference of 180° the sound waves are<br />
cancelled out and a drop in the frequency characteristic curve is displayed. The phase positions<br />
can be adjusted with the phase controller. The measurement is started with the FL+C+FR+SW<br />
Signal and M+D .<br />
62
The plots show the cooperation of front loudspeakers and subwoofer and the influence of<br />
the phase controller. Light green, green and brown show the influence of the phase<br />
controller. Die brown curve is the adjustment without deletion in the low frequency range.<br />
The inconsistency of the middle and high tone ranges are brought forth through persons<br />
moving in the room.<br />
Whilst measuring the phase controller is to operated until there is no drop to be seen in the<br />
curve. For a subwoofer with phase switch is he adjustment with the smallest drop to be applied.<br />
If there is a drop in both adjustments then the subwoofer needs to be repositioned.<br />
23.7 THE AUDIO TEST<br />
With the audio test the quality of a surround sound system can be simply tested. The signal for<br />
the audio test is a noise circling the room. After the initial measurement it can also serve the<br />
fine adjustment of the system in the amplifiers menu CHANNEL BALANCE. With an optimal<br />
system the noise moves freely within the room without the sound source being detected. At the<br />
same time the noise should sound steady. When fine adjustment is to be carried out, first of all<br />
the centre volume is adjusted. This can be adjusted within a range of 1-3 dB. If the centre is to<br />
be heard with the front running signal then the volume is to be lowered. If the noise is too quiet<br />
in the middle then the centre volume must be raised. After this the same procedure is carried out<br />
with the surround loudspeakers. In opposite to the FL and FR loudspeakers they may have<br />
different volumes.<br />
The second signal runs diagonally through the room. This signal puts the highest demands on<br />
the system. It serves to test the systems of recording studios.<br />
63
24. CALIBRATING THE HIFI STEREO SYSTEM<br />
24.1 MICROPHONE<br />
This chapter is for the loudspeaker developers out there! The ATB PC program offers the<br />
function continuous measurement with averages, a tool that no developer can do without. When<br />
using a DVD player the measurement signal used is the PCM signal on the surround test DVD. If<br />
a CD player is the signal source then the CD plus signal is used on the auto test CD.<br />
The usual frequency characteristic measurements are carried out with a predefined microphone<br />
position on a certain axis and with a predefined angle. This enables the developer to optimise<br />
the frequency characteristic for this position. To say that this diagram (results) is a lie would be<br />
too hard a statement but the truth is that loudspeakers with almost identical frequency<br />
characteristics sound completely different with this method. A more satisfactory result is attained<br />
when the reflected energy is measured. This corresponds to the audio impression heard with<br />
the ear because indirect sound plays a larger role in living rooms. These sound waves that are<br />
reflected from floor, walls and ceiling must have a volume that is proportional in relation to the<br />
music played. The professional journal “HiFi Vision” has not so long ago completed a series of<br />
tests with a rotating microphone and ascertained very satisfying results. Thanks to the<br />
measuring program ATB PC the true frequency characteristic can be simply determined using a<br />
personal computer. The continuous measurement function using averages is the key to correct<br />
results. Whilst the measurement is being carried out the microphone is moved slowly, with a<br />
distance of 60 cm from source, in a circle with a radius of 60 cm. Practice shows that the<br />
frequency characteristics are independent from this type of movement and thus enables the<br />
determination of a frequency characteristic error.<br />
The frequency characteristic of a loudspeaker measured with a predefined axis red and it’s<br />
proper frequency characteristic green.<br />
The separate curvatures of a well constructed loudspeaker will only differ in the drop when<br />
coming towards the high tones, as depicted. A correct measurement is also well balanced. The<br />
drop in the high tone region is also an advantage in living quarters because the near walls<br />
amplify high tones anyway.<br />
24.2 POSITIONING LOUDSPEAKERS AND THE SEATING POSITION<br />
64
Chapter 17.4 has already dealt with the positioning of the loudspeakers. A stereo sound system<br />
demands a higher sound quality and spacial balance.<br />
First of all the relationship between the distance to the walls and loudspeakers should be<br />
investigated.<br />
The curvatures display the frequency characteristics of a loudspeaker in relation to the distance<br />
from a lateral (side) wall. Orange has a distance of 8 cm from the wall, the jagged curvature is<br />
easy to recognize. The peaks and falls are caused by the interferences created by the sound<br />
reflected from the wall. With blue the distance has been enlarged by 16 cm. The curve has<br />
become a little more balanced out. The difference between green 24 cm and red 32 cm is not<br />
very large at all. This distance should be chosen for this loudspeaker. When the distance<br />
becomes greater a large ascent in the higher tones can be detected, this proving that the allround<br />
emitting spherical high tones are not the ideal answer for living quarters. The properly<br />
measured frequency responses of the last chapter with their high tone drop prove to be ideal for<br />
living quarters.<br />
If there is simply not enough room then it is possible to reduce sound reflection with wall carpets<br />
or curtains.<br />
The distance from the back wall is of utmost importance for the middle tone range whilst<br />
choosing the seating position. A too smaller distance causes the middle frequency range to<br />
become jagged, this can only compensated through a larger distance to the wall or acoustic<br />
mats or wall carpets.<br />
65
The figure displays the influence of the back wall in relation to the seating position. The waves in<br />
the blue curve are caused by the interference of direct sound and reflected sound from the back<br />
wall. The sound reflected from the wall is delayed and creates an interfering reverberation. The<br />
red curve displays the results when acoustic mats are placed on the back wall, the sound<br />
becomes more satisfying.<br />
24.3 ROOM ACOUSTIC MEASUREMENT<br />
66
Room acoustic describes the sound waves in a room. When a sound wave is created in a room<br />
then speckles are formed. Speckles are points on a sound wave that have either the greatest or<br />
smallest amount of energy. This is especially important when working in the low frequency<br />
ranges. Everybody has had the experience that in a room there are certain areas where the<br />
deeper tones can only be heard very weakly and in other positions very loud.<br />
The figure shows the frequency responses in different positions in a room. The red and brown<br />
curves are speckles whilst the green curve reveals an optimal position.<br />
These measurements display the results attained whilst the loudspeaker was between the front<br />
loudspeakers, the results display how important the positioning of the subwoofer is.<br />
Further measurements are taken with specialized room acoustic programs, these mainly<br />
measuring the reverberation period. This value is only of importance to the acoustic engineer<br />
because the reverberation period of rooms can only be corrected with constructive steps.<br />
The ATB PC program enables thoroughly satisfying results for the HiFi stereo owner when<br />
determining loudspeaker and seating positions. The optimum position is achieved when the<br />
frequency characteristics of loudspeaker and seating position are well balanced. The room<br />
acoustic and loudspeaker are both measured when determining the seating position.<br />
67
25. Surround-Test DVD<br />
The test signals<br />
The curves shown are from test signals played back from a DVD Player and measured with ATB<br />
precision USB.<br />
The Signals:<br />
Blue above = single signals FL, C, FR, SL, SR<br />
Light green = single signal SW,<br />
with Surround amplifier output +10dB<br />
Brown = cumulative signals FL+FR, SL+SR<br />
Green = cumulative signals FL+C+FR<br />
Blue bottom = cumulative signals FL+C+FR+SL+SR<br />
Red = cumulative signals +Bass FL, C, FR, SL, SR<br />
Black = cumulative signals +Bass FL+FR, SL+SR<br />
Blue middle = cumulative signals +Bass FL+C+FR<br />
Orange = cumulative signals +Bass FL+C+FR+SL+SR<br />
Brown = cumulative signals +Bass SW<br />
The not quite smooth frequency characteristics are created by the high compressionrates of the<br />
cumulative signals.<br />
The PCM signal corresponds to the single signals with a border frequency of 22kHz.<br />
The audio signals consist of round and diagonally moving noises in the room.<br />
68
26. DIGITAL MEASUREMENTS<br />
The Optitest measurement is also for the frequency characteristic measurement of digital audio<br />
instruments like DVD Players, Digital switches, Digital loudspeakers and equalisers. The signal<br />
source serves the digital output of DVD Player or Computer. The correlation function of the<br />
program needs no time coordination of e. g . recording and playback, so that instruments with<br />
large delay between in- and output signal are able to be tested.<br />
The PCM Signal with 48kHZ is used for testing. Therefore the measurements are only suitable<br />
for studio instruments.<br />
When measuring the digital input on the soundcard is chosen.<br />
In opposition to the analogue signal the PCM Signal can also played digitally from a computer.<br />
69
27. AUXILLIARY INSTRUMENTS, MICROPHONE AND ADAPTER<br />
AMPLIFIER<br />
A stable amplifier is necessary for loudspeaker measurement. This should also possess enough<br />
bandwidth.<br />
MICROPHONE<br />
The microphone should possess a good linearity, have a high bandwidth, on the other hand it<br />
shouldn’t be too sensitive. Microphones who’s frequency characteristics need to be<br />
compensated are not suitable, because their impulse behaviour is not enough.<br />
Delivered with the ATB PC measuring system :<br />
Program CD Rom<br />
Test-DVD<br />
Test microphone<br />
Adapter cable for balancing<br />
Handbook as PDF file<br />
70