Burnout as predictor of aggressivity among police officers
Burnout as predictor of aggressivity among police officers
Burnout as predictor of aggressivity among police officers

Create successful ePaper yourself
Turn your PDF publications into a flip-book with our unique Google optimized e-Paper software.
<strong>Burnout</strong> <strong>as</strong> <strong>predictor</strong> <strong>of</strong> <strong>aggressivity</strong> <strong>among</strong> <strong>police</strong> <strong>of</strong>ficers<br />
divided into four subscales: physical aggression, verbal aggression, anger, and<br />
hostility, each scored on a 5-point frequency rating scale ranging from 1 (‘extremely<br />
uncharacteristic <strong>of</strong> me’) to 5 (‘extremely characteristic <strong>of</strong> me’), including also a total<br />
score for overall <strong>aggressivity</strong>. The physical aggression scale had 8 items (e.g. ‘Given<br />
enough provocation, I may hit another person’), the verbal aggression scale had 5<br />
items (e.g. ‘When people annoy me, I may tell them what I think <strong>of</strong> them’), the anger<br />
scale had 7 items (e.g. ‘When frustrated, I let my irritation show’), and the hostility<br />
scale had 9 items (e.g. ‘I sometimes feel that people are laughing at me behind my<br />
back’). During the development <strong>of</strong> the questionnaire it shows correlations between<br />
its dimensions and personality traits such <strong>as</strong> impulsivity, competitiveness and<br />
emotionality, and also between self-reports and observations <strong>of</strong> knowledgeable<br />
informants (Buss & Perry, 1992). Thus, it can be used to identify proneness to<br />
<strong>aggressivity</strong> (Buss & Perry, 1992) or to operationalise aggression (Lee & Egan,<br />
2013).<br />
3. Results<br />
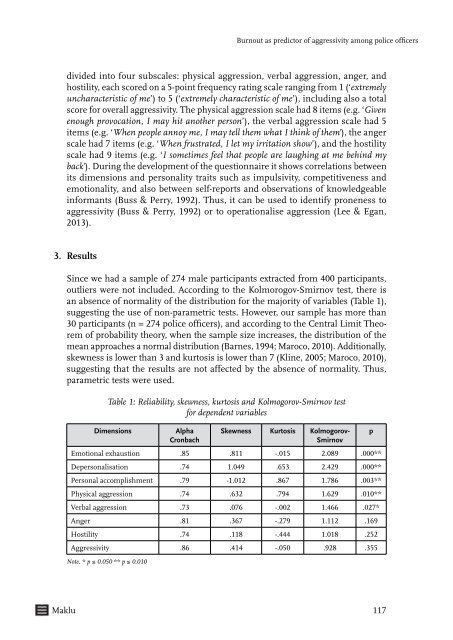
Since we had a sample <strong>of</strong> 274 male participants extracted from 400 participants,<br />
outliers were not included. According to the Kolmorogov-Smirnov test, there is<br />
an absence <strong>of</strong> normality <strong>of</strong> the distribution for the majority <strong>of</strong> variables (Table 1),<br />
suggesting the use <strong>of</strong> non-parametric tests. However, our sample h<strong>as</strong> more than<br />
30 participants (n = 274 <strong>police</strong> <strong>of</strong>ficers), and according to the Central Limit Theorem<br />
<strong>of</strong> probability theory, when the sample size incre<strong>as</strong>es, the distribution <strong>of</strong> the<br />
mean approaches a normal distribution (Barnes, 1994; Maroco, 2010). Additionally,<br />
skewness is lower than 3 and kurtosis is lower than 7 (Kline, 2005; Maroco, 2010),<br />
suggesting that the results are not affected by the absence <strong>of</strong> normality. Thus,<br />
parametric tests were used.<br />
Table 1: Reliability, skewness, kurtosis and Kolmogorov-Smirnov test<br />
for dependent variables<br />
Dimensions<br />
Alpha<br />
Cronbach<br />
Skewness Kurtosis Kolmogorov-<br />
Smirnov<br />
Emotional exhaustion .85 .811 -.015 2.089 .000**<br />
Depersonalisation .74 1.049 .653 2.429 .000**<br />
Personal accomplishment .79 -1.012 .867 1.786 .003**<br />
Physical aggression .74 .632 .794 1.629 .010**<br />
Verbal aggression .73 .076 -.002 1.466 .027*<br />
Anger .81 .367 -.279 1.112 .169<br />
Hostility .74 .118 -.444 1.018 .252<br />
Aggressivity .86 .414 -.050 .928 .355<br />
Note. * p ≤ 0.050 ** p ≤ 0.010<br />
p<br />
Maklu 117