Annual Report (in PDF) - Hongkong Land
Annual Report (in PDF) - Hongkong Land
Annual Report (in PDF) - Hongkong Land

Create successful ePaper yourself
Turn your PDF publications into a flip-book with our unique Google optimized e-Paper software.
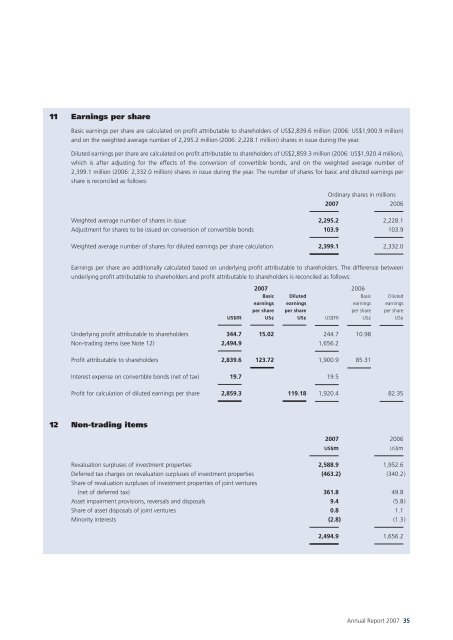
11 Earn<strong>in</strong>gs per share<br />
Basic earn<strong>in</strong>gs per share are calculated on profit attributable to shareholders of US$2,839.6 million (2006: US$1,900.9 million)<br />
and on the weighted average number of 2,295.2 million (2006: 2,228.1 million) shares <strong>in</strong> issue dur<strong>in</strong>g the year.<br />
Diluted earn<strong>in</strong>gs per share are calculated on profit attributable to shareholders of US$2,859.3 million (2006: US$1,920.4 million),<br />
which is after adjust<strong>in</strong>g for the effects of the conversion of convertible bonds, and on the weighted average number of<br />
2,399.1 million (2006: 2,332.0 million) shares <strong>in</strong> issue dur<strong>in</strong>g the year. The number of shares for basic and diluted earn<strong>in</strong>gs per<br />
share is reconciled as follows:<br />
Ord<strong>in</strong>ary shares <strong>in</strong> millions<br />
2007 2006<br />
Weighted average number of shares <strong>in</strong> issue 2,295.2 2,228.1<br />
Adjustment for shares to be issued on conversion of convertible bonds 103.9 103.9<br />
Weighted average number of shares for diluted earn<strong>in</strong>gs per share calculation 2,399.1 2,332.0<br />
Earn<strong>in</strong>gs per share are additionally calculated based on underly<strong>in</strong>g profit attributable to shareholders. The difference between<br />
underly<strong>in</strong>g profit attributable to shareholders and profit attributable to shareholders is reconciled as follows:<br />
2007 2006<br />
Basic Diluted Basic Diluted<br />
earn<strong>in</strong>gs earn<strong>in</strong>gs earn<strong>in</strong>gs earn<strong>in</strong>gs<br />
per share per share per share per share<br />
US$m US¢ US¢ US$m US¢ US¢<br />
Underly<strong>in</strong>g profit attributable to shareholders 344.7 15.02 244.7 10.98<br />
Non-trad<strong>in</strong>g items (see Note 12) 2,494.9 1,656.2<br />
Profit attributable to shareholders 2,839.6 123.72 1,900.9 85.31<br />
Interest expense on convertible bonds (net of tax) 19.7 19.5<br />
Profit for calculation of diluted earn<strong>in</strong>gs per share 2,859.3 119.18 1,920.4 82.35<br />
12 Non-trad<strong>in</strong>g items<br />
2007 2006<br />
US$m<br />
US$m<br />
Revaluation surpluses of <strong>in</strong>vestment properties 2,588.9 1,952.6<br />
Deferred tax charges on revaluation surpluses of <strong>in</strong>vestment properties (463.2) (340.2)<br />
Share of revaluation surpluses of <strong>in</strong>vestment properties of jo<strong>in</strong>t ventures<br />
(net of deferred tax) 361.8 49.8<br />
Asset impairment provisions, reversals and disposals 9.4 (5.8)<br />
Share of asset disposals of jo<strong>in</strong>t ventures 0.8 1.1<br />
M<strong>in</strong>ority <strong>in</strong>terests (2.8) (1.3)<br />
2,494.9 1,656.2<br />
<strong>Annual</strong> <strong>Report</strong> 2007 35