. Input Indicators - Health Systems Trust
. Input Indicators - Health Systems Trust
. Input Indicators - Health Systems Trust

Create successful ePaper yourself
Turn your PDF publications into a flip-book with our unique Google optimized e-Paper software.
Section A: Indicator Comparisons by District<br />
2. <strong>Input</strong> <strong>Indicators</strong><br />
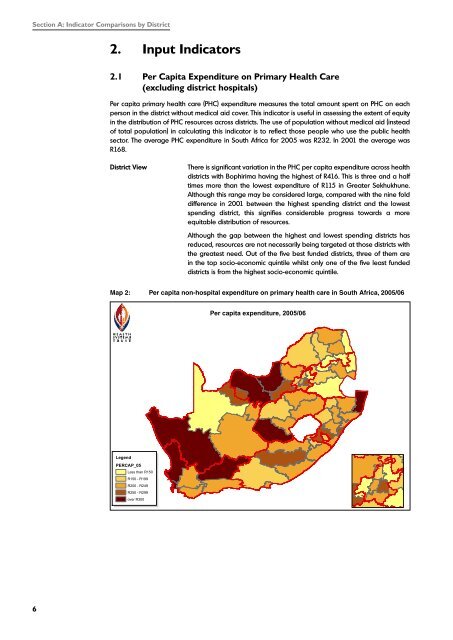
2.1 Per Capita Expenditure on Primary <strong>Health</strong> Care<br />
(excluding district hospitals)<br />
Per capita primary health care (PHC) expenditure measures the total amount spent on PHC on each<br />
person in the district without medical aid cover. This indicator is useful in assessing the extent of equity<br />
in the distribution of PHC resources across districts. The use of population without medical aid (instead<br />
of total population) in calculating this indicator is to reflect those people who use the public health<br />
sector. The average PHC expenditure in South Africa for 2005 was R232. In 2001 the average was<br />
R168.<br />
District View<br />
There is significant variation in the PHC per capita expenditure across health<br />
districts with Bophirima having the highest of R416. This is three and a half<br />
times more than the lowest expenditure of R115 in Greater Sekhukhune.<br />
Although this range may be considered large, compared with the nine fold<br />
difference in 2001 between the highest spending district and the lowest<br />
spending district, this signifies considerable progress towards a more<br />
equitable distribution of resources.<br />
Although the gap between the highest and lowest spending districts has<br />
reduced, resources are not necessarily being targeted at those districts with<br />
the greatest need. Out of the five best funded districts, three of them are<br />
in the top socio-economic quintile whilst only one of the five least funded<br />
districts is from the highest socio-economic quintile.<br />
Map 2: Per capita non-hospital expenditure on primary health care in South Africa, 2005/06<br />
Per capita expenditure, 2005/06<br />
Legend<br />
PERCAP_05<br />
Less than R150<br />
R150 - R199<br />
R200 - R249<br />
R250 - R299<br />
over R300
Section A: Indicator Comparisons by District<br />
Figure 5: Per capita non-hospital PHC expenditure by district, 2005/06<br />
Per capita expenditure, 2005/06<br />
South Africa<br />
Bophirima<br />
Namakwa<br />
Xhariep<br />
City of Cape Town<br />
Central Karoo<br />
Umkhanyakude<br />
West Coast<br />
Central<br />
Sisonke<br />
Ekurhuleni<br />
eThekwini<br />
Southern<br />
Kgalagadi<br />
Chris Hani<br />
City of Johannesburg<br />
Eden<br />
Amathole<br />
Uthungulu<br />
Pixley ka Seme<br />
Vhembe<br />
Motheo<br />
Thabo Mofutsanyane<br />
Mopani<br />
Ugu<br />
Sedibeng<br />
Bojanala<br />
Zululand<br />
UMgungundlovu<br />
Umzinyathi<br />
Ehlanzeni<br />
iLembe<br />
O.R. Tambo<br />
Fezile Dabi<br />
Cape Winelands<br />
Ukhahlamba<br />
Frances Baard<br />
Overberg<br />
Nelson Mandela Bay<br />
City of Tshwane<br />
Cacadu<br />
Uthukela<br />
Alfred Nzo<br />
Lejweleputswa<br />
Capricorn<br />
Waterberg<br />
Nkangala<br />
Amajuba<br />
West Rand<br />
Bohlabela<br />
Gert Sibande<br />
Siyanda<br />
Metsweding<br />
Greater Sekhukhune<br />
EC<br />
FS<br />
GP<br />
KZN<br />
LP<br />
MP<br />
NC<br />
NW<br />
WC<br />
SA<br />
0 50 100 150 200 250 300 350 400 450<br />
Rand<br />
percap_2005 Page 1
Umzinyathi<br />
NC<br />
O.R. Tambo<br />
NW<br />
Section A: Indicator Comparisons by<br />
Ukhahlamba<br />
District<br />
WC<br />
Alfred Nzo<br />
SA<br />
Bohlabela<br />
Metro Greater View Sekhukhune The average per capita expenditure in metropolitan districts is R264, about<br />
15% higher than the national average with Nelson Mandela and Tshwane<br />
0 50 100 150 200 250 300 350 400 450 500<br />
below the national average. Cape Town has the highest per capita<br />
expenditure of R341, while<br />
Rand<br />
Tshwane has the lowest at R199.<br />
Figure 6: Per capita non-hospital PHC expenditure in the metro districts, 2005/06<br />
Per capita expenditure, 2005/06<br />
South Africa<br />
Metro average<br />
City of Cape Town<br />
Ekurhuleni<br />
eThekwini<br />
City of Johannesburg<br />
Nelson Mandela Bay Metro<br />
City of Tshwane<br />
0 100 200 300 400 500<br />
Rand<br />
EC<br />
FS<br />
GP<br />
KZN<br />
LP<br />
MP<br />
NC<br />
NW<br />
WC<br />
SA<br />
Rural Nodes<br />
As shown in Figure 7, the average per capita PHC expenditure in rural nodes<br />
is slightly below the national average. Most of these districts are clustered<br />
around the average, but per capita expenditure in Bohlabela (R145) and<br />
Greater Sekhukhune (R115) are significantly lower than the rest. Considering<br />
that these districts have been identified for targeted development, it is<br />
surprising that they are both in the lowest 5 districts overall. In particular,<br />
Greater Sekhukhune, which is one of the most deprived districts in SA, spent<br />
the lowest amount of money per capita on PHC of any district in SA. This is<br />
not in line with the principle of equity, one of the principles that underpins<br />
the district health system in SA.<br />
On the other hand Central Karoo and Umkhanyakude have impressive<br />
expenditure on PHC and are ranked 5 th and 6 th in SA respectively in terms<br />
of per capita expenditure.<br />
Figure 7: Per capita PHC expenditure in the rural nodes, 2005/06<br />
Per capita expenditure, 2005/06<br />
percap_2005 Page 2<br />
South Africa<br />
ISRDP average<br />
Central Karoo<br />
Umkhanyakude<br />
Kgalagadi<br />
Chris Hani<br />
Thabo Mofutsanyane<br />
Ugu<br />
Zululand<br />
Umzinyathi<br />
O.R. Tambo<br />
Ukhahlamba<br />
Alfred Nzo<br />
Bohlabela<br />
Greater Sekhukhune<br />
EC<br />
FS<br />
GP<br />
KZN<br />
LP<br />
MP<br />
NC<br />
NW<br />
WC<br />
SA<br />
0 50 100 150 200 250 300 350 400 450 500<br />
Rand<br />
<br />
Per capita expenditure, 2005/06
Section A: Indicator Comparisons by District<br />
Change in per capita PHC expenditure from 2001 to 2005<br />
Figure 8 illustrates the changes in non-hospital PHC expenditure per capita from 2001 to 2005. Per<br />
capita expenditure increased overall by R64. This represents an average annual increase of 8%, which<br />
is higher than inflation and higher than the health budget is increasing overall, and this shows some<br />
degree of prioritisation of PHC.<br />
District View<br />
Xhariep had the highest increase of R211 whilst Ekurhuleni had a reduction of<br />
R119. All but eight districts showed increases. A total of 33 districts increased<br />
their per capita PHC expenditure by more than the national average.<br />
The eight least funded districts in 2001 are among the districts that increased<br />
their per capita expenditure by R90 or more. Also, six of the districts that<br />
experienced a reduction in per capita expenditure were among the ten<br />
districts with the highest per capita expenditure in 2001. Three of these are<br />
the metropolitan districts of Johanesburg, Cape Town and Ekurhuleni. This is<br />
a clear indication of progress towards a more uniform and equitable PHC<br />
expenditure across districts.<br />
Figure 8:<br />
Change in per capita non-hospital PHC expenditure (2001/01 to 2005/06) by district<br />
Change in per capita expenditure 2001/02 to 2005/06<br />
South Africa<br />
Xhariep<br />
Ukhahlamba<br />
Thabo Mofutsanyane<br />
Chris Hani<br />
Namakwa<br />
Umkhanyakude<br />
Central<br />
Nkangala<br />
Cacadu<br />
O.R. Tambo<br />
Fezile Dabi<br />
Kgalagadi<br />
Alfred Nzo<br />
Vhembe<br />
Amathole<br />
Motheo<br />
Capricorn<br />
Sisonke<br />
Gert Sibande<br />
iLembe<br />
Bohlabela<br />
Uthungulu<br />
Lejweleputswa<br />
Mopani<br />
Umzinyathi<br />
eThekwini<br />
Ehlanzeni<br />
Bojanala<br />
Pixley ka Seme<br />
Sedibeng<br />
Nelson Mandela Bay Metro<br />
Zululand<br />
Frances Baard<br />
Ugu<br />
Waterberg<br />
Southern<br />
Uthukela<br />
Bophirima<br />
West Coast<br />
Greater Sekhukhune<br />
UMgungundlovu<br />
Siyanda<br />
Amajuba<br />
City of Tshwane<br />
Cape Winelands<br />
West Rand<br />
Central Karoo<br />
City of Cape Town<br />
Eden<br />
Overberg<br />
Metsweding<br />
City of Johannesburg<br />
Ekurhuleni<br />
EC<br />
FS<br />
GP<br />
KZN<br />
LP<br />
MP<br />
NC<br />
NW<br />
WC<br />
SA<br />
-150 -100 -50 0 50 100 150 200 250<br />
Rand (change)
Section A: Indicator Comparisons by District<br />
Rural Nodes<br />
Almost all rural node districts have had an increase in per capita expenditure<br />
between 2001 and 2005, consistent with an overall increase for the country<br />
as a whole.<br />
The data illustrating the change in per capita expenditure from 2001 to<br />
2005 (Figure 9), shows that only three of the rural node districts had a<br />
change below that of the South African average of R64, of which one was<br />
at the top end of the scale viz. Central Karoo. This means that in general<br />
there has been a significant move towards equity, with more deprived<br />
districts receiving a greater proportion of the resources.<br />
Although in KwaZulu-Natal the changes varied considerably from R61 to<br />
R143 in the four rural node districts, this resulted in three of the four districts<br />
being clustered close to R220 per capita. However, the R143 increase in<br />
per capita expenditure for Umkhanyakude resulted in a PHC expenditure<br />
of R309 per capita, which was around R90 more than the other 3 KZN<br />
districts.<br />
In the two rural node districts in Limpopo province there was a noticeably<br />
uneven change in per capita expenditure. Greater Sekhukhune had a<br />
smaller increase of R28 in per capita expenditure (R87 to R115) compared<br />
to Bohlabela which had a R90 increase in per capita expenditure (R55<br />
to R145). This may be interpreted as a move toward a more equitable<br />
per capita expenditure between these districts, but it has left Greater<br />
Sekhukhune behind.<br />
Figure 9:<br />
Change in per capita expenditure in the rural nodes<br />
Change in per capita expenditure 2001/02 to 2005/06<br />
South Africa<br />
Ukhahlamba<br />
Thabo<br />
Chris Hani<br />
Umkhanyaku<br />
O.R. Tambo<br />
Kgalagadi<br />
Alfred Nzo<br />
Bohlabela<br />
Umzinyathi<br />
Zululand<br />
Ugu<br />
Greater<br />
Central Karoo<br />
-20 30 80 130 180<br />
Rand (change)<br />
EC<br />
FS<br />
GP<br />
KZN<br />
LP<br />
MP<br />
NC<br />
NW<br />
WC<br />
SA<br />
NB cannot get the district names to show in full no matter what I try!<br />
2.2 Proportion of District <strong>Health</strong> Services Expenditure on District<br />
Management<br />
This indicator represents the proportion of the total district expenditure, including district hospitals, that<br />
is spent on district management activities. On average this was 5%.<br />
District view<br />
Figure 10 shows the wide variation in district management expenditure.<br />
Metsweding has the highest proportion of district management expenditure<br />
of 19.1%. This is partially due to fact that it is the only district without a<br />
district hospital and the total expenditure is therefore reduced. This is over<br />
27 times greater than eThekwini, with the lowest proportion of 0.7%. There<br />
are some interesting provincial variations with all the districts in KwaZulu-<br />
Natal and Mpumalanga falling below the average and all the districts in<br />
Gauteng and North West situated above the average.<br />
10
Section A: Indicator Comparisons by District<br />
Figure 10: Percentage of district health expenditure on district management by district, 2005/06<br />
Percentage of District <strong>Health</strong> Services expenditure on District<br />
Management, 2005/06<br />
South Africa<br />
Metsweding<br />
Ekurhuleni<br />
Thabo Mofutsanyane<br />
Bojanala<br />
Central<br />
Sedibeng<br />
Bophirima<br />
Alfred Nzo<br />
Namakwa<br />
Cape Winelands<br />
Xhariep<br />
Ukhahlamba<br />
Southern<br />
Kgalagadi<br />
Chris Hani<br />
City of Johannesburg<br />
City of Cape Town<br />
West Rand<br />
Cacadu<br />
West Coast<br />
Frances Baard<br />
City of Tshwane<br />
O.R. Tambo<br />
Waterberg<br />
Lejweleputswa<br />
Pixley ka Seme<br />
Mopani<br />
Siyanda<br />
Fezile Dabi<br />
Nkangala<br />
Amathole<br />
Ehlanzeni<br />
Amajuba<br />
Vhembe<br />
Greater Sekhukhune<br />
Gert Sibande<br />
Sisonke<br />
Zululand<br />
Motheo<br />
Bohlabela<br />
Nelson Mandela Bay Metro<br />
Uthukela<br />
iLembe<br />
Ugu<br />
Uthungulu<br />
Umzinyathi<br />
UMgungundlovu<br />
Overberg<br />
Umkhanyakude<br />
Eden<br />
Capricorn<br />
Central Karoo<br />
eThekwini<br />
EC<br />
FS<br />
GP<br />
KZN<br />
LP<br />
MP<br />
NC<br />
NW<br />
WC<br />
SA<br />
0 5 10 15 20<br />
Percentage<br />
Financing Page 1<br />
11
Ukhahlamba<br />
Kgalagadi<br />
Chris Hani<br />
O.R. Tambo<br />
Section A: Indicator Comparisons by District<br />
Greater Sekhukhune<br />
Zululand<br />
Bohlabela<br />
Ugu<br />
Umzinyathi<br />
Metro View<br />
Figure 11:<br />
Umkhanyakude<br />
Central Karoo<br />
KZN<br />
In the metro districts, the proportion of expenditure on district management NW<br />
is 5.6%, which is only slightly higher than the national average. There WC is<br />
wide variation with the highest being in Ekurhuleni, (18.6%) whilst eThekwini SA<br />
spends only 0.7%. This wide variation begs some more detailed research to<br />
0 unpack the reasons 5 for this. 10 15 20<br />
Percentage<br />
Percentage of district health expenditure on district management in metro districts,<br />
2005/06<br />
LP<br />
MP<br />
NC<br />
Percentage of District <strong>Health</strong> Services expenditure on District<br />
Management, 2005/06<br />
South Africa<br />
Metro average<br />
Ekurhuleni<br />
City of Johannesburg<br />
City of Cape Town<br />
City of Tshwane<br />
Nelson Mandela Bay Metro<br />
eThekwini<br />
0 5 10 15 20<br />
Percentage<br />
EC<br />
FS<br />
GP<br />
KZN<br />
LP<br />
MP<br />
NC<br />
NW<br />
WC<br />
SA<br />
Rural Nodes<br />
Six of the rural node districts spent more than 5% on district management.<br />
It is not clear why Thabo Mofutsanyane spent 17% of its budget on district<br />
management, which is almost double that of the next highest district. There<br />
were clear provincial differences with all four of the rural node districts in the<br />
Eastern Cape spending more than 5% on district management. Conversely,<br />
all the districts in KwaZulu-Natal appeared to be spending too little on<br />
district management (between 1.5% - 2.7%). This may compromise the<br />
level of supervision and support the district management team can offer<br />
the professional staff in primary health care facilities and district hospitals.<br />
The lowest spending district, Central Karoo, was partly managed by the<br />
management team in the neighbouring Eden district, which could account<br />
for this low proportion of 0.9%.<br />
Figure 12: Percentage of district health services expenditure on district management, 2005/06<br />
Percentage of District <strong>Health</strong> Services expenditure on District<br />
Management, Financing 2005/06<br />
Page 2<br />
South Africa<br />
ISRDP average<br />
Thabo Mofutsanyane<br />
Alfred Nzo<br />
Ukhahlamba<br />
Kgalagadi<br />
Chris Hani<br />
O.R. Tambo<br />
Greater Sekhukhune<br />
Zululand<br />
Bohlabela<br />
Ugu<br />
Umzinyathi<br />
Umkhanyakude<br />
Central Karoo<br />
EC<br />
FS<br />
GP<br />
KZN<br />
LP<br />
MP<br />
NC<br />
NW<br />
WC<br />
SA<br />
0 5 10 15 20<br />
Percentage<br />
12<br />
Percentage of District <strong>Health</strong> Services expenditure on District<br />
Management, 2005/06
Section A: Indicator Comparisons by District<br />
2.3 Proportion of District <strong>Health</strong> Services<br />
Expenditure on District Hospitals<br />
This indicator represents the proportion of the total district expenditure that is spent on district hospitals.<br />
It is useful in assessing the focus and emphasis of health service delivery at district level. The average<br />
proportion of total district health expenditure in South Africa is 45%. Linked to the 5% for district<br />
management this means that the other half of total district resources are spent on PHC services.<br />
District view<br />
Figure 13 shows the wide variation in the proportion spent on district hospital<br />
services. Gert Sibande has the highest (68.5%). Excluding Metsweding which<br />
has no district hospital, the lowest is Johanesburg (8.4%). Among the five<br />
districts with the lowest percentage of district hospitals expenditure, three<br />
are metropolitan districts (Johannesburg, Cape Town, and Ekurhuleni), a clear<br />
indication of the lack of district hospital beds in these areas. Cape Town has<br />
plans to remedy this and has two district hospitals in the pipeline.<br />
Among the five districts with the highest proportion of district hospital<br />
expenditure, three, (Gert Sibande, Siyanda and Greater Sekhukhune),<br />
are ranked in the lowest five with regard to per capita non-hospital PHC<br />
expenditure. Clearly, in these districts spending on district hospital services<br />
has been prioritised above non-hospital PHC expenditure. Increasing<br />
the overall district expenditure in these districts, through increasing their<br />
PHC component, would have the effect of getting their per capita PHC<br />
expenditure closer to the average and would decrease the proportion<br />
spent on district hospitals.<br />
13
Section A: Indicator Comparisons by District<br />
Figure 13: Percentage of district health expenditure on district hospitals by district, 2005/06<br />
Percentage of District <strong>Health</strong> Services expenditure on District<br />
Hospitals, 2005/06<br />
South Africa<br />
Gert Sibande<br />
Siyanda<br />
Cacadu<br />
Umzinyathi<br />
Greater Sekhukhune<br />
Bohlabela<br />
Zululand<br />
Ukhahlamba<br />
Sisonke<br />
Central Karoo<br />
Waterberg<br />
Capricorn<br />
Pixley ka Seme<br />
Kgalagadi<br />
Uthungulu<br />
Umkhanyakude<br />
Eden<br />
eThekwini<br />
Uthukela<br />
Mopani<br />
Overberg<br />
Ehlanzeni<br />
Vhembe<br />
Nkangala<br />
Chris Hani<br />
Motheo<br />
UMgungundlovu<br />
iLembe<br />
West Rand<br />
Alfred Nzo<br />
Ugu<br />
Amathole<br />
West Coast<br />
Bophirima<br />
O.R. Tambo<br />
City of Tshwane<br />
Thabo Mofutsanyane<br />
Central<br />
Fezile Dabi<br />
Amajuba<br />
Namakwa<br />
Lejweleputswa<br />
Xhariep<br />
Cape Winelands<br />
Sedibeng<br />
Bojanala<br />
Nelson Mandela Bay Metro<br />
Southern<br />
Frances Baard<br />
Ekurhuleni<br />
City of Cape Town<br />
City of Johannesburg<br />
Metsweding<br />
No district hospitals<br />
0 10 20 30 40 50 60 70<br />
Percentage<br />
EC<br />
FS<br />
GP<br />
KZN<br />
LP<br />
MP<br />
NC<br />
NW<br />
WC<br />
SA<br />
Financing Page 3<br />
14
Zululand<br />
GP<br />
Ukhahlamba<br />
Central Karoo<br />
KZN<br />
Kgalagadi<br />
LP<br />
Umkhanyakude<br />
Section A: Indicator Comparisons by District<br />
Chris Hani<br />
MP<br />
Alfred Nzo<br />
NC<br />
Metro view Ugu Figure 14, highlights the difference between the metros and the rest of the<br />
O.R. Tambo<br />
NW<br />
Thabo Mofutsanyane country with the average for the metros being 29.7%. As mentioned earlier<br />
there is a probable need for more district hospital beds in Ekurhuleni,<br />
WC<br />
Cape<br />
0 Town and 10 Johannesburg. 20 30 40 50 60 70 SA<br />
Percentage<br />
Figure 14:<br />
Percentage of district health expenditure on district hospitals for metro districts,<br />
2005/06<br />
Percentage of District <strong>Health</strong> Services expenditure on District Hospitals,<br />
2005/06<br />
South Africa<br />
Metro average<br />
eThekwini<br />
City of Tshwane<br />
Nelson Mandela Bay Metro<br />
Ekurhuleni<br />
City of Cape Town<br />
City of Johannesburg<br />
0 10 20 30 40 50 60 70<br />
Percentage<br />
EC<br />
FS<br />
GP<br />
KZN<br />
LP<br />
MP<br />
NC<br />
NW<br />
WC<br />
SA<br />
Rural Nodes<br />
On average, 54% of the district budget of the rural node districts was<br />
spent on district hospital expenditure with all the districts in a fairly narrow<br />
range between 40% and 60%. In the Greater Sekhukhune and Bohlabela<br />
districts of Limpopo, 62% and 61% of the district budget was spent on<br />
the district hospitals. A similar pattern of expenditure on district hospitals<br />
was found in Umzinyathi (62%) and Zululand (61%) districts of KwaZulu-<br />
Natal. Thabo Mofutsanyane in the Free State had the lowest percentage<br />
of expenditure on district hospitals (42%). These figures reflect differing<br />
proportional expenditure on district hospitals relative to the total district<br />
allocation, particularly if a district includes a regional hospital.<br />
Figure 15: Percentage of district health services expenditure on district hospitals, 2005/06<br />
South Africa<br />
ISRDP average<br />
Umzinyathi<br />
Greater Sekhukhune<br />
Bohlabela<br />
Zululand<br />
Ukhahlamba<br />
Central Karoo<br />
Kgalagadi<br />
Umkhanyakude<br />
Chris Hani<br />
Alfred Nzo<br />
Ugu<br />
O.R. Tambo<br />
Thabo Mofutsanyane<br />
Percentage of District <strong>Health</strong> Services expenditure on District<br />
Hospitals, 2005/06<br />
Financing EC Page 4<br />
0 10 20 30 40 50 60 70<br />
Percentage<br />
FS<br />
GP<br />
KZN<br />
LP<br />
MP<br />
NC<br />
NW<br />
WC<br />
SA<br />
Percentage of District <strong>Health</strong> Services expenditure on District Hospitals,<br />
2005/06<br />
South Africa<br />
Metro average<br />
eThekwini<br />
EC<br />
FS<br />
GP<br />
15