4. Output Indicators - Health Systems Trust
4. Output Indicators - Health Systems Trust
4. Output Indicators - Health Systems Trust

You also want an ePaper? Increase the reach of your titles
YUMPU automatically turns print PDFs into web optimized ePapers that Google loves.
<strong>4.</strong> <strong>Output</strong> <strong>Indicators</strong><br />
<strong>4.</strong>1 Immunisation<br />
Thando Ford-Ngomane<br />
Immunisation coverage and drop out rate (DTP1-3)<br />
Children below the age of five years are at risk of fatal acute infectious diseases resulting in infant and child<br />
mortality. Control of these infectious diseases is important for the reduction of childhood morbidity and mortality<br />
and would make a significant contribution towards the achievement of Millennium Development Goal 4 which<br />
aims to reduce child mortality by two thirds by the year 2015 when compared to the baseline of 1990 rates. The<br />
Expanded Programme on Immunisation in South Africa aims to protect children as early as possible from vaccine<br />
preventable diseases before exposure to the disease.<br />
Immunisation coverage and immunisation drop out rates at PHC level indicate the level at which communities<br />
utilise the preventive services and thus serve as a proxy of the strength of the public health system.<br />
Two of the indicators used to measure the effectiveness of the immunisation programme are immunisation coverage<br />
and immunisation drop out rate.<br />
IMMUNISATION COVERAGE<br />
45
Section A: <strong>Output</strong> <strong>Indicators</strong><br />
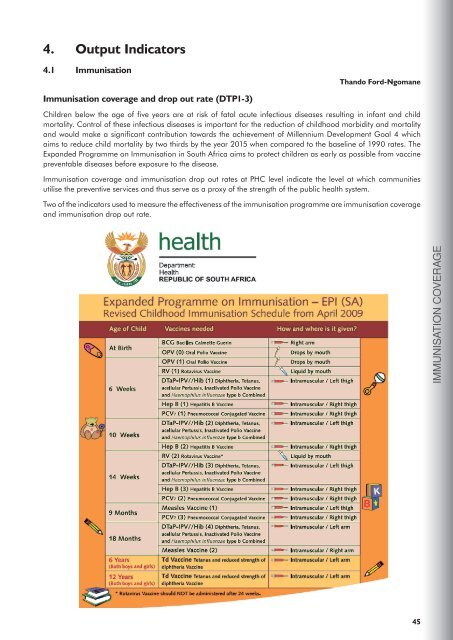
<strong>4.</strong>1.1 Immunisation coverage<br />
Immunisation coverage measures the percentage of children under one year old who have received the following<br />
immunisations:<br />
At birth: TOPV (0), BCG<br />
6 weeks: TOPV (1), DTP-HiB (1), Hep B (1)<br />
10 weeks: TOPV (2), DTP-HiB (2), Hep B (2)<br />
14 weeks: TOPV (3), DTP-HiB (3), Hep B (3)<br />
9 months: Measles (1)<br />
The indicator is calculated as the total number of children under one year old that have received all their<br />
immunisations up to the first measles, divided by the total population of children under one year old. This indicator<br />
is very sensitive to the denominator (population estimates).<br />
Map 9: Immunisation coverage in South Africa, 2007/08<br />
Immunisation coverage
Figure 41: Immunisation coverage by district, 2007/08<br />
Immunisation coverage under 1 year (annualised) by district, 2007/08<br />
UMgungundlovu<br />
Eden<br />
Cape Winelands<br />
West Rand<br />
Alfred Nzo<br />
West Coast<br />
Nelson Mandela Bay Metro<br />
Frances Baard<br />
City of Cape Town<br />
Pixley ka Seme<br />
City of Johannesburg<br />
Dr Ruth Segomotsi Mompati<br />
Ekurhuleni<br />
Overberg<br />
Uthukela<br />
City of Tshwane<br />
Lejweleputswa<br />
Fezile Dabi<br />
Central Karoo<br />
Sedibeng<br />
Ugu<br />
Metsweding<br />
Motheo<br />
Xhariep<br />
Vhembe<br />
Uthungulu<br />
Greater Sekhukhune<br />
Thabo Mofutsanyane<br />
Dr Kenneth Kaunda<br />
Nkangala<br />
Chris Hani<br />
Siyanda<br />
Umzinyathi<br />
Umkhanyakude<br />
eThekwini<br />
iLembe<br />
Ehlanzeni<br />
Gert Sibande<br />
Ngaka Modiri Molema<br />
Cacadu<br />
Ukhahlamba<br />
Waterberg<br />
O.R.Tambo<br />
Capricorn<br />
Namakwa<br />
Mopani<br />
Bojanala Platinum<br />
Sisonke<br />
Zululand<br />
Amatole<br />
Amajuba<br />
Kgalagadi<br />
SA average<br />
Provinces<br />
EC<br />
FS<br />
GP<br />
KZN<br />
LP<br />
MP<br />
NC<br />
NW<br />
WC<br />
IMMUNISATION COVERAGE<br />
20 40 60 80 100 120<br />
Percentage<br />
Source: DHIS (2008)<br />
Metro View<br />
The average immunisation coverage in the metro districts was 90.9%, 6.7 percentage points<br />
higher than the national average. Four of the metros (City of Johannesburg, City of Cape<br />
Town, Ekurhuleni and Nelson Mandela Bay) had immunisation coverage rates of more than<br />
90% in 2007/08. eThekwini (ranked 35) achieved a coverage of 78.8%, which is below the<br />
national average and the lowest among the metros. As indicated in previous District <strong>Health</strong><br />
Barometers, any well resourced health district with relatively strong socio-economic areas<br />
should show performance above the national average and therefore eThekwini needs to<br />
improve its immunisation coverage.<br />
47
Section A: <strong>Output</strong> <strong>Indicators</strong><br />
Figure 42: Immunisation coverage by metro district, 2007/08<br />
Immunisation coverage under 1 year (annualised) by metro district, 2007/08<br />
Nelson Mandela Bay Metro<br />
City of Cape Town<br />
City of Johannesburg<br />
Ekurhuleni<br />
City of Tshwane<br />
eThekwini<br />
SA average<br />
Metro average<br />
20 40 60 80 100 120<br />
Percentage<br />
Provinces<br />
EC<br />
FS<br />
GP<br />
KZN<br />
LP<br />
MP<br />
NC<br />
NW<br />
WC<br />
Rural nodes<br />
The average immunisation rate in the rural node districts was 79.3%, below the national<br />
average of 8<strong>4.</strong>2%. Seven of the rural districts had immunisation coverage rates lower than<br />
the national average. The coverage rates ranged from a high of 101.6% in Alfred Nzo (EC)<br />
to 31.5% in Kgalagadi district (NC).<br />
Figure 43: Immunisation coverage by rural district, 2007/08<br />
Immunisation coverage under 1 year (annualised) by rural district, 2007/08<br />
Alfred Nzo<br />
Central Karoo<br />
Ugu<br />
Greater Sekhukhune<br />
Thabo Mofutsanyane<br />
Chris Hani<br />
Umzinyathi<br />
Umkhanyakude<br />
Ukhahlamba<br />
O.R.Tambo<br />
Zululand<br />
Kgalagadi<br />
SA average<br />
ISRDP average<br />
20 40 60 80 100 120<br />
Percentage<br />
Provinces<br />
EC<br />
FS<br />
GP<br />
KZN<br />
LP<br />
MP<br />
NC<br />
NW<br />
WC<br />
Change and trends in immunisation coverage<br />
There was a marginal decline in the immunisation coverage nationally from 85.4% in 2006/07 to 8<strong>4.</strong>2% in 2007/08,<br />
with 42% of districts (22 out of 52) having improved coverage. Nelson Mandela Bay Metro and UMgungundlovu<br />
both increased their immunisation coverage by more than 20 percentage points each in the last year, although there<br />
are definite inconsistencies in the data.<br />
The continued uncertainty on the level of correctness of the under one year old population poses the problem of<br />
accurately measuring the performance of immunisation coverage. An undercount on children below one year of age<br />
could mean a measurable number of children are not accessing the public health service. It is in the best interests<br />
of the districts to work towards ensuring access to services to all children within their geographical boundaries with<br />
increased focus on mobile populations and areas of high population density. The private sector provides immunisation<br />
to a considerable number of children and is expected to report on this service; however, information from this sector<br />
is unavailable.<br />
Figure 44 shows the trends in immunisation coverage for districts within provinces and highlights the overall<br />
improvement of coverage in Gauteng, Western Cape and Free State provinces in the last eight years.<br />
48
Figure 44: Trend in immunisation coverage by province and district, 2000/01 - 2007/08<br />
Annual trends: Immunisation coverage under 1 year (annualised)<br />
120<br />
EC FS GP<br />
100<br />
80<br />
60<br />
40<br />
120<br />
KZN LP MP<br />
Percentage<br />
100<br />
80<br />
60<br />
40<br />
120<br />
100<br />
NC<br />
NW<br />
WC<br />
IMMUNISATION COVERAGE<br />
80<br />
60<br />
40<br />
2000/01<br />
2001/02<br />
2002/03<br />
2003/04<br />
2004/05<br />
2005/06<br />
2006/07<br />
2007/08<br />
2000/01<br />
2001/02<br />
2002/03<br />
2003/04<br />
2004/05<br />
2005/06<br />
2006/07<br />
2007/08<br />
2000/01<br />
2001/02<br />
2002/03<br />
2003/04<br />
2004/05<br />
2005/06<br />
2006/07<br />
2007/08<br />
EC Alfred Nzo<br />
EC Amatole<br />
EC Cacadu<br />
EC Chris Hani<br />
EC Nelson Mandela<br />
EC O.R.Tambo<br />
EC Ukhahlamba<br />
FS Fezile Dabi<br />
FS Lejweleputswa<br />
FS Motheo<br />
FS T. Mofutsanyane<br />
FS Xhariep<br />
GP Ekurhuleni<br />
GP Johannesburg<br />
GP Metsweding<br />
GP Sedibeng<br />
GP Tshwane<br />
GP West Rand<br />
KZN Amajuba<br />
KZN eThekwini<br />
KZN iLembe<br />
KZN Sisonke<br />
KZN Ugu<br />
KZN UMgungundlovu<br />
KZN Umkhanyakude<br />
KZN Umzinyathi<br />
Year<br />
KZN Uthukela<br />
KZN Uthungulu<br />
KZN Zululand<br />
LP Capricorn<br />
LP Gr Sekhukhune<br />
LP Mopani<br />
LP Vhembe<br />
LP Waterberg<br />
MP Ehlanzeni<br />
MP Gert Sibande<br />
MP Nkangala<br />
NC Frances Baard<br />
NC Kgalagadi<br />
NC Namakwa<br />
NC Pixley ka Seme<br />
NC Siyanda<br />
NW Bojanala Platinum<br />
NW Kenneth Kaunda<br />
NW NM Molema<br />
NW Ruth S. Mompati<br />
WC Cape Town<br />
WC Cape Winelands<br />
WC Central Karoo<br />
WC Eden<br />
WC Overberg<br />
WC West Coast<br />
49
Section A: <strong>Output</strong> <strong>Indicators</strong><br />
<strong>4.</strong>1.2 Immunisation drop out rate (DTP1-3)<br />
The immunisation drop out rate measures the percentage of children who dropped out between the first and the<br />
third dose of the DTP-Hib vaccine. It measures out of 100 children who received their first DTP-Hib vaccination,<br />
how many did not receive their third dose. The advantage of this indicator is that both the numerator and the<br />
denominator are available from routine health data and are thus not subject to the inherent complications associated<br />
with a population-based denominator, as with the immunisation coverage indicator. However, the indicator has<br />
fluctuated quite extensively over the last few years and it is difficult to determine whether this is due to poor data<br />
quality or variable service delivery.<br />
District View<br />
The national average for 2007/08 was 3.4%, up from 3.2% in 2006/07. Only one district,<br />
Siyanda (NC), had a drop out rate higher than 10%, and 25 districts were below the<br />
national average in 2007/08. The districts in Mpumalanga generally had low drop out<br />
rates with the overall provincial drop out rate of 1.0%, the lowest in the country.<br />
As illustrated in figure 45, a number of districts (Chris Hani, Alfred Nzo, Motheo, Sedibeng,<br />
Metsweding, Ekurhuleni, Ugu, Greater Sekhukhune,<br />
Gert Sibande, Frances Baard and Dr. Ruth Segomotsi Mompati) showed negative drop out<br />
rates in the 2007/08 year, indicating that more children were immunised with DTP3, than<br />
DTP1, possibly as a result of inwards migration.<br />
Map 10: Immunisation drop out rate (DTP1-3) in South Africa, 2007/08<br />
Immunisation drop out rate (DTP1-3), 2007/08<br />
Legend<br />
DTP13_07<br />
less than 0.5%<br />
0.5 - 2.9%<br />
3.0 - <strong>4.</strong>9%<br />
5.0 - 6.9%<br />
7.0% and above<br />
50
Figure 45: Immunisation drop out rate (DTP1-3) by district, 2007/08<br />
Immunisation drop out rate (DTP1−3) by district, 2007/08<br />
Ekurhuleni<br />
Chris Hani<br />
Motheo<br />
Metsweding<br />
Gert Sibande<br />
Ugu<br />
Alfred Nzo<br />
Dr Ruth Segomotsi Mompati<br />
Frances Baard<br />
Greater Sekhukhune<br />
Sedibeng<br />
Mopani<br />
Namakwa<br />
Umzinyathi<br />
West Coast<br />
Overberg<br />
Nkangala<br />
Ehlanzeni<br />
City of Tshwane<br />
Xhariep<br />
Kgalagadi<br />
Eden<br />
Dr Kenneth Kaunda<br />
Cacadu<br />
Vhembe<br />
Amajuba<br />
Bojanala Platinum<br />
City of Johannesburg<br />
Fezile Dabi<br />
Uthungulu<br />
West Rand<br />
Waterberg<br />
Zululand<br />
Ukhahlamba<br />
Thabo Mofutsanyane<br />
Sisonke<br />
Pixley ka Seme<br />
Amatole<br />
Central Karoo<br />
Umkhanyakude<br />
Capricorn<br />
eThekwini<br />
Cape Winelands<br />
Lejweleputswa<br />
Nelson Mandela Bay Metro<br />
Uthukela<br />
City of Cape Town<br />
UMgungundlovu<br />
Ngaka Modiri Molema<br />
O.R.Tambo<br />
iLembe<br />
Siyanda<br />
SA average<br />
Provinces<br />
EC<br />
FS<br />
GP<br />
KZN<br />
LP<br />
MP<br />
NC<br />
NW<br />
WC<br />
IMMUNISATION DROP OUT RATE<br />
0 5 10<br />
Percentage<br />
Source: DHIS (2008)<br />
Metro View<br />
The metro district rates in 2007/08 varied from -<strong>4.</strong>4% in Ekurhuleni to 7.9% in the City<br />
of Cape Town. The best rates were for the three metros in Gauteng for the second year<br />
running. eThekwini, City of Johannesburg, Nelson Mandela Bay Metro and City of Cape<br />
Town all had drop out rates higher than the national average. The metro average however,<br />
was marginally higher than the national average of 3.4%.<br />
51
Section A: <strong>Output</strong> <strong>Indicators</strong><br />
Figure 46: Immunisation drop out rate by metro district (DTP1-3), 2007/08<br />
Immunisation drop out rate (DTP1−3) by metro district, 2007/08<br />
Ekurhuleni<br />
City of Tshwane<br />
City of Johannesburg<br />
eThekwini<br />
Nelson Mandela Bay Metro<br />
City of Cape Town<br />
SA average<br />
Metro average<br />
0 5 10<br />
Percentage<br />
Provinces<br />
EC<br />
FS<br />
GP<br />
KZN<br />
LP<br />
MP<br />
NC<br />
NW<br />
WC<br />
Rural nodes<br />
The average drop out rate of the rural districts improved from <strong>4.</strong>3% in 2006/07 to 3.0% in<br />
2007/08 and was lower than the national average of 3.4%, with O.R. Tambo (EC) having<br />
the 3rd highest drop out rate in the country. Chris Hani (EC), Alfred Nzo (EC), Ugu (KZN)<br />
and Greater Sekhukhune (LP) districts were ranked among the top ten performing districts<br />
in SA. Ugu had a negative drop out rate for the third year running, implying that more<br />
children were given their third than their first DTP-Hib vaccination.<br />
Figure 47: Immunisation drop out rate (DTP1-3) by rural district, 2007/08<br />
Immunisation drop out rate (DTP1−3) by rural district, 2007/08<br />
Chris Hani<br />
Ugu<br />
Alfred Nzo<br />
Greater Sekhukhune<br />
Umzinyathi<br />
Kgalagadi<br />
Zululand<br />
Ukhahlamba<br />
Thabo Mofutsanyane<br />
Central Karoo<br />
Umkhanyakude<br />
O.R.Tambo<br />
SA average<br />
ISRDP average<br />
0 5 10<br />
Percentage<br />
Provinces<br />
EC<br />
FS<br />
GP<br />
KZN<br />
LP<br />
MP<br />
NC<br />
NW<br />
WC<br />
Change and trends in immunisation drop out rate (DTP1-3)<br />
Overall the immunisation drop out rate in SA increased from 3.2% in 2006/07 to 3.4% in 2007/08. Nineteen districts<br />
decreased their drop out rates, while 30 districts showed increased drop out rates between 2006/07 and 2007/08.<br />
The ISRDP average improved from <strong>4.</strong>3% in 2006/07 to 3.0% in 2007/08 whilst the metro average increased from<br />
2.9% to 3.6%, with only one metro (Ekurhuleni) showing improvement. The overall trends by district within provinces<br />
can be seen in Figure 48, and illustrate that for some districts within certain provinces there is wide variation and<br />
fluctuation from the general trend of the majority of districts. i.e Motheo (Free State), Pixley ka Seme and Frances<br />
Baard (NC) and Dr Ruth Segomotsi Mompati (NW).<br />
52
Figure 48: Trend in immunisation drop out rate (DTP1-3) by province and district, 2000/01 - 2007/08<br />
Annual trends: Immunisation drop out rate (DTP1−3)<br />
EC FS GP<br />
20<br />
10<br />
0<br />
−10<br />
KZN LP MP<br />
20<br />
Percentage<br />
10<br />
0<br />
−10<br />
20<br />
10<br />
0<br />
−10<br />
2000/01<br />
2001/02<br />
2002/03<br />
NC<br />
2003/04<br />
2004/05<br />
2005/06<br />
2006/07<br />
2007/08<br />
2000/01<br />
2001/02<br />
2002/03<br />
NW<br />
2003/04<br />
2004/05<br />
2005/06<br />
2006/07<br />
2007/08<br />
2000/01<br />
2001/02<br />
2002/03<br />
WC<br />
2003/04<br />
2004/05<br />
2005/06<br />
2006/07<br />
2007/08<br />
IMMUNISATION DROP OUT RATE<br />
EC Alfred Nzo<br />
EC Amatole<br />
EC Cacadu<br />
EC Chris Hani<br />
EC Nelson Mandela<br />
EC O.R.Tambo<br />
EC Ukhahlamba<br />
FS Fezile Dabi<br />
FS Lejweleputswa<br />
FS Motheo<br />
FS T. Mofutsanyane<br />
FS Xhariep<br />
GP Ekurhuleni<br />
GP Johannesburg<br />
GP Metsweding<br />
GP Sedibeng<br />
GP Tshwane<br />
GP West Rand<br />
KZN Amajuba<br />
KZN eThekwini<br />
KZN iLembe<br />
KZN Sisonke<br />
KZN Ugu<br />
KZN UMgungundlovu<br />
KZN Umkhanyakude<br />
KZN Umzinyathi<br />
Year<br />
KZN Uthukela<br />
KZN Uthungulu<br />
KZN Zululand<br />
LP Capricorn<br />
LP Gr Sekhukhune<br />
LP Mopani<br />
LP Vhembe<br />
LP Waterberg<br />
MP Ehlanzeni<br />
MP Gert Sibande<br />
MP Nkangala<br />
NC Frances Baard<br />
NC Kgalagadi<br />
NC Namakwa<br />
NC Pixley ka Seme<br />
NC Siyanda<br />
NW Bojanala Platinum<br />
NW Kenneth Kaunda<br />
NW NM Molema<br />
NW Ruth S. Mompati<br />
WC Cape Town<br />
WC Cape Winelands<br />
WC Central Karoo<br />
WC Eden<br />
WC Overberg<br />
WC West Coast<br />
<strong>4.</strong>1.3 Immunisation coverage (Measles 1st dose) and drop out rate (Measles 1 – 2)<br />
The level of attendance at primary health care facilities for preventive and promotive services declines after the<br />
first year of life. These indicators monitor whether children below the age of five have received the required two<br />
doses of measles. The proportion of children immunised against measles is one of the indicators specified under<br />
Target 5 of MDG<strong>4.</strong><br />
Measles 1st dose coverage<br />
The wide variation in Measles 1st dose coverage in 2007/08 can be seen in Figure 49 and varied from a very high<br />
value of 147.1% in Dr Ruth Segomotsi Mompati (NW) to a low of 33.7% in Kgalagadi (NC). The average coverage<br />
in SA for 2007/08 was 86.6% and 22 districts had coverage rates of more than 100%. The average coverage in<br />
the metro districts was 92.5% and in the rural districts was 82.5%.<br />
53
Section A: <strong>Output</strong> <strong>Indicators</strong><br />
Figure 49: Measles 1st dose coverage by district, 2007/08<br />
Measles 1st dose coverage (annualised) by district, 2007/08<br />
Dr Ruth Segomotsi Mompati<br />
UMgungundlovu<br />
Eden<br />
West Rand<br />
Pixley ka Seme<br />
Cape Winelands<br />
City of Cape Town<br />
West Coast<br />
Frances Baard<br />
Nelson Mandela Bay Metro<br />
City of Johannesburg<br />
Ekurhuleni<br />
Central Karoo<br />
Zululand<br />
Overberg<br />
Uthukela<br />
Xhariep<br />
Lejweleputswa<br />
Sedibeng<br />
Fezile Dabi<br />
Ugu<br />
Umzinyathi<br />
Greater Sekhukhune<br />
City of Tshwane<br />
Alfred Nzo<br />
Motheo<br />
Metsweding<br />
Uthungulu<br />
Vhembe<br />
eThekwini<br />
Thabo Mofutsanyane<br />
Umkhanyakude<br />
Nkangala<br />
Siyanda<br />
Namakwa<br />
Ngaka Modiri Molema<br />
iLembe<br />
Ehlanzeni<br />
Gert Sibande<br />
Dr Kenneth Kaunda<br />
Cacadu<br />
Capricorn<br />
Chris Hani<br />
Ukhahlamba<br />
O.R.Tambo<br />
Waterberg<br />
Sisonke<br />
Bojanala Platinum<br />
Mopani<br />
Amatole<br />
Amajuba<br />
Kgalagadi<br />
SA average<br />
50 100 150<br />
Percentage<br />
Source: DHIS (2008)<br />
Provinces<br />
EC<br />
FS<br />
GP<br />
KZN<br />
LP<br />
MP<br />
NC<br />
NW<br />
WC<br />
Drop out rate (Measles 1 – 2)<br />
The measles immunisation drop out rate monitors the drop out between the first and second measles vaccine given<br />
at 9 months and 18 months of age respectively. West Coast district (WC) had the lowest district measles drop out<br />
rate of 0.6% in 2006/07 and the Free State province had the lowest overall provincial measles drop out rate of<br />
1<strong>4.</strong>7%. The high drop out rate in North West was largely due to the high drop out rate of 52.4% (the highest in the<br />
country) in Dr Ruth Segomotsi Mompati in 2007/08. Although UMgungundlovu district achieved exceptional rates<br />
of immunisation coverage in children below the age of one year (DTP1-3), the measles drop out rate in this district<br />
was 21.5% (second highest in the country) in 2007/08.<br />
54
Figure 50: Immunisation drop out rate (Measles1-2) by district, 2007/08<br />
Immunisation drop out rate (Measles1−2) by district, 2007/08<br />
West Coast<br />
Ugu<br />
Kgalagadi<br />
Cape Winelands<br />
Xhariep<br />
Eden<br />
Vhembe<br />
Frances Baard<br />
Umzinyathi<br />
Cacadu<br />
Siyanda<br />
Thabo Mofutsanyane<br />
Lejweleputswa<br />
Namakwa<br />
Nkangala<br />
Uthungulu<br />
iLembe<br />
Overberg<br />
Gert Sibande<br />
Amajuba<br />
Sisonke<br />
Nelson Mandela Bay Metro<br />
Motheo<br />
Mopani<br />
Pixley ka Seme<br />
Fezile Dabi<br />
eThekwini<br />
Central Karoo<br />
Ekurhuleni<br />
Capricorn<br />
Umkhanyakude<br />
City of Johannesburg<br />
Ngaka Modiri Molema<br />
Dr Kenneth Kaunda<br />
Greater Sekhukhune<br />
Ehlanzeni<br />
Metsweding<br />
Uthukela<br />
Ukhahlamba<br />
Sedibeng<br />
Zululand<br />
City of Tshwane<br />
Chris Hani<br />
UMgungundlovu<br />
Bojanala Platinum<br />
Amatole<br />
City of Cape Town<br />
Waterberg<br />
O.R.Tambo<br />
Alfred Nzo<br />
West Rand<br />
Dr Ruth Segomotsi Mompati<br />
SA average<br />
Provinces<br />
EC<br />
FS<br />
GP<br />
KZN<br />
LP<br />
MP<br />
NC<br />
NW<br />
WC<br />
MEASLES COVERAGE AND DROP OUT RATE<br />
10 20 30 40 50<br />
Percentage<br />
Source: DHIS (2008)<br />
<strong>4.</strong>2 Caesarean Section Rate<br />
Khosi Nyawo<br />
The Caesarean section rate measures the proportion of deliveries in which a Caesarean section was performed.<br />
This is a facility based indicator and not a population based indicator. In other words it uses deliveries that take<br />
place in a facility (clinic, health centre or district hospital) as the denominator as opposed to using all deliveries (both<br />
facility and home deliveries) as the denominator. The numerator is the number of Caesarean section operations<br />
done in district hospitals. On the one hand it under-estimates the real rate as many complicated deliveries end up<br />
as Caesarean sections at secondary and tertiary level hospitals with the result that the numerator is too low. On<br />
the other hand there are a number of normal deliveries that take place outside of the formal health sector (home<br />
deliveries) and thus there is an over-estimate of the real rate as the denominator is too low.<br />
55
Section A: <strong>Output</strong> <strong>Indicators</strong><br />
District View<br />
In 2007/08 the national average for district hospitals in South Africa was 15.6% 15 . This<br />
excluded any Caesarean section operations done in level 2, 3 and 4 hospitals. In 2006/07<br />
the national average for district hospitals was 15.0%.<br />
As can be seen in Map 11 and Figure 51, there was a wide variation in the Caesarean<br />
section rates among the 52 districts in 2007/08. At the top end of scale was Nelson<br />
Mandela Bay Metro (EC) with a rate of 32.8% whilst at the low end was Frances Baard<br />
(NC) with 2.0 %. There are no district hospitals in Metsweding (GP) resulting in no data for<br />
this district. There was missing data from hospitals in Xhariep (FS) and Siyanda (NC) for<br />
the past two years and from Amajuba (KZN) for the past five years. There are also several<br />
months of data missing for district hospitals in Dr Kenneth Kaunda (NW) and Namakwa<br />
and Kgalagadi districts in the Northern Cape. All these cases suggest problems with the<br />
data collection processes and require investigation at the hospital and district levels to<br />
remedy the situation.<br />
Six of the ten districts with the highest Caesarean section rates were in KwaZulu-Natal.<br />
Within these districts there were also variations among the individual district hospitals.<br />
There were eleven districts with Caesarean section rates above 20% and ten districts<br />
(excluding Amajuba, Siyanda and Xhariep) with Caesarean section rates below 10%.<br />
Caesarean sections are one of the components of essential obstetric care (EOC) and<br />
such wide differences are indicative of very different levels in the quality of obstetric care<br />
and inequities in the health system around the country. There were also wide variations<br />
between districts in most of the provinces. These variations need to be investigated and the<br />
classification of hospitals in some of the provinces needs to be reviewed.<br />
Frances Baard was the only district with an extremely low Caesarean section rate of 2.0%.<br />
The probable cause for this is that most of the Caesarean sections are being carried out at<br />
higher level hospitals. This results in inefficient use of scarce resources and unnecessarily<br />
pushes up the costs of health care.<br />
Map 11: Caesarean section rates in South Africa, 2007/08<br />
Caesarean section rate, 2007/08<br />
Legend<br />
CSection_07<br />
no data / no hospitals<br />
under 10%<br />
10 - 14%<br />
15 - 19%<br />
20 - 24%<br />
25% and above<br />
15 The latest (2006) national targets for Caesarean section rates as stated by the Department of <strong>Health</strong> range from 12.5% for district hospitals, 22% for regional hospitals<br />
and 32% for central hospitals. Source: <strong>Health</strong> <strong>Indicators</strong> Update: Hospital Efficiency. Department of <strong>Health</strong>, Cluster Monitoring and Evaluation Directorate. 2006.<br />
56
Figure 51: Caesarean section rates by district, 2007/08<br />
Caesarean section rate by district, 2007/08<br />
Xhariep<br />
Amajuba<br />
Siyanda<br />
Nelson Mandela Bay Metro<br />
City of Cape Town<br />
eThekwini<br />
UMgungundlovu<br />
Ugu<br />
Sedibeng<br />
Vhembe<br />
Uthungulu<br />
Uthukela<br />
Sisonke<br />
Overberg<br />
Ngaka Modiri Molema<br />
Dr Ruth Segomotsi Mompati<br />
Central Karoo<br />
Zululand<br />
Cape Winelands<br />
Eden<br />
Umkhanyakude<br />
West Rand<br />
Cacadu<br />
Mopani<br />
Motheo<br />
City of Johannesburg<br />
Namakwa<br />
Fezile Dabi<br />
Gert Sibande<br />
Umzinyathi<br />
iLembe<br />
Waterberg<br />
Alfred Nzo<br />
Kgalagadi<br />
Ekurhuleni<br />
Pixley ka Seme<br />
Greater Sekhukhune<br />
Ehlanzeni<br />
West Coast<br />
Capricorn<br />
O.R.Tambo<br />
Thabo Mofutsanyane<br />
City of Tshwane<br />
Lejweleputswa<br />
Nkangala<br />
Dr Kenneth Kaunda<br />
Bojanala Platinum<br />
Ukhahlamba<br />
Chris Hani<br />
Amatole<br />
Frances Baard<br />
SA average<br />
Provinces<br />
EC<br />
FS<br />
GP<br />
KZN<br />
LP<br />
MP<br />
NC<br />
NW<br />
WC<br />
CAESAREAN SECTION RATE<br />
10 20 30<br />
Percentage<br />
Source: DHIS (2008)<br />
Metro View<br />
The metro average of 20.2% in 2007/08 was far higher than the South African average.<br />
This is largely due to the very high Caesarean section rate in Nelson Mandela Bay Metro<br />
of 32.8 % and the high rate in the City of Cape Town (32.5%). Five of the six metros were<br />
above 10%, four were above the national average and only the City of Tshwane had a low<br />
rate of 9.6%. The low Caesarean section rate in the City of Tshwane indicates that there<br />
may be data quality issues or it may mean that many cases are referred to a higher level of<br />
care (academic hospital). This may be due to limited resources and capacity in the district<br />
hospitals.<br />
57
Section A: <strong>Output</strong> <strong>Indicators</strong><br />
Figure 52: Caesarean section rate by metro district, 2007/08<br />
Caesarean section rate by metro district, 2007/08<br />
Nelson Mandela Bay Metro<br />
City of Cape Town<br />
eThekwini<br />
City of Johannesburg<br />
Ekurhuleni<br />
City of Tshwane<br />
SA average<br />
Metro average<br />
10 20 30<br />
Percentage<br />
Provinces<br />
EC<br />
FS<br />
GP<br />
KZN<br />
LP<br />
MP<br />
NC<br />
NW<br />
WC<br />
Rural Nodes<br />
In 2007/08 the average Caesarean section rate in the rural nodes was 1<strong>4.</strong>1% as opposed<br />
to the national average of 15.6%. All of the rural KwaZulu-Natal districts and Central Karoo<br />
(WC) were above (or very close to) the national average, with all the Eastern Cape districts<br />
below the national average. The Caesarean section rate for Ugu district remains higher<br />
than any other rural node district. This may be due to cross border flow from the Eastern<br />
Cape, local capacity to perform Caesarean sections with fewer cases referred to higher<br />
levels or poor compliance to protocols. The reasons for the high rate in Ugu needs review.<br />
Figure 53: Caesarean section rate by rural district, 2007/08<br />
Caesarean section rate by rural district, 2007/08<br />
Ugu<br />
Central Karoo<br />
Zululand<br />
Umkhanyakude<br />
Umzinyathi<br />
Alfred Nzo<br />
Kgalagadi<br />
Greater Sekhukhune<br />
O.R.Tambo<br />
Thabo Mofutsanyane<br />
Ukhahlamba<br />
Chris Hani<br />
SA average<br />
ISRDP average<br />
10 20 30<br />
Percentage<br />
Provinces<br />
EC<br />
FS<br />
GP<br />
KZN<br />
LP<br />
MP<br />
NC<br />
NW<br />
WC<br />
Change and trends in Caesarean section rate<br />
Since 2000/01 there has been a three percentage point increase overall, with a gradual increase apparent in most<br />
districts. All of this increase has taken place since 2003/04 when there was an average Caesarean section rate of<br />
12.5% compared to 15.6% in 2007/08. The Caesarean section rate in the rural nodes increased from 10.2% to 1<strong>4.</strong>1%<br />
and in the metros from 18.7% to 20.2% over the same time period.<br />
Between 2006/07 and 2007/08 there was an increase of 0.6 percentage points in the national Caesarean section<br />
rate. During this time 34 districts showed increased rates with the largest increase, 9.6 percentage points, in the<br />
Nelson Mandela Bay Metro (EC). There were five districts which had increases of more than three percentage points<br />
and only one district, Uthungulu (KZN) with a decrease of more than two percentage points.<br />
The general increasing trend in the Caesarean section rate may be due to the increasing numbers of women who are<br />
ill with HIV related problems. However, it requires some research or case studies to ascertain the real reasons for this<br />
as there are both health risks and health systems costs associated with increased rates of Caesarean sections.<br />
58
Figure 54:<br />
Trends in Caesarean section rate in district hospitals by province and district,<br />
2000/01 - 2007/08<br />
Annual trends: Caesarean section rate<br />
EC FS GP<br />
30<br />
20<br />
10<br />
0<br />
KZN LP MP<br />
Percentage<br />
30<br />
20<br />
10<br />
0<br />
30<br />
NC<br />
NW<br />
WC<br />
CAESAREAN SECTION RATE<br />
20<br />
10<br />
0<br />
2000/01<br />
2001/02<br />
2002/03<br />
2003/04<br />
2004/05<br />
2005/06<br />
2006/07<br />
2007/08<br />
2000/01<br />
2001/02<br />
2002/03<br />
2003/04<br />
2004/05<br />
2005/06<br />
2006/07<br />
2007/08<br />
2000/01<br />
2001/02<br />
2002/03<br />
2003/04<br />
2004/05<br />
2005/06<br />
2006/07<br />
2007/08<br />
EC Alfred Nzo<br />
EC Amatole<br />
EC Cacadu<br />
EC Chris Hani<br />
EC Nelson Mandela<br />
EC O.R.Tambo<br />
EC Ukhahlamba<br />
FS Fezile Dabi<br />
FS Lejweleputswa<br />
FS Motheo<br />
FS T. Mofutsanyane<br />
FS Xhariep<br />
GP Ekurhuleni<br />
GP Johannesburg<br />
GP Sedibeng<br />
GP Tshwane<br />
GP West Rand<br />
KZN Amajuba<br />
KZN eThekwini<br />
KZN iLembe<br />
KZN Sisonke<br />
KZN Ugu<br />
KZN UMgungundlovu<br />
KZN Umkhanyakude<br />
KZN Umzinyathi<br />
KZN Uthukela<br />
Year<br />
KZN Uthungulu<br />
KZN Zululand<br />
LP Capricorn<br />
LP Gr Sekhukhune<br />
LP Mopani<br />
LP Vhembe<br />
LP Waterberg<br />
MP Ehlanzeni<br />
MP Gert Sibande<br />
MP Nkangala<br />
NC Frances Baard<br />
NC Kgalagadi<br />
NC Namakwa<br />
NC Pixley ka Seme<br />
NC Siyanda<br />
NW Bojanala Platinum<br />
NW Kenneth Kaunda<br />
NW NM Molema<br />
NW Ruth S. Mompati<br />
WC Cape Town<br />
WC Cape Winelands<br />
WC Central Karoo<br />
WC Eden<br />
WC Overberg<br />
WC West Coast<br />
59
Section A: <strong>Output</strong> <strong>Indicators</strong><br />
Figure 55: Change in Caesarean section rate by district, 2006/07 - 2007/08<br />
Change in Caesarean section rate by district, 2006/07−2007/08<br />
Metsweding<br />
Nelson Mandela Bay Metro<br />
Alfred Nzo<br />
Namakwa<br />
City of Johannesburg<br />
Chris Hani<br />
Bojanala Platinum<br />
Pixley ka Seme<br />
Central Karoo<br />
West Coast<br />
eThekwini<br />
Overberg<br />
Sedibeng<br />
Greater Sekhukhune<br />
Ngaka Modiri Molema<br />
Fezile Dabi<br />
Dr Ruth Segomotsi Mompati<br />
Sisonke<br />
Capricorn<br />
Amatole<br />
West Rand<br />
Umzinyathi<br />
Kgalagadi<br />
Waterberg<br />
Eden<br />
City of Cape Town<br />
Cacadu<br />
Umkhanyakude<br />
Ekurhuleni<br />
Lejweleputswa<br />
Cape Winelands<br />
Frances Baard<br />
Gert Sibande<br />
Motheo<br />
Xhariep<br />
Amajuba<br />
O.R.Tambo<br />
City of Tshwane<br />
Ukhahlamba<br />
Thabo Mofutsanyane<br />
Ugu<br />
Uthukela<br />
Zululand<br />
Mopani<br />
Ehlanzeni<br />
Nkangala<br />
UMgungundlovu<br />
iLembe<br />
Siyanda<br />
Vhembe<br />
Dr Kenneth Kaunda<br />
Uthungulu<br />
SA average<br />
−2 0 2 4 6 8 10<br />
Percentage points<br />
Source: DHIS (2008)<br />
Provinces<br />
EC<br />
FS<br />
GP<br />
KZN<br />
LP<br />
MP<br />
NC<br />
NW<br />
WC<br />
60
<strong>4.</strong>3 Male Condom Distribution Rate<br />
Marion Stevens<br />
The male condom distribution rate is the number of condoms distributed via public health facilities by the<br />
Departments of <strong>Health</strong> in a year to men 15 years and older. The average number of condoms distributed in SA<br />
was 11.8 per man in 2007/08.<br />
District View<br />
The variation in condom distribution is shown in Figure 56 and varied from 55.2 condoms<br />
per man per year in Cape Town, which for a number of years has by far been the most<br />
proactive district in the country, to 1.7 in Kgalagadi district. The next lowest condom<br />
distribution rates in the country were in Motheo (FS) with a rate of <strong>4.</strong>1 and Sedibeng (GP)<br />
with a rate of <strong>4.</strong>6. Mopani (LP) had the second highest distribution rate in South Africa at<br />
17.3 condoms per man per year.<br />
Map 12: Male condom distribution rate in South Africa, 2007/08<br />
Male condom distribution rate, 2007/08<br />
Legend<br />
COND_07<br />
5 and less<br />
6-7<br />
8-9<br />
10 - 11<br />
12 and above<br />
MALE CONDOM DISTRIBUTION RATE<br />
61
Section A: <strong>Output</strong> <strong>Indicators</strong><br />
Figure 56: Male condom distribution rate by district, 2007/08<br />
Male condom distribution rate (annualised) by district, 2007/08<br />
City of Cape Town<br />
Mopani<br />
Overberg<br />
Ukhahlamba<br />
Ehlanzeni<br />
Vhembe<br />
West Coast<br />
Central Karoo<br />
Eden<br />
Cacadu<br />
Chris Hani<br />
Capricorn<br />
Amajuba<br />
Umkhanyakude<br />
Xhariep<br />
City of Tshwane<br />
Greater Sekhukhune<br />
O.R.Tambo<br />
Metsweding<br />
Waterberg<br />
Uthukela<br />
Fezile Dabi<br />
Cape Winelands<br />
Alfred Nzo<br />
Amatole<br />
Zululand<br />
Ugu<br />
Namakwa<br />
Sisonke<br />
Gert Sibande<br />
Nkangala<br />
Bojanala Platinum<br />
Lejweleputswa<br />
eThekwini<br />
City of Johannesburg<br />
Thabo Mofutsanyane<br />
Pixley ka Seme<br />
Ekurhuleni<br />
Dr Ruth Segomotsi Mompati<br />
UMgungundlovu<br />
Umzinyathi<br />
Ngaka Modiri Molema<br />
iLembe<br />
Dr Kenneth Kaunda<br />
Frances Baard<br />
Siyanda<br />
Uthungulu<br />
Nelson Mandela Bay Metro<br />
West Rand<br />
Sedibeng<br />
Motheo<br />
Kgalagadi<br />
SA average<br />
10 20 30 40 50<br />
Number of condoms per male 15 years and older<br />
Source: DHIS (2008)<br />
Provinces<br />
EC<br />
FS<br />
GP<br />
KZN<br />
LP<br />
MP<br />
NC<br />
NW<br />
WC<br />
Metro view<br />
All the metro districts continued to perform below the SA average in 2007/08, with the<br />
exception of Cape Town, which distributed ten times as many condoms (55.2) as Nelson<br />
Mandela Bay Metro (5.3). Ekurhuleni only distributed 6.2 and City of Johannesburg<br />
6.8 condoms per male, less than many of the rural districts and below the rural district<br />
average.<br />
62
Figure 57: Male condom distribution rate by metro district, 2007/08<br />
Male condom distribution rate (annualised) by metro district, 2007/08<br />
City of Cape Town<br />
City of Tshwane<br />
eThekwini<br />
City of Johannesburg<br />
Ekurhuleni<br />
Nelson Mandela Bay Metro<br />
SA average<br />
Metro average<br />
10 20 30 40 50<br />
Number of condoms per male 15 years and older<br />
Provinces<br />
EC<br />
FS<br />
GP<br />
KZN<br />
LP<br />
MP<br />
NC<br />
NW<br />
WC<br />
Rural Nodes The average number of condoms distributed for each male in the rural districts in 2007/08<br />
was 9.2 and has decreased from 9.8 in 2006/07. Only two of the rural districts, Ukhahlamba<br />
and Central Karoo, were above the national average in 2007/08.<br />
Figure 58: Male condom distribution rate by rural district, 2007/08<br />
Ukhahlamba<br />
Central Karoo<br />
Chris Hani<br />
Umkhanyakude<br />
Greater Sekhukhune<br />
O.R.Tambo<br />
Alfred Nzo<br />
Zululand<br />
Ugu<br />
Thabo Mofutsanyane<br />
Umzinyathi<br />
Kgalagadi<br />
Male condom distribution rate (annualised) by rural district, 2007/08<br />
SA average<br />
ISRDP average<br />
10 20 30 40 50<br />
Number of condoms per male 15 years and older<br />
Provinces<br />
EC<br />
FS<br />
GP<br />
KZN<br />
LP<br />
MP<br />
NC<br />
NW<br />
WC<br />
MALE CONDOM DISTRIBUTION RATE<br />
Change and trends in condom distribution<br />
As can be seen in Figure 59, the City of Cape Town has been the overall leader in condom distribution in the country,<br />
particularly in the last three years. NGOs working in the HIV/AIDS sector and the City of Cape Town have taken the<br />
initiative to work together to dramatically scale up condom distribution in the metro over the three year period, using<br />
methods which were proven to be successful in Khayelitsha in 2005. This success can and should be emulated by<br />
other districts in their HIV/AIDS prevention strategies.<br />
In 2007/08 the City of Cape Town had the highest increase in SA, by distributing 8.9 more condoms per man per<br />
year than in 2006/07. As a result of this, the average distribution in the Western Cape province increased from 33.4<br />
in 2006/7 to 40.5 condoms per man per year in 2007/08, with the West Coast district increasing from 8.3 male<br />
condoms distributed in 2006/07 to 1<strong>4.</strong>3 in 2007/08.<br />
The incidence of new STIs treated in the Western Cape has decreased from 3.4% in 2004/05 to 2.5% in 2007/08<br />
whilst the STI incidence in the City of Cape Town decreased from 3.7% to 2.5% over the same time period, which<br />
could partially be attributed to the improved distribution of condoms.<br />
In 2007/08, the average rate of male condom distribution in the rural districts in 2007/08 decreased from 2006/07<br />
by 0.6 condoms per man per year to 9.2, but had increased from 7.5 in 2003/0<strong>4.</strong> Eight of the 12 rural districts<br />
showed a decrease in 2007/08, which is of concern in terms of HIV prevention.<br />
63
Section A: <strong>Output</strong> <strong>Indicators</strong><br />
Figure 59: Change in male condom distribution rate by district, 2006/07 - 2007/08<br />
Change in male condom distribution rate by district, 2006/07−2007/08<br />
City of Cape Town<br />
West Coast<br />
Central Karoo<br />
Overberg<br />
Eden<br />
Ukhahlamba<br />
Cape Winelands<br />
Amajuba<br />
Metsweding<br />
Mopani<br />
Namakwa<br />
West Rand<br />
Zululand<br />
Sedibeng<br />
Uthukela<br />
Siyanda<br />
Uthungulu<br />
Dr Ruth Segomotsi Mompati<br />
Frances Baard<br />
Alfred Nzo<br />
Bojanala Platinum<br />
iLembe<br />
UMgungundlovu<br />
Ngaka Modiri Molema<br />
Gert Sibande<br />
Motheo<br />
Sisonke<br />
Capricorn<br />
Xhariep<br />
Vhembe<br />
Dr Kenneth Kaunda<br />
Fezile Dabi<br />
Greater Sekhukhune<br />
Lejweleputswa<br />
O.R.Tambo<br />
City of Johannesburg<br />
Nkangala<br />
Thabo Mofutsanyane<br />
Umkhanyakude<br />
Ekurhuleni<br />
Nelson Mandela Bay Metro<br />
Chris Hani<br />
Amatole<br />
Umzinyathi<br />
City of Tshwane<br />
eThekwini<br />
Cacadu<br />
Waterberg<br />
Pixley ka Seme<br />
Ugu<br />
Ehlanzeni<br />
Kgalagadi<br />
SA average<br />
−2 0 2 4 6 8<br />
Number of condoms per male 15 years and older<br />
Source: DHIS (2008)<br />
Provinces<br />
EC<br />
FS<br />
GP<br />
KZN<br />
LP<br />
MP<br />
NC<br />
NW<br />
WC<br />
64
Figure 60: Trends in male condom distribution rate by province and district, 2000/01 - 2007/08<br />
Annual trends: Male condom distribution rate (annualised)<br />
EC FS GP<br />
50<br />
40<br />
30<br />
20<br />
10<br />
Number of condoms per male 15 years and older<br />
0<br />
50<br />
40<br />
30<br />
20<br />
10<br />
0<br />
50<br />
40<br />
30<br />
KZN LP MP<br />
NC<br />
NW<br />
WC<br />
MALE CONDOM DISTRIBUTION RATE<br />
20<br />
10<br />
0<br />
2000/01<br />
2001/02<br />
2002/03<br />
2003/04<br />
2004/05<br />
2005/06<br />
2006/07<br />
2007/08<br />
2000/01<br />
2001/02<br />
2002/03<br />
2003/04<br />
2004/05<br />
2005/06<br />
2006/07<br />
2007/08<br />
2000/01<br />
2001/02<br />
2002/03<br />
2003/04<br />
2004/05<br />
2005/06<br />
2006/07<br />
2007/08<br />
EC Alfred Nzo<br />
EC Amatole<br />
EC Cacadu<br />
EC Chris Hani<br />
EC Nelson Mandela<br />
EC O.R.Tambo<br />
EC Ukhahlamba<br />
FS Fezile Dabi<br />
FS Lejweleputswa<br />
FS Motheo<br />
FS T. Mofutsanyane<br />
FS Xhariep<br />
GP Ekurhuleni<br />
GP Johannesburg<br />
GP Metsweding<br />
GP Sedibeng<br />
GP Tshwane<br />
GP West Rand<br />
KZN Amajuba<br />
KZN eThekwini<br />
KZN iLembe<br />
KZN Sisonke<br />
KZN Ugu<br />
KZN UMgungundlovu<br />
KZN Umkhanyakude<br />
KZN Umzinyathi<br />
Year<br />
KZN Uthukela<br />
KZN Uthungulu<br />
KZN Zululand<br />
LP Capricorn<br />
LP Gr Sekhukhune<br />
LP Mopani<br />
LP Vhembe<br />
LP Waterberg<br />
MP Ehlanzeni<br />
MP Gert Sibande<br />
MP Nkangala<br />
NC Frances Baard<br />
NC Kgalagadi<br />
NC Namakwa<br />
NC Pixley ka Seme<br />
NC Siyanda<br />
NW Bojanala Platinum<br />
NW Kenneth Kaunda<br />
NW NM Molema<br />
NW Ruth S. Mompati<br />
WC Cape Town<br />
WC Cape Winelands<br />
WC Central Karoo<br />
WC Eden<br />
WC Overberg<br />
WC West Coast<br />
65
Section A: <strong>Output</strong> <strong>Indicators</strong><br />
<strong>4.</strong>4 PMTCT <strong>Indicators</strong><br />
Tanya Doherty<br />
Reducing maternal and child mortality are important Millennium Development Goals (MDGs). However, South<br />
Africa is currently not on track to meet either of these goals. Despite overall improvements in the health system,<br />
South Africa has seen no significant change in child mortality between 1990 and 2007. In 1990 the under-5<br />
mortality rate was estimated at 60 per 1 000 live births and in 2007 it was estimated at 59. The MDG target for<br />
South Africa by 2015 is 20. The lack of improvement in child mortality in South Africa is largely due to the HIV<br />
epidemic, specifically the transmission of HIV from mother to child (MTCT). The maternal mortality ratio for South<br />
Africa was estimated to be 400/100 000 births in 2005 and is also considered to be rising 16 . Preventing motherto-child<br />
transmission of HIV (PMTCT) has been recognised as an essential intervention in the fight against HIV/AIDS<br />
as well as improving maternal and child mortality. The imperative to provide an effective PMTCT programme is<br />
particularly great in South Africa where 28% of pregnant women attending public sector antenatal clinics in 2007<br />
were HIV infected 17 .<br />
The National Strategic Plan for HIV, AIDS and STIs, 2007-2011, recognises PMTCT as a mainstay of the response<br />
against HIV and AIDS in children and the Plan has a target to reduce MTCT to less than 5% by 2011. Since 2002<br />
the South African Department of <strong>Health</strong> has been implementing a PMTCT programme with a set of core activities.<br />
These core activities form a continuum from prevention of HIV in women through to care and support for HIV<br />
infected women and infants. Until 2008 the antiretroviral component of the programme included a single dose<br />
of nevirapine which is estimated to reduce peri-partum transmission to around 12% 18 . From March 2008, the<br />
Department of <strong>Health</strong> amended the PMTCT protocol to include dual therapy for pregnant women 19 . This revised<br />
protocol is estimated to reduce peri-partum mother to child transmission to around 5-6% 20 . However, to date the<br />
National Indicator Data Set (NIDS) has not been amended to accommodate this change in the clinical protocol,<br />
further adding to the poor management of PMTCT data.<br />
Despite the high burden of HIV and the importance and priority of the PMTCT programme, management at all<br />
levels have not monitored the programme adequately. Most of the indicators continue to be plagued by major data<br />
collection and quality issues. Generally the data underlying the PMTCT programme is less than optimal, specifically<br />
the nevirapine uptake in mothers and children. This is indicative of management neglect of the programme from<br />
national to facility level.<br />
A number of the larger specific data issues are described. All of the PMTCT indicators for the Western Cape in the<br />
DHIS have been replaced with data supplied by the province from another information system. This is because the<br />
correct data were not correctly included in the national DHIS database. The Gauteng data for the HIV testing rate<br />
for 2007/08 were unusable due to problems in the denominator. Data in the DHIS were replaced by edited data<br />
from the province. In Limpopo high values for Vhembe and Waterberg districts (with rates of over 100% found for<br />
the proportion of ANC clients tested) were due to denominator issues.<br />
<strong>4.</strong><strong>4.</strong>1 Proportion of antenatal clients tested for HIV<br />
In order to access PMTCT interventions a pregnant woman needs to know her HIV status, thus HIV testing is seen as<br />
the entry point into PMTCT care. This indicator measures the proportion of women who attend antenatal care that<br />
are tested for HIV. South Africa has a high antenatal coverage rate of 92% (2003 SADHS) 21 which, if HIV testing<br />
is well integrated within antenatal care, should result in high HIV testing coverage amongst antenatal clients. The<br />
target for antenatal HIV testing within the National Strategic Plan 2007-2011 is to reach a coverage of 95% by<br />
2011.<br />
16 UNICEF. The State of the World’s Children 2009. Maternal and Newborn <strong>Health</strong>. New York, UNICEF, 2008. URL: http://www.unicef.org/publications/.<br />
17 National Department of <strong>Health</strong>. National HIV and Syphilis Antenatal Sero-prevalence Survey 2007. Pretoria, South African Department of <strong>Health</strong>, 2008. An addendum<br />
to the antenatal survey results was released on 12 May revising the methodology and values of the survey results with no age weighting. These new values have been<br />
included in the Excel data file that is included in the CD that comes with this publication, however it was too late to update all the graphs and figures in this publication.<br />
Addendum for published 2007 National HIV and Syphilis prevalence survey report. URL: http://www.doh.gov.za/docs/adendum-tables-f.html.<br />
18 Guay, L.A. et al. Intrapartum and neonatal single-dose nevirapine compared with zidovudine for prevention of mother-to-child transmission of HIV-1 in Kampala,<br />
Uganda: HIVNET 012 randomised trial. Lancet. 354 (9181): 795-802 (1999).<br />
19 This includes AZT from 28 weeks gestation and single dose of nevirapine during labour (or HAART if the CD4 count is below 250 or if the woman has stage IV disease.)<br />
Infants receive a single dose of nevirapine and AZT for 7 days or for 28 days if mother has not received adequate antenatal cover with ARVs.<br />
20 Lallemant, M. et al. Single-Dose Perinatal Nevirapine plus Standard Zidovudine to Prevent Mother-to-Child Transmission of HIV-1 in Thailand. N Engl J Med. 351 (3):<br />
217-228 (2004).<br />
21 Department of <strong>Health</strong>, Medical Research Council, OrcMacro. South Africa Demographic and <strong>Health</strong> Survey 2003. Pretoria: Department of <strong>Health</strong>; 2007.<br />
URL: http://www.doh.gov.za/docs/misc/sadhs-f.html.<br />
66
District view<br />
Overall there have been impressive improvements in HIV test uptake across the country<br />
with the national average increasing from 69% to 80%. All districts achieved a testing rate<br />
of more than 60% with the exception of Metsweding (GP) which had the lowest testing<br />
rate of 50% and eThekwini metro 2nd lowest at 52.1%. Nine districts across five provinces<br />
recorded testing rates above 100%, with the highest in Vhembe (LP) at 120%. Most of these<br />
are probably due to errors in the recording of the denominator (first antenatal visits). The<br />
rates above 100% will have led to an over estimate of the national testing uptake average<br />
of 80%.<br />
The improved testing rates overall are encouraging and suggest more effective screening<br />
of pregnant women and greater integration of HIV testing within antenatal care. Gauteng<br />
and KwaZulu-Natal provinces have the greatest differences between districts. In Gauteng,<br />
Sedibeng district achieved an uptake rate of 89% whilst Metsweding achieved only 50%.<br />
In KwaZulu-Natal, Umzinyathi achieved an uptake rate of 101% whilst eThekwini achieved<br />
only 52%.<br />
Map 13: Proportion of antenatal clients tested for HIV in South Africa, 2007/08<br />
Legend<br />
ANCTEST_07_08<br />
less than 60%<br />
60 - 69%<br />
70 - 79%<br />
80 - 89%<br />
90% and above<br />
Proportion ANC clients tested for HIV, 2007/08<br />
PROPORTION OF ANTENATAL CLIENTS TESTED FOR HIV<br />
67
Section A: <strong>Output</strong> <strong>Indicators</strong><br />
Figure 61: Proportion of antenatal clients tested for HIV by district, 2007/08<br />
Proportion antenatal clients tested for HIV by district, 2007/08<br />
Vhembe<br />
West Coast<br />
Eden<br />
Waterberg<br />
Central Karoo<br />
Ngaka Modiri Molema<br />
Pixley ka Seme<br />
Umzinyathi<br />
Uthukela<br />
Overberg<br />
Chris Hani<br />
Dr Kenneth Kaunda<br />
City of Cape Town<br />
Dr Ruth Segomotsi Mompati<br />
Fezile Dabi<br />
Alfred Nzo<br />
Amajuba<br />
O.R.Tambo<br />
Namakwa<br />
Xhariep<br />
Kgalagadi<br />
Sedibeng<br />
City of Johannesburg<br />
Siyanda<br />
Ugu<br />
iLembe<br />
Cacadu<br />
Ukhahlamba<br />
Amatole<br />
Capricorn<br />
Frances Baard<br />
Sisonke<br />
Cape Winelands<br />
Thabo Mofutsanyane<br />
Nelson Mandela Bay Metro<br />
Mopani<br />
Ehlanzeni<br />
Greater Sekhukhune<br />
Motheo<br />
Nkangala<br />
Lejweleputswa<br />
Zululand<br />
West Rand<br />
Gert Sibande<br />
Umkhanyakude<br />
UMgungundlovu<br />
Bojanala Platinum<br />
Ekurhuleni<br />
City of Tshwane<br />
Uthungulu<br />
eThekwini<br />
Metsweding<br />
SA average<br />
20 40 60 80 100 120<br />
Percentage<br />
Source: DHIS (2008)<br />
Provinces<br />
EC<br />
FS<br />
GP<br />
KZN<br />
LP<br />
MP<br />
NC<br />
NW<br />
WC<br />
Metro view<br />
The average HIV testing coverage rate for the metro districts was lower than the national<br />
average. Only two metro districts, City of Cape Town and City of Johannesburg achieved<br />
higher than the national average. The coverage in Ekurhuleni, Tshwane and especially<br />
eThekwini, with a 52% testing rate, is particularly concerning given the high numbers of<br />
women attending antenatal clinics in metro areas. These low rates result in many missed<br />
opportunities for women to access PMTCT services. It is a matter of urgency that testing<br />
rates in these metros are increased dramatically.<br />
68
Figure 62: Proportion of antenatal clients tested for HIV by metro district, 2007/08<br />
Proportion antenatal clients tested for HIV by metro district, 2007/08<br />
City of Cape Town<br />
City of Johannesburg<br />
Nelson Mandela Bay Metro<br />
Ekurhuleni<br />
City of Tshwane<br />
eThekwini<br />
SA average<br />
Metro average<br />
Provinces<br />
EC<br />
FS<br />
GP<br />
KZN<br />
LP<br />
MP<br />
NC<br />
NW<br />
WC<br />
Rural nodes<br />
20 40 60 80 100 120<br />
Percentage<br />
The rural districts had better testing rates than the metropolitan areas and the national<br />
average. None of the rural node districts had coverage rates of below 60% and nine<br />
achieved coverage of 80% or more. This is a very encouraging finding which indicates that<br />
programme improvements can be achieved even in less well-resourced areas. All of the<br />
Eastern Cape rural nodes had coverage rates of above 80%, while in KZN there was large<br />
variability.<br />
Figure 63: Proportion of antenatal clients tested for HIV by rural district, 2007/08<br />
Central Karoo<br />
Umzinyathi<br />
Chris Hani<br />
Alfred Nzo<br />
O.R.Tambo<br />
Kgalagadi<br />
Ukhahlamba<br />
Thabo Mofutsanyane<br />
Greater Sekhukhune<br />
Zululand<br />
Umkhanyakude<br />
Proportion antenatal clients tested for HIV by rural district, 2007/08<br />
Ugu<br />
Percentage<br />
SA average<br />
ISRDP average<br />
20 40 60 80 100 120<br />
Provinces<br />
EC<br />
FS<br />
GP<br />
KZN<br />
LP<br />
MP<br />
NC<br />
NW<br />
WC<br />
PROPORTION OF ANTENATAL CLIENTS TESTED FOR HIV<br />
Change and trends in proportion of clients tested for HIV<br />
Overall there have been impressive improvements in HIV testing rates across the country with the national average<br />
increasing from 69% to 80% in 2007/08. There were only seven districts whose testing uptake decreased from<br />
2006/07, most of which were small decreases in already well performing districts. In Dr Kenneth Kaunda (NW) and<br />
Sisonke (KZN) districts, the decrease has brought the uptake to below 100%. This is indicative of an improvement<br />
in accuracy of the data. Metsweding district has, except for the unusually high value in 2006/07, had consistently<br />
low rates. A rigorous assessment of the programme is needed to determine the reasons for low uptake and attention<br />
needs to be paid to the data quality.<br />
The metro districts also showed improvement especially in the City of Johannesburg (26 percentage points) and<br />
Ekurhuleni (15 percentage point increase). The improvements in the rural districts were marked with an overall<br />
improvement of 11 percentage points and the largest improvement occurring in Ugu (25 percentage points). Only one<br />
rural node district, Umkhanyakude, decreased its testing uptake from 77% to 69% which will need to be investigated<br />
by the district management team.<br />
69
Section A: <strong>Output</strong> <strong>Indicators</strong><br />
The consistent improvement in HIV testing across the districts is a very positive finding which indicates that attempts<br />
have been made to prioritise this programme and to integrate HIV testing within antenatal care. It is also an indication<br />
that, should improvements continue at the same rate, the National Strategic Plan target for antenatal HIV testing will<br />
be a realisable goal. The upward trends in the HIV testing rates from 2003/04 to 2007/08 in most of the districts are<br />
clearly illustrated in the trend graphs in Figure 6<strong>4.</strong><br />
Figure 64:<br />
Trends in the proportion of antenatal clients tested for HIV by province and district,<br />
2002/03 - 2007/08<br />
Annual trends: Proportion antenatal clients tested for HIV<br />
EC FS GP<br />
100<br />
50<br />
0<br />
KZN LP MP<br />
100<br />
Percentage<br />
50<br />
0<br />
NC<br />
NW<br />
WC<br />
100<br />
50<br />
0<br />
2002/03<br />
2003/04<br />
2004/05<br />
2005/06<br />
2006/07<br />
2007/08<br />
2002/03<br />
2003/04<br />
2004/05<br />
2005/06<br />
2006/07<br />
2007/08<br />
2002/03<br />
2003/04<br />
2004/05<br />
2005/06<br />
2006/07<br />
2007/08<br />
EC Alfred Nzo<br />
EC Amatole<br />
EC Cacadu<br />
EC Chris Hani<br />
EC Nelson Mandela<br />
EC O.R.Tambo<br />
EC Ukhahlamba<br />
FS Fezile Dabi<br />
FS Lejweleputswa<br />
FS Motheo<br />
FS T. Mofutsanyane<br />
FS Xhariep<br />
GP Ekurhuleni<br />
GP Johannesburg<br />
GP Metsweding<br />
GP Sedibeng<br />
GP Tshwane<br />
GP West Rand<br />
KZN Amajuba<br />
KZN eThekwini<br />
KZN iLembe<br />
KZN Sisonke<br />
KZN Ugu<br />
KZN UMgungundlovu<br />
KZN Umkhanyakude<br />
KZN Umzinyathi<br />
Year<br />
KZN Uthukela<br />
KZN Uthungulu<br />
KZN Zululand<br />
LP Capricorn<br />
LP Gr Sekhukhune<br />
LP Mopani<br />
LP Vhembe<br />
LP Waterberg<br />
MP Ehlanzeni<br />
MP Gert Sibande<br />
MP Nkangala<br />
NC Frances Baard<br />
NC Kgalagadi<br />
NC Namakwa<br />
NC Pixley ka Seme<br />
NC Siyanda<br />
NW Bojanala Platinum<br />
NW Kenneth Kaunda<br />
NW NM Molema<br />
NW Ruth S. Mompati<br />
WC Cape Town<br />
WC Cape Winelands<br />
WC Central Karoo<br />
WC Eden<br />
WC Overberg<br />
WC West Coast<br />
70
Figure 65: Change in the proportion of antenatal clients tested for HIV by district, 2006/07 - 2007/08<br />
Change in proportion antenatal clients tested for HIV by district, 2006/07−2007/08<br />
Vhembe<br />
Eden<br />
City of Johannesburg<br />
Ugu<br />
Cacadu<br />
Waterberg<br />
UMgungundlovu<br />
Lejweleputswa<br />
Gert Sibande<br />
Central Karoo<br />
Chris Hani<br />
Ngaka Modiri Molema<br />
Thabo Mofutsanyane<br />
Umzinyathi<br />
West Coast<br />
Nkangala<br />
Mopani<br />
Ekurhuleni<br />
Kgalagadi<br />
Amajuba<br />
Xhariep<br />
Ehlanzeni<br />
Amatole<br />
Ukhahlamba<br />
O.R.Tambo<br />
Uthungulu<br />
Pixley ka Seme<br />
Frances Baard<br />
Namakwa<br />
Greater Sekhukhune<br />
Dr Ruth Segomotsi Mompati<br />
Fezile Dabi<br />
Bojanala Platinum<br />
iLembe<br />
Uthukela<br />
Zululand<br />
Nelson Mandela Bay Metro<br />
Siyanda<br />
eThekwini<br />
Sedibeng<br />
Motheo<br />
West Rand<br />
Alfred Nzo<br />
Capricorn<br />
Overberg<br />
City of Cape Town<br />
City of Tshwane<br />
Cape Winelands<br />
Umkhanyakude<br />
Dr Kenneth Kaunda<br />
Metsweding<br />
Sisonke<br />
SA average<br />
Provinces<br />
EC<br />
FS<br />
GP<br />
KZN<br />
LP<br />
MP<br />
NC<br />
NW<br />
WC<br />
PROPORTION OF ANTENATAL CLIENTS TESTED FOR HIV<br />
−40 −20 0 20<br />
Percentage points<br />
Source: DHIS (2008)<br />
71
Section A: <strong>Output</strong> <strong>Indicators</strong><br />
<strong>4.</strong><strong>4.</strong>2 HIV Prevalence amongst antenatal clients tested<br />
The national antenatal sero-prevalence survey is a representative sample of antenatal clients tested in South Africa<br />
is run each year. The results show the proportion of pregnant women tested for HIV who have a positive result. The<br />
most recent estimate of national antenatal HIV prevalence from the national antenatal survey in 2007 was 28% 22<br />
(with age weighting).<br />
In 2006, the annual HIV sero-prevalence survey conducted by the national DoH was disaggregated to district level<br />
for the first time. It was able to be disaggregated because of an increased sample size. The results of the 2007<br />
survey are included in this Barometer as part of an attempt to present the most reliable and up to date information<br />
that is available for individual districts. There have been questions about how the provincial survey estimates were<br />
calculated 23 . An addendum to the antenatal survey results was released on 12 May revising the methodology and<br />
values of the survey results with no age weighting. These new values have been included in the Excel data file that<br />
is included in the CD that comes with this publication, but it was too late to update all the graphs and figures in<br />
this publication.<br />
District view<br />
Map 14:<br />
The prevalence rates from the national survey were generally higher than those recorded<br />
through the DHIS, except in the Western Cape where the national survey estimate of<br />
prevalence (13%) was very similar to the DHIS prevalence (14%). The largest difference<br />
between the DHIS (26%) and the national survey (34%) was found in the Free State.<br />
In both the national survey and the DHIS data the Northern Cape, Limpopo and the<br />
Western Cape had antenatal HIV prevalence rates below 20%. Gauteng, KwaZulu-Natal<br />
and the Free State were all above 30% in the national survey. A few provinces had large<br />
variations between districts, most notably the Eastern Cape with a prevalence of 15% in<br />
Cacadu and 30% in Ukhahlamba. In Limpopo, Vhembe district had a prevalence of 15%<br />
whilst Waterberg was 25% and in the Western Cape the West Coast had a prevalence of<br />
10% whilst the Central Karoo had a prevalence of 24%.<br />
HIV prevalence among antenatal clients tested in South Africa from the national antenatal<br />
sero-prevalence survey, 2007.<br />
HIV prevalence reflecting the antenatal survey data, 2007<br />
22 National Department of <strong>Health</strong>. The National HIV and Syphilis sero-prevalence survey 2007. Department of <strong>Health</strong> 2008.<br />
URL: http://www.doh.gov.za/docs/misc-f.html. Addendum of the published 2007 National HIV and Syphilis prevalence survey report is available at<br />
URL: http://www.doh.gov.za/docs/adendum-tables-f.html<br />
23 Dorrington R, Bourne D. Has HIV prevalence peaked in South Africa? Can the report on the latest antenatal survey be trusted to answer this question? S Afr Med J. 2008;<br />
98: 754-5. URL: http://www.samj.org.za/<br />
72<br />
Legend<br />
DOH_ANCHIV_07<br />
less than 10%<br />
10 - 19%<br />
20 - 29%<br />
30 - 39%<br />
40% and above
Figure 66:<br />
HIV prevalence amongst antenatal clients tested by district (national antenatal seroprevalence<br />
survey), 2007 24<br />
HIV prevalence among antenatal clients tested (survey) by district, 2007<br />
Namakwa<br />
West Coast<br />
Siyanda<br />
Cape Winelands<br />
Eden<br />
Pixley ka Seme<br />
Cacadu<br />
Vhembe<br />
City of Cape Town<br />
Kgalagadi<br />
Overberg<br />
Capricorn<br />
Greater Sekhukhune<br />
Alfred Nzo<br />
Frances Baard<br />
Central Karoo<br />
Mopani<br />
Xhariep<br />
Waterberg<br />
Chris Hani<br />
Amatole<br />
City of Tshwane<br />
Dr Ruth Segomotsi Mompati<br />
Ngaka Modiri Molema<br />
O.R.Tambo<br />
Motheo<br />
Nkangala<br />
Nelson Mandela Bay Metro<br />
Ukhahlamba<br />
City of Johannesburg<br />
Thabo Mofutsanyane<br />
Umzinyathi<br />
West Rand<br />
Dr Kenneth Kaunda<br />
Metsweding<br />
Fezile Dabi<br />
Bojanala Platinum<br />
Ekurhuleni<br />
Sedibeng<br />
Sisonke<br />
Zululand<br />
Uthungulu<br />
Ehlanzeni<br />
Uthukela<br />
Lejweleputswa<br />
Ugu<br />
Amajuba<br />
Umkhanyakude<br />
Gert Sibande<br />
UMgungundlovu<br />
iLembe<br />
eThekwini<br />
SA average<br />
Provinces<br />
EC<br />
FS<br />
GP<br />
KZN<br />
LP<br />
MP<br />
NC<br />
NW<br />
WC<br />
HIV PREVALENCE AMONGST ANTENATAL CLIENTS TESTED<br />
10 20 30 40<br />
Percentage<br />
Source: Antenatal Survey<br />
Metro view<br />
Antenatal HIV prevalence rates in the metro districts range from 16% in the City of Cape<br />
Town 25 to 42% in eThekwini. All of the metro districts except the City of Cape Town had<br />
prevalence rates above 25%. The largest change in prevalence from 2006 in a metro<br />
district was in Nelson Mandela Bay Metro which dropped by four percentage points.<br />
24 As the survey conducted by the Department of <strong>Health</strong> is based on a sample of all women attending antenatal clinic there is some uncertainty about the exact results.<br />
The bar | | indicates the range of the HIV prevalence in which the survey confidently expects the “real value” to be contained (95% confidence interval).<br />
25 Although the overall prevalence in the City of Cape Town is low, it has a wide variation of prevalence across the metro which is not reflected here, but can be<br />
accessed in the following presentation ‘Western Cape Burden of Disease: HIV and Tuberculosis’ at:<br />
URL: http://www.capegateway.gov.za/other/2007/8/bod_hiv_and_tb_workgroup_2.ppt<br />
73
Section A: <strong>Output</strong> <strong>Indicators</strong><br />
Figure 67:<br />
HIV prevalence among antenatal clients tested by metro district, (national antenatal seroprevalence<br />
survey), 2007<br />
HIV prevalence among antenatal clients tested (survey) by metro district, 2007<br />
City of Cape Town<br />
City of Tshwane<br />
Nelson Mandela Bay Metro<br />
City of Johannesburg<br />
Ekurhuleni<br />
eThekwini<br />
SA average<br />
Provinces<br />
EC<br />
FS<br />
GP<br />
KZN<br />
LP<br />
MP<br />
NC<br />
NW<br />
WC<br />
10 20 30 40<br />
Percentage<br />
Rural nodes The antenatal HIV prevalence in the rural nodes ranges from 17% in Kgalagadi to 40%<br />
in Umkhanyakude. The largest change in prevalence in the rural districts occurred in the<br />
Central Karoo which increased by 15 percentage points 26 .<br />
Figure 68:<br />
HIV prevalence among antenatal clients tested by rural district, (national antenatal seroprevalence<br />
survey), 2007.<br />
HIV prevalence among antenatal clients tested (survey) by rural district, 2007<br />
Kgalagadi<br />
Greater Sekhukhune<br />
Alfred Nzo<br />
Central Karoo<br />
Chris Hani<br />
O.R.Tambo<br />
Ukhahlamba<br />
Thabo Mofutsanyane<br />
Umzinyathi<br />
Zululand<br />
Ugu<br />
Umkhanyakude<br />
Percentage<br />
SA average<br />
10 20 30 40<br />
Provinces<br />
EC<br />
FS<br />
GP<br />
KZN<br />
LP<br />
MP<br />
NC<br />
NW<br />
WC<br />
Change and trends in HIV prevalence amongst antenatal clients tested<br />
HIV prevalence amongst antenatal clients tested (DHIS) increased marginally between 2006/07 and 2007/08 from<br />
23.8% to 2<strong>4.</strong>4%. Figure 69 shows the trends from 2003/04 to 2007/08 for districts by province.<br />
26 This should be taken with caution as it could be due to sampling differences between the two surveys in a very low population district; the 95% confidence intervals<br />
are wide, and do overlap slightly. The routine data do not suggest any dramatic increases in prevalence in this district.<br />
74
Figure 69:<br />
Trends in the HIV prevalence in ANC clients tested by province and district 27 (DHIS data),<br />
2003/04 - 2007/08<br />
Annual trends: HIV prevalence among antenatal clients tested<br />
EC FS GP<br />
50<br />
40<br />
30<br />
20<br />
Percentage<br />
10<br />
50<br />
40<br />
30<br />
20<br />
10<br />
50<br />
40<br />
30<br />
20<br />
10<br />
2003/04<br />
2004/05<br />
EC Alfred Nzo<br />
EC Amatole<br />
EC Cacadu<br />
EC Chris Hani<br />
EC Nelson Mandela<br />
EC O.R.Tambo<br />
EC Ukhahlamba<br />
FS Fezile Dabi<br />
FS Lejweleputswa<br />
FS Motheo<br />
FS T. Mofutsanyane<br />
FS Xhariep<br />
GP Ekurhuleni<br />
KZN LP MP<br />
NC<br />
2005/06<br />
2006/07<br />
2007/08<br />
2003/04<br />
2004/05<br />
GP Johannesburg<br />
GP Metsweding<br />
GP Sedibeng<br />
GP Tshwane<br />
GP West Rand<br />
KZN Amajuba<br />
KZN eThekwini<br />
KZN iLembe<br />
KZN Sisonke<br />
KZN Ugu<br />
KZN UMgungundlovu<br />
KZN Umkhanyakude<br />
KZN Umzinyathi<br />
NW<br />
2005/06<br />
Year<br />
2006/07<br />
2007/08<br />
KZN Uthukela<br />
KZN Uthungulu<br />
KZN Zululand<br />
LP Capricorn<br />
LP Gr Sekhukhune<br />
LP Mopani<br />
LP Vhembe<br />
LP Waterberg<br />
MP Ehlanzeni<br />
MP Gert Sibande<br />
MP Nkangala<br />
NC Frances Baard<br />
NC Kgalagadi<br />
2003/04<br />
2004/05<br />
WC<br />
2005/06<br />
2006/07<br />
2007/08<br />
NC Namakwa<br />
NC Pixley ka Seme<br />
NC Siyanda<br />
NW Bojanala Platinum<br />
NW Kenneth Kaunda<br />
NW NM Molema<br />
NW Ruth S. Mompati<br />
WC Cape Town<br />
WC Cape Winelands<br />
WC Central Karoo<br />
WC Eden<br />
WC Overberg<br />
WC West Coast<br />
HIV PREVALENCE AMONGST ANTENATAL CLIENTS TESTED<br />
<strong>4.</strong><strong>4.</strong>3 Nevirapine uptake rate among pregnant HIV positive women<br />
This indicator measures the proportion of HIV positive pregnant woman who receive a nevirapine 28 dose during either<br />
antenatal care or in labour. This is an extremely important component of the PMTCT package since antiretroviral<br />
prophylaxis has a large impact on reducing early mother to child transmission of HIV.<br />
There has been an overall increase in the coverage of nevirapine from a national coverage of 65% in 2006/07 to<br />
76% in 2007/08. While this is encouraging, it however still falls short of the National Strategic Plan target for 2011<br />
which is for 95% of known HIV positive women to receive nevirapine (+AZT).<br />
27 These trend graphs represent values from the DHIS which differ from the National Survey data but are useful to use to represent trends which are in essence the same<br />
in both. Note however that the 2007/08 values will not correspond to Figure 66: HIV prevalence among antenatal clients tested by district for the national antenatal<br />
sero-prevalence survey, 2007.<br />
28 Subsequent to the dates for the data in this barometer, viz April 07 to March 08, the policy for PMTCT was extended in March 2008 to dual therapy and to include AZT.<br />
75
Section A: <strong>Output</strong> <strong>Indicators</strong><br />
Collection of data on nevirapine coverage is particularly difficult due to the fact that the dose can be dispensed<br />
either in the antenatal clinic or the labour ward. Aggregation of data, which is not linked to individual patients,<br />
from these two settings has proven difficult. Furthermore, some HIV positive women may be reluctant to disclose<br />
their HIV status within labour ward settings and therefore may not be given a nevirapine dose or may take a dose<br />
without informing staff, hence the dose would not be recorded in the routine records. These challenges can result<br />
in both under and over (double counting) recording of nevirapine doses dispensed. It is expected that coverage of<br />
this component of the programme will improve with the introduction of dual therapy since it will no longer be an<br />
‘all or nothing’ intervention.<br />
District view<br />
There was a large variation in nevirapine coverage across the districts with the lowest rate<br />
of 12% in Lejweleputswa (FS) and the highest of 108% in Uthukela (KZN).<br />
One of the major issues with this indicator is the lack of good quality information. Close<br />
scrutiny of the DHIS data from 2003/04 highlighted that generally the data for most of the<br />
country seems unreliable, with little internal consistency and there seem to be problems<br />
with both the numerators and denominators.<br />
Specifically the Free State showed declining nevirapine coverage rates for the second<br />
consecutive year. All five districts were below 40%. However, many facilities did not have<br />
numerator data after January 2007, so this is mostly a data quality issue. In Mpumalanga<br />
most numerators were missing for the last few months. In some Northern Cape districts,<br />
such as Namakwa, small numbers resulted in large swings in the monthly indicator values,<br />
making the trends difficult to interpret.<br />
The Eastern Cape had fairly large variations between districts with Alfred Nzo at 46%<br />
and Nelson Mandela Bay metro at 89%. A similar situation was found in Gauteng with<br />
Metsweding at 60% and Sedibeng at 96%.<br />
Considering the wide fluctuations and poor quality of the data across the years and districts,<br />
it is not possible to draw any definite conclusions or make strategic decisions based on these<br />
data, other than that management from facility level upwards need to take responsibility for<br />
regular monitoring of the data to ensure continuous quality improvement.<br />
Map 15: Nevirapine uptake rate among pregnant HIV positive women in South Africa, 2007/08<br />
Nevirapine uptake rate among pregnant HIV+ve women, 2007/08<br />
Legend<br />
NVPM_07<br />
less than 30%<br />
30 - 59%<br />
60 - 69%<br />
70 - 79%<br />
80 - 89%<br />
90% and above<br />
76
Figure 70: Nevirapine uptake rate among pregnant women with HIV by district, 2007/08<br />
Nevirapine uptake rate among pregnant women with HIV by district, 2007/08<br />
Uthukela<br />
Amajuba<br />
Kgalagadi<br />
UMgungundlovu<br />
iLembe<br />
Gert Sibande<br />
Sisonke<br />
Sedibeng<br />
Ehlanzeni<br />
Siyanda<br />
Ugu<br />
Ekurhuleni<br />
Nelson Mandela Bay Metro<br />
City of Tshwane<br />
City of Johannesburg<br />
Frances Baard<br />
Umkhanyakude<br />
Uthungulu<br />
Zululand<br />
Cacadu<br />
Ngaka Modiri Molema<br />
Nkangala<br />
eThekwini<br />
Dr Kenneth Kaunda<br />
Umzinyathi<br />
Cape Winelands<br />
Greater Sekhukhune<br />
West Rand<br />
Chris Hani<br />
City of Cape Town<br />
Capricorn<br />
Bojanala Platinum<br />
Vhembe<br />
Mopani<br />
Ukhahlamba<br />
West Coast<br />
Overberg<br />
Metsweding<br />
Amatole<br />
Eden<br />
Namakwa<br />
Pixley ka Seme<br />
Central Karoo<br />
Waterberg<br />
Dr Ruth Segomotsi Mompati<br />
O.R.Tambo<br />
Alfred Nzo<br />
Fezile Dabi<br />
Thabo Mofutsanyane<br />
Motheo<br />
Xhariep<br />
Lejweleputswa<br />
SA average<br />
Provinces<br />
EC<br />
FS<br />
GP<br />
KZN<br />
LP<br />
MP<br />
NC<br />
NW<br />
WC<br />
NEVIRAPINE UPTAKE RATE AMONG PREGNANT HIV POSITIVE WOMEN<br />
20 40 60 80 100<br />
Percentage<br />
Source: DHIS (2008)<br />
Metro view<br />
The metro districts all achieved a nevirapine coverage above 60% with the highest being<br />
Ekurhuleni at 90%. The average for all six metro areas of 82% was higher than the national<br />
average of 76%. The City of Cape Town, which has reportedly one of the best PMTCT<br />
programmes in the country, with a nevirapine uptake rate of 65.3%, is unlikely to be<br />
accurate and is almost certainly due to poor data recording/capturing/reporting.<br />
77
Section A: <strong>Output</strong> <strong>Indicators</strong><br />
Figure 71: Nevirapine uptake rate among pregnant women with HIV by metro district, 2007/08<br />
Nevirapine uptake rate among pregnant women with HIV by metro district, 2007/08<br />
Ekurhuleni<br />
Nelson Mandela Bay Metro<br />
City of Tshwane<br />
City of Johannesburg<br />
eThekwini<br />
City of Cape Town<br />
SA average<br />
Metro average<br />
20 40 60 80 100<br />
Percentage<br />
Provinces<br />
EC<br />
FS<br />
GP<br />
KZN<br />
LP<br />
MP<br />
NC<br />
NW<br />
WC<br />
Rural Nodes<br />
Nevirapine coverage in the rural districts varied widely from 25% in Thabo Mofutsanyane<br />
district of the Free State to 100% in Kgalagadi district of the Northern Cape. Coverage in<br />
the KZN rural districts had improved with all four being above 70%. However, these data<br />
need to be viewed with caution as there were several months where the monthly rates<br />
exceeded 100%. Overall the nevirapine coverage for the 12 rural districts was 68% which is<br />
lower than the national average of 76%. Coverage in these districts will need to be greatly<br />
improved in order to reach the target of the National Strategic Plan.<br />
Figure 72: Nevirapine uptake rate among pregnant women with HIV by rural district, 2007/08<br />
Nevirapine uptake rate among pregnant women with HIV by rural district, 2007/08<br />
Kgalagadi<br />
Ugu<br />
Umkhanyakude<br />
Zululand<br />
Umzinyathi<br />
Greater Sekhukhune<br />
Chris Hani<br />
Ukhahlamba<br />
Central Karoo<br />
O.R.Tambo<br />
Alfred Nzo<br />
Thabo Mofutsanyane<br />
SA average<br />
ISRDP average<br />
20 40 60 80 100<br />
Percentage<br />
Provinces<br />
EC<br />
FS<br />
GP<br />
KZN<br />
LP<br />
MP<br />
NC<br />
NW<br />
WC<br />
Change and trends in nevirapine uptake rate of pregnant HIV positive women<br />
Nevirapine coverage has increased overall between 2006/07 and 2007/08 from 65% to 76%. The best improvements<br />
were seen in KwaZulu-Natal and the North West where all of the districts showed an increase from the last year. It<br />
is concerning that all of the districts in the Free State showed a substantial decrease in 2007/08 to extremely low<br />
levels of coverage which are caused by missing data. The province should investigate the data quality of this indicator<br />
carefully.<br />
78
Figure 73:<br />
Trend in nevirapine uptake rate among pregnant women with HIV by province and district,<br />
2003/04 - 2007/08<br />
Annual trends: Nevirapine uptake rate among pregnant women with HIV<br />
EC FS GP<br />
100<br />
Percentage<br />
80<br />
60<br />
40<br />
20<br />
0<br />
100<br />
80<br />
60<br />
40<br />
20<br />
0<br />
100<br />
80<br />
60<br />
40<br />
20<br />
0<br />
2002/03<br />
2003/04<br />
KZN LP MP<br />
NC<br />
NW<br />
WC<br />
2004/05<br />
2005/06<br />
2006/07<br />
2007/08<br />
2002/03<br />
2003/04<br />
2004/05<br />
2005/06<br />
2006/07<br />
2007/08<br />
2002/03<br />
2003/04<br />
2004/05<br />
2005/06<br />
2006/07<br />
2007/08<br />
NEVIRAPINE UPTAKE RATE AMONG PREGNANT HIV POSITIVE WOMEN<br />
EC Alfred Nzo<br />
EC Amatole<br />
EC Cacadu<br />
EC Chris Hani<br />
EC Nelson Mandela<br />
EC O.R.Tambo<br />
EC Ukhahlamba<br />
FS Fezile Dabi<br />
FS Lejweleputswa<br />
FS Motheo<br />
FS T. Mofutsanyane<br />
FS Xhariep<br />
GP Ekurhuleni<br />
GP Johannesburg<br />
GP Metsweding<br />
GP Sedibeng<br />
GP Tshwane<br />
GP West Rand<br />
KZN Amajuba<br />
KZN eThekwini<br />
KZN iLembe<br />
KZN Sisonke<br />
KZN Ugu<br />
KZN UMgungundlovu<br />
KZN Umkhanyakude<br />
KZN Umzinyathi<br />
Year<br />
KZN Uthukela<br />
KZN Uthungulu<br />
KZN Zululand<br />
LP Capricorn<br />
LP Gr Sekhukhune<br />
LP Mopani<br />
LP Vhembe<br />
LP Waterberg<br />
MP Ehlanzeni<br />
MP Gert Sibande<br />
MP Nkangala<br />
NC Frances Baard<br />
NC Kgalagadi<br />
NC Namakwa<br />
NC Pixley ka Seme<br />
NC Siyanda<br />
NW Bojanala Platinum<br />
NW Kenneth Kaunda<br />
NW NM Molema<br />
NW Ruth S. Mompati<br />
WC Cape Town<br />
WC Cape Winelands<br />
WC Central Karoo<br />
WC Eden<br />
WC Overberg<br />
WC West Coast<br />
79
Section A: <strong>Output</strong> <strong>Indicators</strong><br />
<strong>4.</strong><strong>4.</strong>4 Nevirapine uptake rate among babies born to HIV positive pregnant women<br />
The nevirapine uptake rate among babies measures the percentage of babies of HIV positive women who received<br />
nevirapine within 72 hours of birth, out of the number of live births in facilities to HIV positive women.<br />
There were serious data quality problems with the nevirapine uptake rate for newborns and this is occurring systematically<br />
in almost all the districts. In most years the uptake rate has been around 100%. The denominator used to calculate this<br />
indicator (live births to HIV positive women) generally gives an inflated picture of nevirapine coverage to babies as far<br />
fewer deliveries to HIV positive women are recorded each month compared with the number of women testing HIV positive.<br />
There are also substantial differences in this discrepancy from year to year, so the effect of the bias is not consistent,<br />
with much higher denominators around 2006/07, resulting in a dip in the indicator values over the same period. The low<br />
recorded number of live births to HIV positive women suggests that either many HIV positive women are delivering at home<br />
and are therefore not recorded in facility delivery records, or that HIV positive women are not identified in labour and are<br />
therefore not recorded as such in delivery registers. The first explanation is unlikely given that in South Africa overall 91%<br />
of births are assisted by a trained health care provider (SADHS 2003). The only year when the denominator is thought to<br />
be realistic was in 2006/07 when 81% of HIV positive mothers were identified on delivery, and the nevirapine update rate<br />
among newborn babies was 57.3%.<br />
The following table shows the national values for the data elements used in the PMTCT indicators, illustrating the problem<br />
of the very low denominators (live births) for this indicator. Major outliers and sections of data with completely missing<br />
denominators have been excluded from the original data.<br />
2003/04 2004/05 2005/06 2006/07 2007/08<br />
ANC 1st visits 900 130 1 095 064 1 229 251 1 144 002 1 170 998<br />
ANC clients tested 198 508 451 829 613 255 791 396 931 789<br />
HIV test ANC rate 22.1 41.3 49.9 69.2 79.6<br />
ANC clients HIV+ 59 525 131 512 170 816 201 015 229 642<br />
HIV prevalence 29.8 29.0 27.7 23.8 2<strong>4.</strong>4<br />
NVP dose to woman 21 422 58 132 96 271 129 672 172 066<br />
NVP uptake mothers 40.5 4<strong>4.</strong>2 56.4 6<strong>4.</strong>5 76.1<br />
Live births to HIV+ women 4 127 16 854 41 391 163 601 105 280<br />
NVP dose to baby 4 283 16 345 40 379 93 794 107 673<br />
NVP newborns 103.8 97.0 97.6 57.3 102.3<br />
Proportion of HIV positive mothers identified<br />
on delivery<br />
6.9 12.8 2<strong>4.</strong>2 81.4 45.8<br />
In March 2008, the infant component of the antiretroviral regimen was changed so that it now includes one week<br />
of AZT to infants in addition to the single dose of nevirapine. This change in the protocol did not affect the indicator<br />
in this Barometer.<br />
District view<br />
The nevirapine uptake of babies was generally high with a national average of 102.3% with<br />
none of the districts being below 80%. More than half (28) of the districts had coverage<br />
levels of 100% or more including all of the districts in Mpumalanga. This finding indicates<br />
that there is most likely under recording of live births which has led to an inflated indicator<br />
(i.e. more nevirapine doses dispensed than live births recorded).<br />
80
Figure 74: Nevirapine uptake rate among babies born to women with HIV by district, 2007/08<br />
Nevirapine uptake rate among babies born to women with HIV by district, 2007/08<br />
Nelson Mandela Bay Metro<br />
eThekwini<br />
Gert Sibande<br />
Nkangala<br />
Amajuba<br />
Ehlanzeni<br />
Frances Baard<br />
Thabo Mofutsanyane<br />
City of Johannesburg<br />
Motheo<br />
Uthukela<br />
City of Tshwane<br />
Bojanala Platinum<br />
Sedibeng<br />
Zululand<br />
Kgalagadi<br />
Dr Ruth Segomotsi Mompati<br />
Capricorn<br />
Lejweleputswa<br />
Greater Sekhukhune<br />
Metsweding<br />
Central Karoo<br />
Uthungulu<br />
Waterberg<br />
Mopani<br />
Dr Kenneth Kaunda<br />
Xhariep<br />
Cacadu<br />
West Coast<br />
Vhembe<br />
Eden<br />
Ekurhuleni<br />
Siyanda<br />
Pixley ka Seme<br />
West Rand<br />
Ngaka Modiri Molema<br />
iLembe<br />
City of Cape Town<br />
Cape Winelands<br />
Overberg<br />
Fezile Dabi<br />
O.R.Tambo<br />
Umzinyathi<br />
Chris Hani<br />
Namakwa<br />
UMgungundlovu<br />
Ugu<br />
Amatole<br />
Ukhahlamba<br />
Umkhanyakude<br />
Sisonke<br />
Alfred Nzo<br />
SA average<br />
50 100 150<br />
Percentage<br />
Provinces<br />
EC<br />
FS<br />
GP<br />
KZN<br />
LP<br />
MP<br />
NC<br />
NW<br />
WC<br />
NEVIRAPINE UPTAKE RATE AMONG BABIES BORN TO HIV POSITIVE WOMEN<br />
Source: DHIS (2008)<br />
Metro view<br />
All of the metro districts except for two, reported nevirapine coverage to babies of above<br />
100%. Nelson Mandela Bay and eThekwini had rates of 143% and 136% respectively. These<br />
are extreme over-estimates of the true coverage and these districts should examine the data<br />
closely to determine where the errors have occurred. Scrutiny of the detailed underlying<br />
data for KZN in general revealed huge outliers, variations and missing denominators.<br />
81
Section A: <strong>Output</strong> <strong>Indicators</strong><br />
Figure 75: Nevirapine uptake rate among babies born to women with HIV by metro district, 2007/08<br />
Nevirapine uptake rate among babies born to women with HIV by metro district, 2007/08<br />
Nelson Mandela Bay Metro<br />
eThekwini<br />
City of Johannesburg<br />
City of Tshwane<br />
Ekurhuleni<br />
City of Cape Town<br />
SA average<br />
Metro average<br />
50 100 150<br />
Percentage<br />
Provinces<br />
EC<br />
FS<br />
GP<br />
KZN<br />
LP<br />
MP<br />
NC<br />
NW<br />
WC<br />
Rural Nodes<br />
Nevirapine coverage to infants in the rural node districts ranged from 80% in Alfred Nzo<br />
to 105% in Thabo Mofutsanyane. Five of these districts reported coverage rates of 100% or<br />
more.<br />
Figure 76: Nevirapine uptake rate among babies born to women with HIV by rural district, 2007/08<br />
Nevirapine uptake rate among babies born to women with HIV by rural district, 2007/08<br />
Thabo Mofutsanyane<br />
Zululand<br />
Kgalagadi<br />
Greater Sekhukhune<br />
Central Karoo<br />
O.R.Tambo<br />
Umzinyathi<br />
Chris Hani<br />
Ugu<br />
Ukhahlamba<br />
Umkhanyakude<br />
Alfred Nzo<br />
SA average<br />
ISRDP average<br />
50 100 150<br />
Percentage<br />
Provinces<br />
EC<br />
FS<br />
GP<br />
KZN<br />
LP<br />
MP<br />
NC<br />
NW<br />
WC<br />
Change and trends in nevirapine uptake rate among babies born to women with HIV<br />
Although at face value there was overall improvement in this indicator from 2006/07 with all districts except those<br />
in the Western Cape showing increases in coverage, in reality the improvement is much smaller because of the data<br />
quality problems discussed in the beginning of this section. In the Western Cape the decreases most likely reflect<br />
improvements in data quality since all of the districts reported coverage rates of 100% or more in the previous<br />
period. There has been an overall increase in the number of nevirapine doses given, however until the data quality<br />
is addressed it will be difficult to determine the actual coverage levels. It will be important to monitor this indicator<br />
with the implementation of the new protocol to determine if this leads to improvements in both the quality of data<br />
and coverage.<br />
82
Figure 77:<br />
Trends in nevirapine uptake rate among babies born to women with HIV by province and<br />
district, 2003/04 - 2007/08<br />
Annual trends: Nevirapine uptake rate among babies born to women with HIV<br />
EC FS GP<br />
Percentage<br />
300<br />
200<br />
100<br />
0<br />
300<br />
200<br />
100<br />
0<br />
300<br />
200<br />
100<br />
0<br />
2002/03<br />
2003/04<br />
2004/05<br />
EC Alfred Nzo<br />
EC Amatole<br />
EC Cacadu<br />
EC Chris Hani<br />
EC Nelson Mandela<br />
EC O.R.Tambo<br />
EC Ukhahlamba<br />
FS Fezile Dabi<br />
FS Lejweleputswa<br />
FS Motheo<br />
FS T. Mofutsanyane<br />
FS Xhariep<br />
GP Ekurhuleni<br />
KZN LP MP<br />
NC<br />
2005/06<br />
2006/07<br />
2007/08<br />
2002/03<br />
2003/04<br />
GP Johannesburg<br />
GP Metsweding<br />
GP Sedibeng<br />
GP Tshwane<br />
GP West Rand<br />
KZN Amajuba<br />
KZN eThekwini<br />
KZN iLembe<br />
KZN Sisonke<br />
KZN Ugu<br />
KZN UMgungundlovu<br />
KZN Umkhanyakude<br />
KZN Umzinyathi<br />
2004/05<br />
NW<br />
2005/06<br />
Year<br />
2006/07<br />
2007/08<br />
2002/03<br />
KZN Uthukela<br />
KZN Uthungulu<br />
KZN Zululand<br />
LP Capricorn<br />
LP Gr Sekhukhune<br />
LP Mopani<br />
LP Vhembe<br />
LP Waterberg<br />
MP Ehlanzeni<br />
MP Gert Sibande<br />
MP Nkangala<br />
NC Frances Baard<br />
NC Kgalagadi<br />
2003/04<br />
2004/05<br />
WC<br />
2005/06<br />
2006/07<br />
2007/08<br />
NC Namakwa<br />
NC Pixley ka Seme<br />
NC Siyanda<br />
NW Bojanala Platinum<br />
NW Kenneth Kaunda<br />
NW NM Molema<br />
NW Ruth S. Mompati<br />
WC Cape Town<br />
WC Cape Winelands<br />
WC Central Karoo<br />
WC Eden<br />
WC Overberg<br />
WC West Coast<br />
NEVIRAPINE UPTAKE RATE AMONG BABIES BORN TO HIV POSITIVE WOMEN<br />
83
Section A: <strong>Output</strong> <strong>Indicators</strong><br />
<strong>4.</strong>5 Primary <strong>Health</strong> Care Utilisation Rate<br />
Fiorenza Monticelli<br />
The primary health care utilisation rate indictor measures the average number of visits per person per year to a<br />
public PHC facility. The average utilisation of primary health care services in SA in 2007/08 was 2.2 visits per<br />
person which is a decrease of 0.1 visits per person over the last year, despite an average increased spending (PCE)<br />
of R27 in real terms per person on non-hospital PHC. This decrease is quite likely due to the effect of the public<br />
sector strike in June 2007, as the average utilisation is 2.3 when data for this month are excluded. The national<br />
target of 3.5 was reached by only a handful of districts in 2007/08, of which three where in the Western Cape<br />
province.<br />
District view<br />
Figure 78 shows the range of utilisation rates among the districts from a low of 1.1 visits<br />
per person in Metsweding (GP) to a high of <strong>4.</strong>3 in the Central Karoo (WC), a rural district<br />
of SA. Four of the six districts in Gauteng ranked within the ten lowest utilisation rates in<br />
the country and four of the six districts in the Western Cape among the ten highest. Five<br />
districts, West Coast, Eden and Central Karoo (WC), Vhembe (LP) and Pixley ka Seme<br />
(NC) achieved utilisation rates higher than the national target. Most of the districts in the<br />
Northern Cape, fell within the top third of utilisation rates in the country and the very low<br />
value for Kgalagadi is clearly a data error caused by missing data for many of the facilities<br />
in that district between January to March 2008. There was also a wide intra-provincial<br />
variation between districts in the Eastern Cape with a high of 3.4 visits per year for Cacadu<br />
and a low of 1.9 for O.R. Tambo. Similarly in the Western Cape and Limpopo provinces<br />
there was an almost two-fold difference between the highest and lowest utilisation rates,<br />
whilst in KwaZulu-Natal, Mpumalanga and Gauteng, the utlisation rates across the districts<br />
did not vary greatly.<br />
Map 16: Primary health care utilisation rate in South Africa, 2007/08<br />
PHC utilisation rate, 2007/08<br />
Legend<br />
PHC_utilisation_07<br />
under 1.9<br />
2.0 - 2.4<br />
2.5 - 2.9<br />
3.0 - 3.4<br />
3.5 and above<br />
84
Figure 78: Primary health care utilisation rate by district, 2007/08<br />
Utilisation rate (annualised) by district, 2007/08<br />
Central Karoo<br />
Eden<br />
Pixley ka Seme<br />
West Coast<br />
Vhembe<br />
Cacadu<br />
Namakwa<br />
Overberg<br />
Dr Ruth Segomotsi Mompati<br />
Mopani<br />
Nelson Mandela Bay Metro<br />
Cape Winelands<br />
Siyanda<br />
Frances Baard<br />
Ngaka Modiri Molema<br />
Xhariep<br />
Dr Kenneth Kaunda<br />
Umkhanyakude<br />
UMgungundlovu<br />
Amatole<br />
iLembe<br />
City of Cape Town<br />
Ehlanzeni<br />
Chris Hani<br />
Thabo Mofutsanyane<br />
Ugu<br />
Uthungulu<br />
eThekwini<br />
Zululand<br />
Umzinyathi<br />
Capricorn<br />
Uthukela<br />
Ukhahlamba<br />
Alfred Nzo<br />
Fezile Dabi<br />
Bojanala Platinum<br />
Motheo<br />
O.R.Tambo<br />
City of Johannesburg<br />
Gert Sibande<br />
Waterberg<br />
City of Tshwane<br />
Greater Sekhukhune<br />
Nkangala<br />
Sisonke<br />
Amajuba<br />
West Rand<br />
Lejweleputswa<br />
Sedibeng<br />
Ekurhuleni<br />
Kgalagadi<br />
Metsweding<br />
SA average<br />
Provinces<br />
EC<br />
FS<br />
GP<br />
KZN<br />
LP<br />
MP<br />
NC<br />
NW<br />
WC<br />
PRIMARY HEALTH CARE UTILISATION RATE<br />
1 2 3 4<br />
Average number of visits per person<br />
Source: DHIS (2008)<br />
Metro View<br />
The average utilisation rate for the metro districts was 2.1 visits per year. Three of the six<br />
metros, all in Gauteng (City of Johannesburg, Ekurhuleni and Tshwane) had the lowest<br />
utilisation rates, which are lower than both the metro and the South African average<br />
utilisation rates for 2007/08.<br />
85
Section A: <strong>Output</strong> <strong>Indicators</strong><br />
Figure 79: Primary health care utilisation rate by metro district, 2007/08<br />
Utilisation rate (annualised) by metro district, 2007/08<br />
Nelson Mandela Bay Metro<br />
City of Cape Town<br />
eThekwini<br />
City of Johannesburg<br />
City of Tshwane<br />
Ekurhuleni<br />
SA average<br />
Metro average<br />
1 2 3 4<br />
Average number of visits per person<br />
Provinces<br />
EC<br />
FS<br />
GP<br />
KZN<br />
LP<br />
MP<br />
NC<br />
NW<br />
WC<br />
Rural Nodes<br />
The average utilisation rate in the rural districts in 2007/08 was 2.1 visits per person per<br />
year, the same as in 2006/07 and lower than the SA average utilisation of 2.2. Seven of<br />
the 12 rural districts were above the national average with one district, Central Karoo (WC)<br />
with a utilisation rate far exceeding the average and above the national target of 3.5.<br />
Figure 80: Primary health care utilisation rate by rural district, 2007/08<br />
Utilisation rate (annualised) by rural district, 2007/08<br />
Central Karoo<br />
Umkhanyakude<br />
Chris Hani<br />
Thabo Mofutsanyane<br />
Ugu<br />
Zululand<br />
Umzinyathi<br />
Ukhahlamba<br />
Alfred Nzo<br />
O.R.Tambo<br />
Greater Sekhukhune<br />
Kgalagadi<br />
SA average<br />
ISRDP average<br />
1 2 3 4<br />
Average number of visits per person<br />
Provinces<br />
EC<br />
FS<br />
GP<br />
KZN<br />
LP<br />
MP<br />
NC<br />
NW<br />
WC<br />
Change and trends in primary health care utilisation rate<br />
Because the utilisation rate is based on the total number of visits of patients for all possible health reasons, it<br />
represents the full spectrum of all facility PHC activity and is therefore slow to change. Community based PHC<br />
activity is still not integrated into the information system and these activities, if incorporated into the calculations,<br />
could have significant influence on the total figures. The data show that less than half (22 of the 52 districts) had<br />
decreased utilisation rates since 2006/07, whilst 15 had increased and 15 had registered no change. Xhariep (FS)<br />
demonstrated the highest average increase in the number of people visiting a PHC facility (0.3) while Kgalagadi<br />
(NC) had the largest decline of 1.3 visits per person. This decline for a second year in a row is most probably due to<br />
missing data. Tshwane metro had the second largest decline of all the districts and the largest decline in PHC visits<br />
amongst the metros (0.6 visits per year less). Besides Ekurhuleni, which registered no change, five of the six metros<br />
showed decreased utilisation rates as compared to 2006/07. Four of the rural districts however, had increased their<br />
utilisation rates during the year.<br />
86
Figure 81: Change in primary health care utilisation rate by district, 2006/07 - 2007/08<br />
Change in utilisation rate (annualised) by district, 2006/07−2007/08<br />
Xhariep<br />
iLembe<br />
Umzinyathi<br />
Siyanda<br />
Eden<br />
Cape Winelands<br />
Ukhahlamba<br />
Amatole<br />
Cacadu<br />
Zululand<br />
Uthukela<br />
UMgungundlovu<br />
Dr Ruth Segomotsi Mompati<br />
Namakwa<br />
Greater Sekhukhune<br />
Chris Hani<br />
Lejweleputswa<br />
Motheo<br />
West Rand<br />
Capricorn<br />
eThekwini<br />
Uthungulu<br />
Ugu<br />
Umkhanyakude<br />
Waterberg<br />
Pixley ka Seme<br />
West Coast<br />
Ehlanzeni<br />
Frances Baard<br />
Overberg<br />
Thabo Mofutsanyane<br />
Alfred Nzo<br />
Ekurhuleni<br />
O.R.Tambo<br />
Amajuba<br />
Sisonke<br />
Sedibeng<br />
City of Johannesburg<br />
City of Cape Town<br />
Ngaka Modiri Molema<br />
Gert Sibande<br />
Fezile Dabi<br />
Nelson Mandela Bay Metro<br />
Dr Kenneth Kaunda<br />
Bojanala Platinum<br />
Nkangala<br />
Mopani<br />
Vhembe<br />
Central Karoo<br />
Metsweding<br />
City of Tshwane<br />
Kgalagadi<br />
SA average<br />
Provinces<br />
EC<br />
FS<br />
GP<br />
KZN<br />
LP<br />
MP<br />
NC<br />
NW<br />
WC<br />
PRIMARY HEALTH CARE UTILISATION RATE<br />
−1.0 −0.5 0.0<br />
Average number of visits per person<br />
Source: DHIS (2008)<br />
Figure 82 shows each province individually, illustrating the trend over the last few years in the average PHC utilisation<br />
rate for each of the districts within that province. It illustrates amongst other things the wide variation in the utilisation<br />
rates among districts in the Eastern Cape and Limpopo provinces and the low utilisation of Gauteng’s districts as well<br />
as the relatively higher utilisation rates of districts in the Western Cape.<br />
87
Section A: <strong>Output</strong> <strong>Indicators</strong><br />
Figure 82: Trends in primary health care utilisation rate by province and district, 2000/01 - 2007/08<br />
Annual trends: Utilisation rate (annualised)<br />
EC FS GP<br />
4<br />
3<br />
2<br />
1<br />
Average number of visits per person<br />
4<br />
3<br />
2<br />
1<br />
KZN LP MP<br />
NC<br />
NW<br />
WC<br />
4<br />
3<br />
2<br />
1<br />
2000/01<br />
2001/02<br />
2002/03<br />
2003/04<br />
2004/05<br />
2005/06<br />
2006/07<br />
2007/08<br />
2000/01<br />
2001/02<br />
2002/03<br />
2003/04<br />
2004/05<br />
2005/06<br />
2006/07<br />
2007/08<br />
2000/01<br />
2001/02<br />
2002/03<br />
2003/04<br />
2004/05<br />
2005/06<br />
2006/07<br />
2007/08<br />
EC Alfred Nzo<br />
EC Amatole<br />
EC Cacadu<br />
EC Chris Hani<br />
EC Nelson Mandela<br />
EC O.R.Tambo<br />
EC Ukhahlamba<br />
FS Fezile Dabi<br />
FS Lejweleputswa<br />
FS Motheo<br />
FS T. Mofutsanyane<br />
FS Xhariep<br />
GP Ekurhuleni<br />
GP Johannesburg<br />
GP Metsweding<br />
GP Sedibeng<br />
GP Tshwane<br />
GP West Rand<br />
KZN Amajuba<br />
KZN eThekwini<br />
KZN iLembe<br />
KZN Sisonke<br />
KZN Ugu<br />
KZN UMgungundlovu<br />
KZN Umkhanyakude<br />
KZN Umzinyathi<br />
Year<br />
KZN Uthukela<br />
KZN Uthungulu<br />
KZN Zululand<br />
LP Capricorn<br />
LP Gr Sekhukhune<br />
LP Mopani<br />
LP Vhembe<br />
LP Waterberg<br />
MP Ehlanzeni<br />
MP Gert Sibande<br />
MP Nkangala<br />
NC Frances Baard<br />
NC Kgalagadi<br />
NC Namakwa<br />
NC Pixley ka Seme<br />
NC Siyanda<br />
NW Bojanala Platinum<br />
NW Kenneth Kaunda<br />
NW NM Molema<br />
NW Ruth S. Mompati<br />
WC Cape Town<br />
WC Cape Winelands<br />
WC Central Karoo<br />
WC Eden<br />
WC Overberg<br />
WC West Coast<br />
88