LDV-measurements in the near wake of a circular cylinder
LDV-measurements in the near wake of a circular cylinder
LDV-measurements in the near wake of a circular cylinder

You also want an ePaper? Increase the reach of your titles
YUMPU automatically turns print PDFs into web optimized ePapers that Google loves.
Advances <strong>in</strong> Understand<strong>in</strong>g <strong>of</strong> Blu Body Wakes and Vortex-Induced Vibration, Wash<strong>in</strong>gton DC, June 1998.<br />
<strong>LDV</strong>-<strong>measurements</strong> <strong>in</strong> <strong>the</strong> <strong>near</strong> <strong>wake</strong> <strong>of</strong> a<br />
<strong>circular</strong> cyl<strong>in</strong>der<br />
C. Norberg<br />
Division <strong>of</strong> Heat Transfer, Lund Institute <strong>of</strong> Technology, P.O. Box 118,<br />
S-221 00, LUND, Sweden (chris@ms.vok.lth.se)<br />
Abstract<br />
Results from <strong>LDV</strong>-<strong>measurements</strong> <strong>in</strong> <strong>the</strong> <strong>near</strong> <strong>wake</strong> <strong>of</strong> a high-aspect-ratio <strong>circular</strong> cyl<strong>in</strong>der <strong>in</strong><br />
low-blockage cross ow are presented (aspect ratio 65, blockage 1.5%). Reynolds numbers from<br />
Re = 1:5 10 3 to Re = 10 10 3 are covered. Statistical moments (mean, RMS and skewness)<br />
are presented for <strong>the</strong> streamwise and spanwise velocity components, respectively. Length scales<br />
are identied from positions <strong>of</strong> extreme values for <strong>the</strong>se quantities. For Re < 8 10 3 <strong>the</strong> RMSdistribution<br />
<strong>of</strong> streamwise velocity along <strong>the</strong> <strong>wake</strong> centerl<strong>in</strong>e has two local maxima, as opposed to<br />
higher Re where only one maximum is identied. With an <strong>in</strong>crease <strong>in</strong> Re over <strong>the</strong> range covered<br />
<strong>the</strong>re is a signicant upstream movement <strong>of</strong> critical po<strong>in</strong>ts. For <strong>in</strong>stance, <strong>the</strong> upstream movement <strong>of</strong><br />
<strong>the</strong> mean <strong>wake</strong> closure po<strong>in</strong>t is about 0.8 diameters (from about 2.3 diameters beh<strong>in</strong>d <strong>the</strong> cyl<strong>in</strong>der<br />
axis at Re =1:5 10 3 to about 1.5 diameters at Re =10 10 3 ). Traverses across <strong>the</strong> <strong>wake</strong> at0.6,1<br />
and 2 diameters downstream <strong>of</strong> <strong>the</strong> cyl<strong>in</strong>der axis are also carried out. With<strong>in</strong> this short distance <strong>the</strong><br />
distribution <strong>of</strong> streamwise velocity defect changes from a <strong>near</strong> top-hat to a Gaussian type <strong>of</strong> prole.<br />
Reasons for <strong>the</strong> occurrence <strong>of</strong> a fundamental transition <strong>in</strong> <strong>the</strong> <strong>near</strong> <strong>wake</strong> <strong>in</strong>between Re =5 10 3<br />
and Re =8 10 3 are discussed.<br />
1 Introduction<br />
In L<strong>in</strong>ke (1931) [21] an extensive <strong>near</strong> <strong>wake</strong> study with<strong>in</strong> <strong>the</strong> Re-range from about 1:5 10 3 to 15 10 3<br />
is presented. His careful Pitot-tube <strong>measurements</strong> reveal that <strong>the</strong>re is, <strong>in</strong> between Re = 1:5 10 3<br />
and Re =10 10 3 , a considerable shr<strong>in</strong>k<strong>in</strong>g <strong>of</strong> <strong>the</strong> recirculat<strong>in</strong>g region beh<strong>in</strong>d <strong>the</strong> cyl<strong>in</strong>der (by about<br />
one diameter which corresponds to an approximate 50% decrease when measured from <strong>the</strong> axis <strong>of</strong> <strong>the</strong><br />
cyl<strong>in</strong>der). Associated with this shr<strong>in</strong>k<strong>in</strong>g process, L<strong>in</strong>ke also observes a signicant upstream movement<br />
<strong>of</strong> <strong>the</strong> transitional po<strong>in</strong>t <strong>in</strong> <strong>the</strong> separated shear layers, a feature which later (1964) was <strong>in</strong>vestigated<br />
thorough by Bloor [7].<br />
From previous <strong>measurements</strong> [43, 31] it is <strong>in</strong>dicated that <strong>the</strong> shedd<strong>in</strong>g process is extremely weak at<br />
around Re = 1:5 10 3 , co<strong>in</strong>cid<strong>in</strong>g with local extreme values for <strong>the</strong> Strouhal number [32], <strong>the</strong> base<br />
suction coecient [32] and <strong>the</strong> RMS lift coecient [31], respectively. In between Re =1:5 10 3 and<br />
Re = 15 10 3 <strong>the</strong>re is an approximate tenfold <strong>in</strong>crease <strong>in</strong> <strong>the</strong> RMS lift coecient [31] whereas <strong>the</strong><br />
Strouhal number drops by only about 7% [32]. Fur<strong>the</strong>r, at around Re = 1:5 10 3 , as discovered by<br />
Bloor [7] <strong>in</strong> 1964, shear-layer vortices [50] show up as important <strong>in</strong>gredients <strong>in</strong> <strong>the</strong> <strong>near</strong> <strong>wake</strong>, see Prasad<br />
& Williamson (1997a) [35]. These structures develops <strong>in</strong> <strong>the</strong> separat<strong>in</strong>g shear layers by <strong>the</strong> action <strong>of</strong> a<br />
Kelv<strong>in</strong>-Helmholtz <strong>in</strong>stability mechanism [35].<br />
As shown <strong>in</strong> Norberg (1987) [28] <strong>the</strong>re is an abrubt change <strong>in</strong> <strong>the</strong> appearance <strong>of</strong> <strong>the</strong> vortex shedd<strong>in</strong>g<br />
frequency occurr<strong>in</strong>g at around Re =5 10 3 below this critical value (down to about Re = 260) <strong>the</strong><br />
shedd<strong>in</strong>g peak is <strong>of</strong> extremely high quality whereas at higher values (up to about Re = 2 10 5 ) <strong>the</strong><br />
shedd<strong>in</strong>g peak is signicantly broader <strong>in</strong>dicat<strong>in</strong>g that <strong>the</strong> shedd<strong>in</strong>g frequency varies with time (as shown<br />
e.g. <strong>in</strong> [6]). Later ow visualizations, e.g. [30, 31], show that this transitional behaviour is related to a<br />
fundamental change <strong>in</strong> <strong>the</strong> three-dimensional evolution <strong>of</strong> Karman vortices. At Reynolds numbers below<br />
this critical value (probably all <strong>the</strong> waydown to Re ' 260), <strong>the</strong> Karman vortices are surpris<strong>in</strong>gly straight<br />
and aligned with <strong>the</strong> cyl<strong>in</strong>der axis whereas for higher Re <strong>the</strong> vortices exhibit much more undulation with<br />
occasional <strong>in</strong>gredients <strong>of</strong> vortex dislocation, e.g. see [30, 31]. Conrmation <strong>of</strong> this behaviour <strong>in</strong>clud<strong>in</strong>g<br />
fur<strong>the</strong>r evidence <strong>of</strong> large-scale phase dislocations along <strong>the</strong> span occurr<strong>in</strong>g above some critical Re close<br />
to Re =510 3 can be found <strong>in</strong> Prasad & Williamson (1997b) [36]. In [36] <strong>the</strong> transition is observed only<br />
under conditions where parallel shedd<strong>in</strong>g is attempted (both end plates tilted and po<strong>in</strong>t<strong>in</strong>g upstream).<br />
At this po<strong>in</strong>t, it needs to be reiterated that <strong>the</strong> transition has been shown to occur also under conditions<br />
us<strong>in</strong>g ord<strong>in</strong>ary non-tilted end plates [31]. For suciently large aspect ratios (greater than about L = 50)<br />
<strong>the</strong> transitional process appears to be <strong>in</strong>dependent <strong>of</strong> this parameter, see [31].<br />
The sudden <strong>in</strong>crease <strong>in</strong> <strong>the</strong> relative bandwidth occurs at Re ' 5:1 10 3 for Tu = 0:06% and at<br />
Re ' 4 10 3 for Tu =1:4% (grid-generated), respectively, see [28, 29]. The relative bandwidth <strong>the</strong>n<br />
<strong>in</strong>creases up to local maximum at a second critical Re, which for Tu=0:06% occurs at Re ' 7:5 10 3<br />
1
[31]. At around this second critical Re <strong>the</strong>re is a plateau <strong>in</strong> <strong>the</strong> variation <strong>of</strong> <strong>the</strong> base suction coecient<br />
vs. Re, see [32]. These <strong>measurements</strong> were not carried out <strong>in</strong> <strong>the</strong> same w<strong>in</strong>d tunnel as <strong>in</strong> <strong>the</strong> present<br />
study. However, from <strong>the</strong> author's prelim<strong>in</strong>ary studies on aspect-ratio eects us<strong>in</strong>g <strong>the</strong> present w<strong>in</strong>d<br />
tunnel, <strong>the</strong> same transitional behaviour as described above was noted. The only dierence was that<br />
<strong>the</strong> <strong>in</strong>ception <strong>of</strong> <strong>in</strong>creas<strong>in</strong>g shedd<strong>in</strong>g bandwidth <strong>the</strong>n occurred at a somewhat lower Reynolds number<br />
(Re ' 4:6 10 3 ). In addition, for suciently large aspect ratios (L 50) us<strong>in</strong>g non-tilted end plates,<br />
<strong>the</strong> above-mentioned plateau for (;C pb )was noted also <strong>in</strong> <strong>the</strong>se prelim<strong>in</strong>ary tests.<br />
Obviously, with<strong>in</strong> <strong>the</strong> considered range <strong>of</strong> Re, i.e. from Re =1:5 10 3 to 10 10 3 , <strong>the</strong>re are mechanisms<br />
which have a signicant <strong>in</strong>uence on <strong>the</strong> strength and subsequent roll-up <strong>of</strong> <strong>the</strong> Karman vortices as well<br />
as on <strong>in</strong>tr<strong>in</strong>sic three-dimensional large-scale ow features. Probably, <strong>the</strong>se mechanisms are related to<br />
<strong>in</strong>teractions between <strong>the</strong> primary Karman vortices, <strong>the</strong> shear layer vortices and <strong>the</strong> essentially streamwise<br />
(longitud<strong>in</strong>al) mode B type <strong>of</strong> secondary vortices, which occur along <strong>the</strong> span roughly with a spanwise<br />
wavelength <strong>of</strong> about one cyl<strong>in</strong>der diameter [49, 20].<br />
The present paper presents experimental data on <strong>the</strong> streamwise and spanwise velocity components<br />
<strong>in</strong> <strong>the</strong> <strong>near</strong> <strong>wake</strong>, us<strong>in</strong>g <strong>the</strong> technique <strong>of</strong> Laser Doppler Velocimetry, <strong>LDV</strong>. When used correctly, this<br />
technique can provide accurate and reliable data with<strong>in</strong> this highly turbulent and recirculat<strong>in</strong>g region,<br />
see McKillop & Durst (1984) [24]. The ma<strong>in</strong> purpose was to ga<strong>the</strong>r and analyse such data with a high<br />
spatial resolution. The prospective was that <strong>the</strong> results <strong>the</strong>n could provide some relevant <strong>in</strong>formation<br />
regard<strong>in</strong>g transitional ow features <strong>in</strong> <strong>the</strong> <strong>near</strong> <strong>wake</strong>. Hopefully, <strong>the</strong> results can be used as comparison<br />
data with<strong>in</strong> <strong>the</strong> rapidly <strong>in</strong>creas<strong>in</strong>g eld <strong>of</strong> Computational Fluid Dynamics (CFD), see e.g. Beaudan &<br />
Mo<strong>in</strong> (1994) [4].<br />
2 Experimental Details<br />
All <strong>measurements</strong> were carried out <strong>in</strong> <strong>the</strong> closed-circuit low-speed w<strong>in</strong>d tunnel L1 at <strong>the</strong> Department <strong>of</strong><br />
Fluid and Thermo Dynamics (Chalmers University <strong>of</strong>Technology, Go<strong>the</strong>nburg). The work<strong>in</strong>g section is<br />
2:9 m long and has a rectangular cross-section <strong>of</strong> height 0:5 m and width 0:4 m. For <strong>the</strong> ow speeds<br />
considered <strong>in</strong> this study <strong>the</strong> free stream turbulence <strong>in</strong>tensity is less than 0.1% (2 Hz to 5000 Hz).<br />
The acoustic noise level is less than 1% <strong>of</strong> <strong>the</strong> dynamic pressure [27], a level completely dom<strong>in</strong>ated by<br />
uctuations at frequencies less than 85 Hz. The lowest shedd<strong>in</strong>g frequency <strong>in</strong> <strong>the</strong> present tests was<br />
about 135 Hz. As shown <strong>in</strong> Peterka & Richardson (1969) [34], high sound levels at around <strong>the</strong> natural<br />
shear layer frequency, which is always greater than <strong>the</strong> shedd<strong>in</strong>g frequency [7], can cause <strong>in</strong>teractions<br />
with <strong>the</strong> develop<strong>in</strong>g ow eld but when disturbances are well below <strong>the</strong> shedd<strong>in</strong>g frequency no eects<br />
can be noted. The lowest shear layer frequency <strong>in</strong> <strong>the</strong> present tests was about 450 Hz. The cyl<strong>in</strong>der had<br />
a diameter <strong>of</strong> d =6:0 mm and was made <strong>of</strong> solid sta<strong>in</strong>less steel <strong>of</strong> high quality and surface nish. It was<br />
oriented vertically and was mounted rigidly at a symmetric position with respect to <strong>the</strong> side walls. The<br />
cyl<strong>in</strong>der was equipped with th<strong>in</strong> <strong>circular</strong> end plates hav<strong>in</strong>g a diameter <strong>of</strong> ten times <strong>the</strong> cyl<strong>in</strong>der diameter.<br />
The distance between <strong>the</strong> end plates was 390 mm thus provid<strong>in</strong>g an aspect ratio <strong>of</strong> 65. The clearance<br />
distance between <strong>the</strong> walls and <strong>the</strong> end plates was about 50 mm. From previous <strong>in</strong>vestigations by <strong>the</strong><br />
author us<strong>in</strong>g hot wires it is known that <strong>the</strong> thickness <strong>of</strong> <strong>the</strong> boundary layers on <strong>the</strong> tunnel walls at <strong>the</strong><br />
cyl<strong>in</strong>der position is about 20 ; 30 mm. Outside <strong>the</strong>se layers <strong>the</strong> velocity is constant with<strong>in</strong> 0:3%. All<br />
<strong>measurements</strong> were carried out at <strong>the</strong> midspan position. The blockage ratio was 1.5%.<br />
A commercial (Dantec) bre-optic <strong>LDV</strong>-system arranged <strong>in</strong> a backscatter mode was employed (focal<br />
length, 310 mm). For <strong>measurements</strong> <strong>of</strong> <strong>the</strong> streamwise ( ~ U) and spanwise ( ~ W ) velocity components,<br />
respectively, <strong>the</strong> green (wavelength 514:5 nm) and <strong>the</strong> blue (488 nm) coherent lights <strong>of</strong> an argon-ion<br />
laser (Coherent Innova model 90-4) was used. The probe with a beam expander <strong>of</strong> factor 1.94 conta<strong>in</strong>ed<br />
both transmitt<strong>in</strong>g and receiv<strong>in</strong>g optics, and <strong>the</strong> signals from <strong>the</strong> photomultipliers were analyzed us<strong>in</strong>g<br />
two burst spectrum analyzers (Dantec 57N10). That <strong>the</strong> four light beams crossed each o<strong>the</strong>r <strong>in</strong> <strong>the</strong> same<br />
po<strong>in</strong>t was checked separately with a t<strong>in</strong>y aperture mounted on an optical bench. From <strong>measurements</strong><br />
<strong>of</strong> <strong>the</strong> beam angles <strong>the</strong> sensitivity factors for <strong>the</strong> velocity components ~ U and ~ W were 4:12 (m=s)=MHz<br />
and 3:85 (m=s)=MHz, respectively (beam half-angles approx. 3:6 ). The free stream velocity (U 1 )was<br />
determ<strong>in</strong>ed from repeated <strong>measurements</strong> at a position 160 mm (27 diameters) upstream <strong>of</strong> <strong>the</strong> cyl<strong>in</strong>der.<br />
When scaled with U 1 <strong>the</strong> spanwise velocity at this position was with<strong>in</strong> 0:003. The ellipsoidal measurement<br />
volumes were each approx. 0:05 mm <strong>in</strong> width and 0:5 mm <strong>in</strong> length. The seed<strong>in</strong>g droplets (Invent<br />
Safex-Inside-Nebeluide SUPER) were generated us<strong>in</strong>g a 6-jet atomizer (TSI model 8306-6), which was<br />
located downstream <strong>of</strong> <strong>the</strong> cyl<strong>in</strong>der. Validated burst rates <strong>of</strong> typically (1:0=0:5) kHz (green/blue) were<br />
obta<strong>in</strong>ed. The number <strong>of</strong> samples collected at each position was typically 10,000 ( ~ U) and 5,000 ( ~ W ),<br />
respectively. Transit time weight<strong>in</strong>g for bias correction was applied to <strong>the</strong> data. The respective noise<br />
2
levels for ~ U and ~ W were approx. 1.6% and 1.0% <strong>of</strong> <strong>the</strong> free stream velocity. The computer-controlled<br />
3D-traverse system had a positional accuracy <strong>of</strong> about 35 m with a resolution <strong>of</strong> about 2 m.<br />
Except o<strong>the</strong>rwise stated, all positions and length scales are scaled with <strong>the</strong> cyl<strong>in</strong>der diameter d, velocities<br />
with <strong>the</strong> free stream velocity U 1 , and frequencies with U 1 =d. The orig<strong>in</strong> <strong>of</strong> <strong>the</strong> coord<strong>in</strong>ate system<br />
was placed at <strong>the</strong> cyl<strong>in</strong>der axis (midspan position). The streamwise and cross-stream directions are<br />
denoted x and y, respectively. The <strong>wake</strong> centerl<strong>in</strong>e (y = 0) was found from symmetry <strong>of</strong> measured<br />
streamwise velocity variations across <strong>the</strong> <strong>wake</strong>. The traverse system <strong>the</strong>n was aligned with this l<strong>in</strong>e,<br />
with an alignment error which was estimated to be less than 1:5 . After this procedure, <strong>the</strong> streamwise<br />
center <strong>of</strong> <strong>the</strong> cyl<strong>in</strong>der (x =0)was found from <strong>the</strong> two positions (x = 1=2) where <strong>the</strong> laser beams touched<br />
<strong>the</strong> cyl<strong>in</strong>der surface. The uncerta<strong>in</strong>ty <strong>in</strong>U was estimated to be 0:006. Correspond<strong>in</strong>g uncerta<strong>in</strong>ties for<br />
RMS-velocities u RMS and w RMS were 0:02 and 0:03, respectively.<br />
3 Results and Discussion<br />
3.1 Wake centerl<strong>in</strong>e<br />
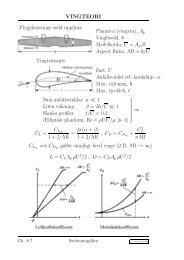
A summary <strong>of</strong> critical values from <strong>measurements</strong> along <strong>the</strong> <strong>wake</strong> centerl<strong>in</strong>e (y =0,x>0:5) is compiled<br />
<strong>in</strong> Table 1. The underly<strong>in</strong>g data is depicted <strong>in</strong> Fig. 1. With an <strong>in</strong>crease <strong>in</strong> Re from 1:5 10 3 to 10 4 <strong>the</strong>re<br />
was a decrease <strong>of</strong> about 34% <strong>in</strong> <strong>the</strong> <strong>wake</strong> closure length `c. All o<strong>the</strong>r length scales <strong>in</strong> Table 1 followed <strong>the</strong><br />
same pattern <strong>of</strong> decrease. The variation <strong>of</strong> mean streamwise velocity U(x 0) showed a consistent decrease<br />
towards zero velocity when approach<strong>in</strong>g <strong>the</strong> base <strong>of</strong> <strong>the</strong> cyl<strong>in</strong>der (at x =0:5). However, <strong>the</strong> absolute<br />
value for <strong>the</strong> wall gradient was about 5 times higher at Re =10 10 3 as compared to Re =1:5 10 3 ,<br />
<strong>the</strong> gradient be<strong>in</strong>g approximately equal to ;1:2 atRe =10 10 3 . Also <strong>the</strong> variation <strong>of</strong> u RMS when<br />
approach<strong>in</strong>g <strong>the</strong> base showed a consistent decrease towards zero. However, at around x =0:6 for <strong>the</strong><br />
spanwise RMS velocity <strong>the</strong>re was a departure from a steady decrease towards w RMS = 0 at <strong>the</strong> base,<br />
see Fig. 1(d). This was believed to be an eect caused by <strong>the</strong> nite measurement volume.<br />
Re=10 3 `U U m<strong>in</strong> `c `(1)<br />
u ^u (1)<br />
RMS<br />
`(2)<br />
u ^u (2)<br />
RMS `S `w ^w RMS<br />
1.5 1.75 ;0:40 2.29 1.51 0.30 2.23 0.32 1.86 2.08 0.36<br />
3.0 1.65 ;0:44 2.16 1.45 0.33 2.09 0.34 1.72 1.86 0.39<br />
5.0 1.42 ;0:45 1.90 1.23 0.35 1.83 0.36 1.50 1.61 0.39<br />
8.0 1.17 ;0:35 1.67 (1.02) (0.37) 1.62 0.45 1.32 1.41 0.39<br />
10. 1.04 ;0:38 1.52 (0.96) (0.37) 1.50 0.43 1.18 1.26 0.39<br />
Table 1: Summary <strong>of</strong> critical values along <strong>the</strong> <strong>wake</strong> centerl<strong>in</strong>e, y =0.<br />
Interest<strong>in</strong>gly, for Re < 8 10 3 <strong>the</strong> distributions <strong>of</strong> RMS streamwise velocity exhibited two dist<strong>in</strong>ct peaks<br />
whereas only one such peakwas present for higher Re, see Fig. 1(b). For Re 8 10 3 <strong>the</strong>re was <strong>in</strong>stead<br />
an <strong>in</strong>exional appearance at x ' 1 (associated values are with<strong>in</strong> paren<strong>the</strong>ses <strong>in</strong> Table 1). Although<br />
be<strong>in</strong>g with<strong>in</strong> <strong>the</strong> experimental accuracy, <strong>the</strong> second maximum, ^u (2)<br />
RMS , appeared to be <strong>the</strong> highest one<br />
(Re < 8 10 3 ). The highest RMS streamwise velocity always occurred slightly upstream <strong>of</strong> <strong>the</strong> mean<br />
<strong>wake</strong> closure po<strong>in</strong>t. For w RMS only one local maximum along y = 0 could be detected (at x = `w).<br />
The secondary peak for u RMS along y = 0 is believed to be caused by <strong>the</strong> cross-over <strong>of</strong> modeBtype<br />
<strong>of</strong> secondary structures. As shown <strong>in</strong> Wu et al. (1993) [48] <strong>the</strong> velocity perturbations <strong>in</strong>duced by <strong>the</strong><br />
passage <strong>of</strong> <strong>the</strong>se longitud<strong>in</strong>al vortices are <strong>of</strong> <strong>the</strong> order 0.3 times <strong>the</strong> free stream velocity. The extreme<br />
constancy <strong>of</strong> <strong>the</strong> shedd<strong>in</strong>g frequency and <strong>the</strong> very small undulations <strong>of</strong> Karman vortices <strong>in</strong> <strong>the</strong> spanwise<br />
direction <strong>in</strong> between Re ' 260 and Re ' 5 10 3 [31] implies an extreme regularity with<strong>in</strong> <strong>the</strong> <strong>near</strong>cyl<strong>in</strong>der<br />
<strong>wake</strong> region, a region where <strong>the</strong>se structures are generated [10, 16]. Above <strong>the</strong> transition at<br />
Re ' 5 10 3 <strong>the</strong>re is signicant spanwise undulation <strong>of</strong> <strong>the</strong> Karman vortices with occasional dislocations<br />
and a much less regular shedd<strong>in</strong>g frequency [31]. Under <strong>the</strong>se non-regular conditions <strong>in</strong> <strong>the</strong> base region<br />
<strong>the</strong> secondary peak is expected to be smeared out.<br />
It is important topo<strong>in</strong>t out that also results from <strong>measurements</strong> us<strong>in</strong>g standard hot wire anemometry<br />
along y = 0 <strong>in</strong>dicate a change <strong>of</strong> appearance with<strong>in</strong> this range <strong>of</strong> Reynolds number, see Norberg (1987)<br />
[28] and Prasad & Williamson (1997a) [36]. From <strong>the</strong>se studies <strong>the</strong> mean cool<strong>in</strong>g velocity at Reynolds<br />
numbers below <strong>the</strong> <strong>in</strong>dicated <strong>in</strong>ception <strong>of</strong> vortex dislocations can be seen to exhibit a dist<strong>in</strong>ct plateau<br />
slightly upstream <strong>of</strong> <strong>the</strong> position for maximum RMS cool<strong>in</strong>g velocity, whereas not so at higher Re. For<br />
<strong>the</strong> RMS cool<strong>in</strong>g velocity only one maximum is noted, see [28, 36].<br />
3
(a)<br />
(b)<br />
(c)<br />
(d)<br />
Figure 1: Results from <strong>measurements</strong> along <strong>the</strong> <strong>wake</strong> centerl<strong>in</strong>e. (a) mean streamwise velocity, (b) RMS<br />
streamwise velocity, (c) skewness factor <strong>of</strong> streamwise velocity uctuations, (d) RMS spanwise velocity.<br />
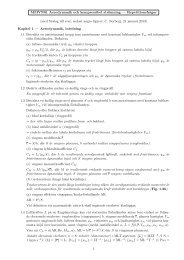
In <strong>the</strong> present study, both `c and `(2)<br />
u were used as a measure for <strong>the</strong> vortex formation length `f , see<br />
Fig. 2(a). For clarications <strong>of</strong> past denitions <strong>of</strong> <strong>the</strong> formation length <strong>the</strong> reader is referred to e.g. Bloor<br />
& Gerrard (1966) [8], McKillop & Durst (1984) [24] and Noca et al. (1998) [26]. Interest<strong>in</strong>gly, <strong>the</strong><br />
careful and extensive DPIV-<strong>measurements</strong> <strong>of</strong> Noca et al. (1998), for (300
(McKillop & Durst have an oncom<strong>in</strong>g free stream turbulence level <strong>of</strong> Tu=2:3% present: Tu=0:1%),<br />
(ii) blockage ratios (10% 1:5%) and (iii) aspect ratios (L =10:5 L =65).<br />
The present results were also compared with <strong>the</strong> three-dimensional simulations as provided <strong>in</strong> Beaudan<br />
& Mo<strong>in</strong> (1994) [4], for Re =3:9 10 3 . These simulations are carried out us<strong>in</strong>g a spanwise computational<br />
length <strong>of</strong> 3.14 () diameters and statistics are compiled over approximately six vortex shedd<strong>in</strong>g periods.<br />
In <strong>the</strong> overall sense, <strong>the</strong> results without any subgrid-scale model were closest to <strong>the</strong> (<strong>in</strong>terpolated) present<br />
data. For <strong>in</strong>stance, <strong>the</strong> lengths `c and `U from this selected simulation are `c =2:06 and `U =1:50 l<strong>in</strong>ear<br />
<strong>in</strong>terpolations <strong>in</strong> Table 1 give `c =2:04 and `U =1:55. However, <strong>the</strong> simulated m<strong>in</strong>imum streamwise<br />
velocity along y =0isU m<strong>in</strong> = ;0:33, which is signicantly higher than <strong>the</strong> <strong>in</strong>terpolated present value <strong>of</strong><br />
U m<strong>in</strong> = ;0:45 (<strong>the</strong> o<strong>the</strong>r three simulations have U m<strong>in</strong> = ;0:32, ;0:30 and ;0:33, respectively). Beaudan<br />
& Mo<strong>in</strong> do not state any support<strong>in</strong>g evidence for <strong>the</strong> existence <strong>of</strong> two peaks for <strong>the</strong> variation <strong>of</strong> u RMS<br />
along <strong>the</strong> <strong>wake</strong> centerl<strong>in</strong>e.<br />
(a)<br />
(b)<br />
Figure 2: Streamwise length scales. (a) Vortex formation length, `f . The solid l<strong>in</strong>e is calculated from `f =<br />
C=(;Cpb) with C described <strong>in</strong> <strong>the</strong> text. Half-lled markers are from three-dimensional numerical simulations,<br />
o<strong>the</strong>rs are experimental. (b) Transitional length `t (<strong>in</strong>dicated x-position <strong>of</strong> transition to turbulence <strong>in</strong> <strong>the</strong> shear<br />
layers), length scale `(1)<br />
u (Table 1) and formation length `f (smoo<strong>the</strong>d data from (a), solid thick l<strong>in</strong>e). Solid<br />
th<strong>in</strong> l<strong>in</strong>e: smoo<strong>the</strong>d variation for `t as suggested <strong>in</strong> Bloor (1964). Broken l<strong>in</strong>e: `t = 75=Re 0:5 . Dotted l<strong>in</strong>e:<br />
`t =1:1 (5100=Re) 1:25 .<br />
As discovered by Bearman [3], <strong>the</strong> formation length roughly is <strong>in</strong>versely proportional to <strong>the</strong> base suction<br />
coecient, i.e. `f = C=(;C pb ). By us<strong>in</strong>g <strong>the</strong> present `f {data (`c and `(2)<br />
u )aswell as results from o<strong>the</strong>r<br />
<strong>in</strong>vestigations [15, 33,47,28,42,1,26] toge<strong>the</strong>r with <strong>the</strong> Re-dependency for (;C pb ) from Norberg (1994)<br />
[32] itwas noted that from Re ' 10 3 up to Re ' 6 10 3 <strong>the</strong> C-value was approximately equal to 1.8<br />
whereas for Reynolds numbers greater than about 7500 <strong>the</strong> value <strong>in</strong>stead was about 1.6. Also <strong>the</strong> 3Dsimulations<br />
<strong>in</strong> Beaudan & Mo<strong>in</strong> (1994) [4], for Re =3:910 3 , support <strong>the</strong> value C =1:8(C =1:800:03).<br />
As shown by <strong>the</strong> l<strong>in</strong>e <strong>in</strong> Fig. 2, <strong>the</strong> formation lengths produced from <strong>the</strong> above-mentioned (;C pb ){data<br />
and by us<strong>in</strong>g <strong>the</strong>se two levels (C =1:8 and C =1:6), jo<strong>in</strong>ed smoothly with <strong>the</strong> error function centered<br />
at Re = 6900 ( = 4), actually created a very reasonable variation, at least for Re 10 3 . The recent<br />
`c{data <strong>of</strong> Noca et al. (1998), k<strong>in</strong>dly provided to <strong>the</strong> author <strong>in</strong> a personal communication with Dr.<br />
Flavio Noca (California Institute <strong>of</strong> Technology), shows that <strong>the</strong> <strong>wake</strong> closure length <strong>in</strong>creases steadily<br />
from Re =300(`c ' 1:4) up to a maximum <strong>of</strong> about `c =2:3 atRe ' 1:5 10 3 . Thereafter, <strong>the</strong>re is a<br />
steady decrease <strong>in</strong> `c with <strong>in</strong>creas<strong>in</strong>g Re. On a logarithmic scale <strong>the</strong> rate <strong>of</strong> change becomes smaller at<br />
around Re =14 10 3 where `c ' 1:4. It is worth not<strong>in</strong>g, however, when us<strong>in</strong>g such a logarithmic scale,<br />
that <strong>the</strong> largest variations seem to occur with<strong>in</strong> <strong>the</strong> <strong>in</strong>terval <strong>in</strong> between Re ' 5 10 3 and Re ' 8 10 3 .<br />
F<strong>in</strong>ally, at <strong>the</strong> upper end <strong>of</strong> <strong>the</strong> subcritical regime, at Re ' 200 10 3 , <strong>the</strong> <strong>wake</strong> formation and <strong>wake</strong><br />
closure occurs approximately 0.75 diameters beh<strong>in</strong>d <strong>the</strong> base <strong>of</strong> <strong>the</strong> cyl<strong>in</strong>der (`f ' `c ' 1:25).<br />
Fig. 2(b) shows some previously reported [21, 7,41] experimental values for <strong>the</strong> x{position <strong>of</strong> <strong>in</strong>dicated<br />
lam<strong>in</strong>ar/turbulent transition (at x = `t) toge<strong>the</strong>r with <strong>the</strong> length scale `(1)<br />
u and a smoo<strong>the</strong>d variation for<br />
<strong>the</strong> formation length `c. The th<strong>in</strong> l<strong>in</strong>e is <strong>the</strong> smoo<strong>the</strong>d variation <strong>of</strong> `t as can be found <strong>in</strong> Bloor (1964),<br />
based on her own data and <strong>the</strong> two po<strong>in</strong>ts as she deduced from L<strong>in</strong>ke (1931). The broken l<strong>in</strong>e corresponds<br />
to 75=Re 0:5 , which isprovided as a rough estimate for `t <strong>in</strong> [45], follow<strong>in</strong>g <strong>the</strong> same l<strong>in</strong>e <strong>of</strong> deduction as<br />
<strong>in</strong> Roshko (1993) [38]. However, as <strong>in</strong>dicated <strong>in</strong> Fig. 2(b), experimental results do not appear to follow<br />
this variation. In particular, for Re > 5000, approximately, <strong>the</strong><strong>in</strong>dicated po<strong>in</strong>t <strong>of</strong> transition seems to<br />
5
move, with an <strong>in</strong>crease <strong>in</strong> Re, atamuch faster rate towards <strong>the</strong> separation region. The results <strong>in</strong> Smith<br />
et al. (1972) actually suggest a rate <strong>of</strong> change correspond<strong>in</strong>g to roughly Re ;1:5 . From about Re > 5000,<br />
<strong>the</strong> smoo<strong>the</strong>d l<strong>in</strong>e from Bloor (1964) corresponds to a variation roughly as Re ;1 . In both Bloor (1964)<br />
and Smith et al. (1972) <strong>the</strong> length `t is determ<strong>in</strong>ed from <strong>the</strong> rst appearance <strong>of</strong> transitional waves <strong>in</strong><br />
<strong>the</strong> separated shear layers. The ow degenerates to turbulence immediately afterwards [7]. In L<strong>in</strong>ke<br />
(1931) [21] <strong>the</strong> transitional po<strong>in</strong>t is determ<strong>in</strong>ed from <strong>the</strong> position where <strong>the</strong> thickness <strong>of</strong> <strong>the</strong> shear layer<br />
starts to deviate from a x 1=2 {variation. No value is reported for <strong>the</strong> free stream turbulence level. In<br />
Bloor (1964) <strong>the</strong> free stream turbulence level is very low, Tu=0:03% whereas <strong>the</strong> typical value reported<br />
<strong>in</strong> Smith et al. (1972) is Tu =0:2% (Tu =0:18 ; 0:27%). As evident from numerous <strong>in</strong>vestigations,<br />
e.g. see [14, 28], <strong>the</strong> transitional process above Re =10 3 (approx.) is strongly dependent on <strong>the</strong> free<br />
stream turbulence level as well as on o<strong>the</strong>r disturbances, for <strong>in</strong>stance sound, <strong>in</strong> particular at around <strong>the</strong><br />
shear-layer frequency [14, 34,51]. As regards <strong>the</strong> level <strong>of</strong> free stream turbulence Tuit may be noted that<br />
with an <strong>in</strong>crease <strong>in</strong> Tu from about 0:1% to 1:4% <strong>the</strong>re is an approximate 20% decrease <strong>in</strong> <strong>the</strong> critical<br />
Reynolds number associated with <strong>the</strong> change-over from a high- to low-quality type <strong>of</strong> shedd<strong>in</strong>g (from<br />
Re ' 5 10 3 to 4 10 3 )[28]. As for <strong>the</strong> variation <strong>of</strong> `t <strong>in</strong> Smith et al. (1972) it <strong>the</strong>refore seems likely<br />
that <strong>the</strong> eective Re and <strong>the</strong> rate <strong>of</strong> decrease are higher than <strong>the</strong> expected ones at a still more quiet free<br />
stream condition. The broken l<strong>in</strong>e <strong>in</strong> Fig. 2(b), `t =1:1 (5100=Re) 1:25 , is an attempt to highlight <strong>the</strong><br />
<strong>in</strong>dicated strong dependency <strong>of</strong> Re above Re ' 5 10 3 . Fur<strong>the</strong>r aspects <strong>of</strong> <strong>the</strong> shear-layer transition<br />
and some <strong>in</strong>dications on where <strong>the</strong> transition actually occurred <strong>in</strong> <strong>the</strong> present studyareprovided <strong>in</strong> <strong>the</strong><br />
next sub-section.<br />
3.2 Cross-stream proles<br />
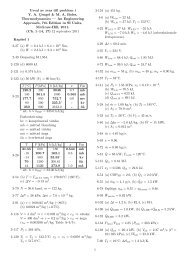
Cross-stream proles <strong>of</strong> <strong>the</strong> mean streamwise velocity at locations x =0:6, 1.0 and 2.0, respectively, are<br />
shown <strong>in</strong> Fig. 3. Correspond<strong>in</strong>g variations for <strong>the</strong> streamwise and spanwise RMS velocity are shown <strong>in</strong><br />
Fig. 4. Critical values are summarized <strong>in</strong> Table 2.<br />
Re=10 3 x U 1 U 2 y 1=2 ^u RMS y p ^w RMS<br />
3.0 0.6 ;0:05 1.31 0.60 12 0.36 0.60 0.14<br />
5.0 0.6 ;0:06 1.34 0.59 14 0.50 0.59 0.18<br />
8.0 0.6 ;0:11 1.35 0.56 11 0.63 0.57 0.23<br />
3.0 1.0 ;0:13 1.33 0.60 9.3 0.37 0.61 0.20<br />
5.0 1.0 ;0:24 1.34 0.57 8.8 0.52 0.58 0.26<br />
8.0 1.0 ;0:30 1.33 0.51 4.6 0.63 0.53 0.32<br />
3.5 2.0 ;0:14 1.09 0.35 1.4 0.48 0.27 0.35<br />
5.0 2.0 +0:14 1.07 0.37 1.3 0.44 0.31 0.32<br />
8.0 2.0 +0:33 1.05 0.40 1.3 0.39 0.3 0.29<br />
Table 2: Summary <strong>of</strong> results from <strong>measurements</strong> across <strong>the</strong> <strong>wake</strong>.<br />
With<strong>in</strong> <strong>the</strong> region from x =0:6 tox =2:0 <strong>the</strong><strong>in</strong>verted mean streamwise velocity variation across <strong>the</strong><br />
<strong>wake</strong> changes from a top-hat type (x =0:6) to a Gaussian type (x =2:0) <strong>of</strong> prole, see Fig. 3. In terms<br />
<strong>of</strong> <strong>the</strong> scaled coord<strong>in</strong>ate x=`c <strong>the</strong> proles cover <strong>the</strong> range from about 0.3 to 1.2.<br />
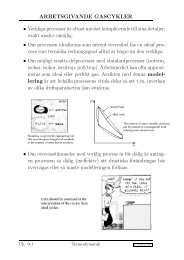
Proles for u RMS and w RMS across <strong>the</strong> <strong>wake</strong> are shown <strong>in</strong> Fig. 4. All proles for u RMS reached <strong>the</strong><br />
maximum value ^u RMS at some position o <strong>the</strong> centerl<strong>in</strong>e (at y p , see Table 2) whereas <strong>the</strong> maximum<br />
spanwise RMS velocity ^w RMS occurred at <strong>the</strong> centerl<strong>in</strong>e (y = 0). Due to <strong>the</strong> shr<strong>in</strong>k<strong>in</strong>g <strong>of</strong> <strong>the</strong> formation<br />
region with an <strong>in</strong>crease <strong>in</strong> Re, <strong>the</strong> positions for ^u RMS occurred closer to y = 0. In between x = 0:6<br />
and x =1:0, for all three Reynolds numbers, a constant ^u RMS was <strong>in</strong>dicated. Conversely, still <strong>in</strong> this<br />
<strong>near</strong>-cyl<strong>in</strong>der region but now for ^w RMS <strong>the</strong>re was <strong>in</strong>stead an approximate 60% <strong>in</strong>crease when pass<strong>in</strong>g<br />
from Re =3 10 3 to Re =8 10 3 . For Re =8 10 3 and x =1:0, a secondary peak for u RMS occurr<strong>in</strong>g<br />
at jyj '0:3 can be noted, see Fig. 4(c). Presumably, this secondary peak occurs when <strong>the</strong> plane x =1:0<br />
(x=`c =0:60) cuts through an upstream part <strong>of</strong> <strong>the</strong> side-lobe conta<strong>in</strong><strong>in</strong>g <strong>the</strong> downstream local maximum<br />
<strong>of</strong> u RMS <strong>in</strong> <strong>the</strong> xy{plane, which is expected to be located close to x = `(2)<br />
u , see [26, 4]. In consequence,<br />
(x = `(2)<br />
u , y = 0) is a saddle-po<strong>in</strong>t for u RMS <strong>in</strong> <strong>the</strong> xy{plane [11].<br />
The outer parts <strong>of</strong> <strong>the</strong> distributions for u RMS at x =1:0 show some notable features regard<strong>in</strong>g <strong>the</strong> po<strong>in</strong>t<br />
<strong>of</strong> transition <strong>in</strong> <strong>the</strong> shear layers. At Re =310 3 , when com<strong>in</strong>g from outside <strong>the</strong> <strong>wake</strong> and go<strong>in</strong>g <strong>in</strong>wards,<br />
u RMS is more or less constant until it suddenly, at around jyj =0:75 rises with<strong>in</strong> <strong>the</strong> region <strong>of</strong> strong<br />
shear, see Fig. 4(c). The same goes for Re =5 10 3 except that <strong>the</strong>re is a small but detectable peak<br />
6
(a)<br />
(b)<br />
(c)<br />
(d)<br />
(e)<br />
(f)<br />
Figure 3: Mean streamwise velocity across <strong>the</strong> <strong>wake</strong>, Uvs:y (left) and U vs. y=y 1=2 (right) at x =0:6 (a,b),<br />
x =1:0 (c,d) and x =2:0 (e,f).Po<strong>in</strong>ts on <strong>the</strong> lower side <strong>of</strong> <strong>the</strong> <strong>wake</strong> (y
(a)<br />
(b)<br />
(c)<br />
(d)<br />
(e)<br />
(f)<br />
Figure 4: uRMS (left) and wRMS (right) across <strong>the</strong> <strong>wake</strong> atx =0:6 (a,b), x =1:0 (c,d) and x =2:0 (e,f). Po<strong>in</strong>ts<br />
on <strong>the</strong> lower side <strong>of</strong> <strong>the</strong> <strong>wake</strong> (y
y-position where U =1=2. The proles for U were compared with <strong>the</strong> follow<strong>in</strong>g function:<br />
U = 1 [ 1 + erf()] (1)<br />
2<br />
where = (y=y 1=2 ; 1), see Fig. 3(b). From eq. 1 <strong>the</strong> maximum velocity gradient<br />
dU<br />
<br />
= U 2 ; U 1 <br />
p (2)<br />
dy<br />
y 1=2<br />
max<br />
occurs at y = y 1=2 . The proles were compared <strong>in</strong> two ways with <strong>the</strong> above shear-layer velocity function.<br />
The rst <strong>in</strong>volved a least-square t to eq. 1over parts <strong>of</strong> <strong>the</strong> prole. In <strong>the</strong> o<strong>the</strong>r <strong>the</strong> value for was<br />
calculated from <strong>the</strong> maximum velocity gradient us<strong>in</strong>g eq. 2. In <strong>the</strong> rst method <strong>the</strong> velocities outside<br />
<strong>the</strong> po<strong>in</strong>t where <strong>the</strong> velocity starts to decrease were taken out. The least-square t was <strong>the</strong>n applied <strong>in</strong><br />
between U =0:4 andU =1:0. To with<strong>in</strong> 6% <strong>the</strong> two methods gave out <strong>the</strong> same shear parameter.<br />
Table 2 conta<strong>in</strong>s <strong>the</strong> mean value between <strong>the</strong> two methods, notwithstand<strong>in</strong>g an <strong>in</strong>dicated higher accuracy<br />
for <strong>the</strong> rst method.<br />
There was a signicant drop <strong>in</strong> <strong>the</strong> shear parameter occurr<strong>in</strong>g <strong>in</strong> between x =0:6 andx =1:0, especially<br />
for Re =8 10 3 . As described earlier, for Re =8 10 3 , <strong>the</strong> transition to turbulence <strong>in</strong> <strong>the</strong> shear layer<br />
is <strong>in</strong>dicated to occur <strong>in</strong> between <strong>the</strong>se x{stations. The drop <strong>in</strong> at x =0:6 <strong>in</strong>between Re =5 10 3 and<br />
Re =8 10 3 suggests that <strong>the</strong> mean po<strong>in</strong>t <strong>of</strong> transition at Re =8 10 3 occurs slightly downstream <strong>of</strong><br />
x =0:6.<br />
The proles were also tested aga<strong>in</strong>st <strong>the</strong> functional shear velocity prole as used <strong>in</strong> Monkewitz & Nguyen<br />
(1987) [25]. This type <strong>of</strong> prole conta<strong>in</strong>s a \shape parameter" N. It is suggested from stability considerations<br />
that <strong>the</strong> absolute <strong>in</strong>stability for <strong>wake</strong> proles is <strong>in</strong>itiated when N =12:5 [25]. When tested<br />
aga<strong>in</strong>st <strong>the</strong> present data <strong>the</strong> optimum N-values were found to be more or less equal (with<strong>in</strong> 6%)to<strong>the</strong><br />
shear parameter . The uncerta<strong>in</strong>ty for <strong>the</strong> reported values <strong>of</strong> <strong>in</strong> Table 2 was estimated to be 10%.<br />
It is <strong>in</strong>ferred <strong>in</strong> Monkewitz & Nguyen (1987) that <strong>the</strong> basic <strong>in</strong>stability frequency, <strong>the</strong>von Karman frequency,<br />
is<strong>in</strong>versely related to <strong>the</strong> half-width y 1=2 at <strong>the</strong> position for change-over between a convectively<br />
and absolutely unstable region <strong>in</strong> <strong>the</strong> separat<strong>in</strong>g shear layers. In a non-dimensional form <strong>the</strong> predicted<br />
transition po<strong>in</strong>t frequency is equal to 1:68=(4y 1=2 )[25]. When applied to x =0:6 atRe =3 10 3 , for<br />
which N ' = 12 and y 1=2 =0:60, <strong>the</strong> frequency is 0.22. This is about 6% higher than <strong>the</strong> reported experimental<br />
Strouhal number at this Re (St =0:210 0:002 [32]). Consider<strong>in</strong>g <strong>the</strong> uncerta<strong>in</strong>ties <strong>in</strong>volved<br />
this may look as an reasonable deviation. However, when applied to x =0:6 for Re =8 10 3 (N ' 11)<br />
<strong>the</strong> frequency becomes 0.24, which is more than 15% higher than <strong>the</strong> experimental value. The relatively<br />
high uncerta<strong>in</strong>ty <strong>in</strong> does not seem to alter this <strong>in</strong>creas<strong>in</strong>g discrepancy with <strong>in</strong>creas<strong>in</strong>g Re. To match<br />
<strong>the</strong> experimental Strouhal number for Re =8 10 3 (St ' 0:203), <strong>the</strong> value y 1=2 ' 0:66 is needed, which<br />
for x 230. A collection <strong>of</strong> previous results for<br />
B z [44, 54, 10, 49, 20, 12] is shown <strong>in</strong> Fig. 5(b) (unlled markers). The results <strong>in</strong> [49] suggest that<br />
<strong>the</strong>re is a slight decrease <strong>in</strong> B z with <strong>in</strong>creas<strong>in</strong>g Re. However, based on <strong>the</strong> observations <strong>in</strong> [2] and [12],<br />
9
B z is likely to rema<strong>in</strong> at around unity or slightly below, up to at least Re =21 10 3 . As shown by<br />
e.g. Brede et al. (1996) [10] <strong>the</strong> rib-like modeBvortices develop very close to <strong>the</strong> base <strong>of</strong> <strong>the</strong> cyl<strong>in</strong>der.<br />
Fur<strong>the</strong>r, as evidenced <strong>in</strong> L<strong>in</strong> et al. (1996) [20] for Re = 5 10 3 and Re = 10 4 at x = 1, <strong>the</strong> mode<br />
B structures manifest <strong>the</strong>mselves <strong>in</strong> particular at <strong>in</strong>stants separated by one-half Karman cycle, when<br />
irrotational uid is drawn across <strong>the</strong> <strong>wake</strong>. As suggested by Williamson [45] <strong>the</strong> mode B structures is<br />
caused by an mix<strong>in</strong>g layer type <strong>of</strong> <strong>in</strong>stability that scales on <strong>the</strong> thickness <strong>of</strong> <strong>the</strong> braid region. Due to<br />
axial stretch<strong>in</strong>g <strong>the</strong> streamwise vorticity amplies strongly <strong>in</strong> <strong>the</strong>se connect<strong>in</strong>g braid regions.<br />
(a)<br />
(b)<br />
Figure 5: (a) Ratio between <strong>the</strong> shear layer frequency and <strong>the</strong> von Karman frequency, fSL=fK. Solid th<strong>in</strong> l<strong>in</strong>e:<br />
A =0:0096, n =0:773 (Wei & Smith '86, lumped anemometry data). Thick solid l<strong>in</strong>e: A =0:0269, n =0:6587<br />
(Prasad & Williamson '96). Dotted l<strong>in</strong>e: A =0:023, n =0:68 (present correlation). (b) Spanwise length scales.<br />
Broken l<strong>in</strong>e: 1800=Re double-dotted l<strong>in</strong>e: 22=Re 0:5 as suggested from Mansy et al. '94 (x =3) SL z from eqns.<br />
(3,4) with =1:8 (dotted l<strong>in</strong>e) and =2=3 (th<strong>in</strong> l<strong>in</strong>e). The unlled marker <strong>of</strong> Chyu & Rockwell '96 represents<br />
<strong>the</strong>ir value at x =1:5 whereas <strong>the</strong> lled marker is for x =0:5.<br />
Ano<strong>the</strong>r important feature <strong>in</strong> <strong>the</strong> <strong>near</strong> <strong>wake</strong> is <strong>the</strong> development <strong>of</strong> shear-layer vortices <strong>in</strong> <strong>the</strong> separat<strong>in</strong>g<br />
shear layers, which show up at around Re =1200;1800 [35]. As shown <strong>in</strong> Fig. 5(a) <strong>the</strong> ratio between <strong>the</strong><br />
observable shear-layer frequency f SL and <strong>the</strong> von Karman frequency f K varies approximately accord<strong>in</strong>g<br />
to: f SL =f K ' A Re n . A least-square t to <strong>the</strong> data <strong>in</strong> Fig. 5(a) [7, 22, 34,41,51,15,19,18,28,9,40,<br />
50, 13]gave (A =0:023, n =0:68), <strong>in</strong> agreement with Prasad & Williamson (1997a) [35].<br />
The streamwise wavelength <strong>of</strong> this <strong>in</strong>stability, SL , is equal to its local streamwise convection velocity<br />
x<br />
divided by f SL . S<strong>in</strong>ce <strong>the</strong> <strong>in</strong>stability is <strong>in</strong>itiated <strong>in</strong> <strong>the</strong> separat<strong>in</strong>g shear-layers <strong>the</strong> convection velocity<br />
can be approximated as half <strong>the</strong> value <strong>of</strong> mean velocity at separation, which <strong>in</strong> turn for suciently high<br />
Re can be estimated as p 1 ; C pb [37, 46]. As a fur<strong>the</strong>r justication, <strong>the</strong> ratio between U 2 at x =0:6<br />
from Table 2 and p 1 ; C pb from [32] is0:96 0:01. The approximate formula for <strong>the</strong> mean streamwise<br />
wavelength becomes:<br />
SL<br />
x<br />
<br />
p 1 ; Cpb<br />
2 St A Re n (3)<br />
where St = f K is <strong>the</strong> Strouhal number. When us<strong>in</strong>g <strong>the</strong> data for St and ;C pb from [32] and values<br />
for A and n as above <strong>the</strong>wavelengths for Reynolds numbers <strong>in</strong> Table 1 are: 0.95, 0.61, 0.45, 0.34, 0.30<br />
(Re=10 3 = 1.5, 3, 5, 8, 10). The last three wavelengths (Re=10 3 = 5, 8, 10) can be compared with results<br />
from a PIV-study by Chyu&Rockwell (1996) [13]. From visual <strong>in</strong>spection <strong>of</strong> <strong>in</strong>stantaneous spanwise<br />
vorticity contours <strong>in</strong> [13] <strong>the</strong> wavelengths are approximately: SL<br />
x =0:43, 0.28 and 0.23, respectively.<br />
When consider<strong>in</strong>g <strong>the</strong> approximations and uncerta<strong>in</strong>ties <strong>in</strong>volved <strong>the</strong> wavelengths from eq. 3 seem to be<br />
<strong>in</strong> fair agreement with <strong>the</strong> <strong>measurements</strong>. The question now istonda relation between SL x and its<br />
spanwise counterpart, SL<br />
z . In symbolic form a factor can be <strong>in</strong>troduced:<br />
SL<br />
z<br />
= SL<br />
x (4)<br />
For observable shear-layer vortices, what is <strong>the</strong> most relevant value for ? In many contexts, e.g. see<br />
[46], <strong>the</strong> value <strong>of</strong> =2=3 is<strong>in</strong>troduced. The solid th<strong>in</strong> l<strong>in</strong>e <strong>in</strong> Fig. 5(b) corresponds to this value and<br />
as seen, also see [46, 50], <strong>the</strong>re is a match with B z occurr<strong>in</strong>g at around Re =10 3 . Actually, <strong>the</strong>re is<br />
10
a correspondence between SL<br />
z us<strong>in</strong>g =2=3 and a thought extension to higher Re for <strong>the</strong> spanwise<br />
correlation lengths as measured at x =3by Mansy et al. (1994) [23], see Fig. 5(b). Never<strong>the</strong>less, <strong>the</strong><br />
value <strong>of</strong> = 2=3 appears to be relevant for free shear layers at <strong>the</strong> <strong>in</strong>ception <strong>of</strong> pair<strong>in</strong>g or merg<strong>in</strong>g<br />
between vortices [17]. However, no merg<strong>in</strong>g is detectable for <strong>the</strong> shear-layer vortices <strong>in</strong> <strong>the</strong> separated<br />
shear layers close to <strong>the</strong> cyl<strong>in</strong>der [12]. From PIV <strong>measurements</strong> at Re =10 4 as presented <strong>in</strong> [12] avalue<br />
<strong>of</strong> = 1:9 is reported, which is <strong>in</strong> general agreement with <strong>the</strong> ratio found dur<strong>in</strong>g <strong>the</strong> <strong>in</strong>itial stage <strong>of</strong><br />
development <strong>of</strong> a mix<strong>in</strong>g layer, which ranges from about =1:6 [17] to =2:0 [5]. The dotted l<strong>in</strong>e <strong>in</strong><br />
Fig. 5(b) corresponds to =1:8, which seems to be a reasonable estimate. For Re =5 10 3 when us<strong>in</strong>g<br />
=1:8 <strong>the</strong> <strong>in</strong>dicated spanwise wavelength <strong>of</strong> shear-layer vortices is SL<br />
z 0:8, which is about <strong>the</strong> same<br />
value as <strong>in</strong>dicated from <strong>measurements</strong> <strong>of</strong> <strong>the</strong> spanwise wavelength <strong>of</strong> mode B-vortices, see Fig. 5(b).<br />
Interest<strong>in</strong>gly, <strong>the</strong> spanwise distance between \spread spots", as noted <strong>in</strong> Yokoi & Kamemoto (1992/3)<br />
[52, 53] for 200
[8] Bloor, M. S., and Gerrard, J. H. Proc. Roy. Soc. (London), Ser. A 294 (1966), 319{342.<br />
[9] Braza, M., Chassa<strong>in</strong>g, P., and Ha M<strong>in</strong>h, H. Phys. Fluids A 2, 8 (1990), 1461{1471.<br />
[10] Brede, M., Eckelmann, H., and Rockwell, D. Phys. Fluids 8, 8 (1996), 2117{2124.<br />
[11] Cantwell, B., and Coles, D. J. Fluid Mech. 136 (1983), 321{374.<br />
[12] Chyu, C. K., and Rockwell, D. J. Fluid Mech. 320 (1996), 117{137.<br />
[13] Chyu, C. K., and Rockwell, D. J. Fluid Mech. 322 (1996), 21{49.<br />
[14] Gerrard, J. H. J. Fluid Mech. 22, 1 (1965), 187{196.<br />
[15] Gerrard, J. H. Phil. Trans. Roy. Soc. London, Ser. A 288, 1354 (Mar. 1978), 351{382.<br />
[16] Henderson, R. D. J. Fluid Mech. 352 (1997), 65{112.<br />
[17] Huang, L. S., and Ho, C. M. J. Fluid Mech. 210 (1990), 475{500.<br />
[18] Kourta, A., Boisson, H. C., Braza, M., and Ha M<strong>in</strong>h, H. In Turbulent Shear Flows 5, Proc. Cornell<br />
Univ. 1985 (1987), pp. 83{97.<br />
[19] Leung, C. T., and Ko, N. W. M. In Heat Transfer 1982, Munchen (1982), Hemisphere, pp. 229{232.<br />
[20] L<strong>in</strong>, J. C., Vorobieff, P., and Rockwell, D. Phys. Fluids 8, 2 (1996), 555{564.<br />
[21] L<strong>in</strong>ke, W. Physik. Zeitschr. 32 (1931), 900{914.<br />
[22] Maekawa, T., and Mizuno, S. Phys. Fluids Suppl. (1967), 184{186.<br />
[23] Mansy, H., Yang, P. M., and Williams, D. R. J. Fluid Mech. 270 (1994), 277{296.<br />
[24] McKillop, A. A., and Durst, F. In Laser Anemometry <strong>in</strong> Fluid Mechanics II (1984), Ladoan Lisboa,<br />
Portugal, pp. 329{346.<br />
[25] Monkewitz, P. A., and Nguyen, L. N. J. Fluids & Struct. 1, 2 (1987), 165{184.<br />
[26] Noca, F., Park, H., and Gharib, M. In Advances <strong>in</strong> <strong>the</strong> Understand<strong>in</strong>g <strong>of</strong> Blu Body Wakes and<br />
Vortex-Induced Vibration, Wash<strong>in</strong>gton D.C. (June 1998), ASME.<br />
[27] Norberg, C. J. W<strong>in</strong>d Eng. Ind. Aero. 23 (1986), 501{514.<br />
[28] Norberg, C. Publ. 87/2, Appl. Thermodyn. & Fluid Mech., Chalmers Univ., Sweden, May 1987.<br />
[29] Norberg, C. In Proc. Fourth Asian Congress <strong>of</strong> Fluid Mechanics, Hong Kong (Aug. 1989), Suppl. Vol.<br />
[30] Norberg, C. In Proc. 11th Australasian Fluid Mechanics Conference, Hobart (Dec. 1992), vol. 1, pp. 507{<br />
510.<br />
[31] Norberg, C. In Blu-Body Wakes, Dynamics and Instabilities, Proc. IUTAM Symp. Gott<strong>in</strong>gen, Sept. 1992<br />
(1993), Spr<strong>in</strong>ger-Verlag, pp. 275{278.<br />
[32] Norberg, C. J. Fluid Mech. 258 (1994), 287{316.<br />
[33] Peltzer, R. D., and Rooney, D. M. ASME J. Fluids Eng. 107 (1985), 86{91.<br />
[34] Peterka, J. A., and Richardson, P. D. J. Fluid Mech. 37, 2 (1969), 265{287.<br />
[35] Prasad, A., and Williamson, C. H. K. J. Fluid Mech. 333 (1997), 375{402.<br />
[36] Prasad, A., and Williamson, C. H. K. J. Fluid Mech. 343 (1997), 235{265.<br />
[37] Roshko, A. NACA TN 3168, National Advisory Committee for Aeronautics, Wash<strong>in</strong>gton D.C., 1953.<br />
[38] Roshko, A. J. W<strong>in</strong>d Eng. Ind. Aero. 49 (1993), 79{100.<br />
[39] Schade, H. Phys. Fluids 7 (1964), 623{628.<br />
[40] Sheridan, J., Soria, J., Wu, J., and Welsh, M. C. In Blu-Body Wakes, Dynamics and Instabilities,<br />
Proc. IUTAM Symp. Gott<strong>in</strong>gen, Sept. 1992 (1993), Spr<strong>in</strong>ger-Verlag, pp. 115{118.<br />
[41] Smith, R. A., Woo Taik Moon, and Kao, T. W. ASME J. Basic Eng. 94 (1972), 771{776.<br />
[42] Szepessy, S., and Bearman, P. W. J. Fluid Mech. 234 (1992), 191{217.<br />
[43] Unal, M. F., and Rockwell, D. J. Fluid Mech. 190 (1988), 491{512.<br />
[44] Williamson, C. H. K. Bull. Am. Phys. Soc. 32 (1987), 2098.<br />
[45] Williamson, C. H. K. Ann. Rev. Fluid Mech. 28 (1996), 477{539.<br />
[46] Williamson, C. H. K., Wu, J., and Sheridan, J. Phys. Fluids 7, 10 (1995), 2307{2309.<br />
[47] Woo, H. G. C., Cermak, J. E., and Peterka, J. A. Tech. Rep. CER81-82HGCW-JEC-JAP7, Colorado<br />
State University, July1981.<br />
[48] Wu, J., Sheridan, J., and Welsh, M. C. ASME J. Fluids Eng. 118 (1996), 531{536.<br />
[49] Wu, J., Sheridan, J., Welsh, M. C., and Hourigan, K. J. Fluid Mech. 312 (1996), 201{222.<br />
[50] Wu, J., Sheridan, J. Hourigan, K., and Soria, J. Exp. Thermal & Fluid Science 12, 2 (1996), 169{174.<br />
[51] Yamanaka, G., Imaichi, K., and Adachi, T. DISA Information No. 14 (1973), 37{44.<br />
[52] Yokoi, Y., and Kamemoto, K. JSME Int. Journal, Ser. II 35, 2 (1992), 189{195.<br />
[53] Yokoi, Y., and Kamemoto, K. JSME Int. Journal, Series B 36, 2 (1993), 201{206.<br />
[54] Zhang, H. Q., Fey, U., Noack, B. R., Konig, M., and Eckelmann, H. Phys. Fluids 7, 4 (1995),<br />
779{793.<br />
12