Metrics and Benchmarks for Energy Efficiency in Laboratories - I2SL
Metrics and Benchmarks for Energy Efficiency in Laboratories - I2SL
Metrics and Benchmarks for Energy Efficiency in Laboratories - I2SL

You also want an ePaper? Increase the reach of your titles
YUMPU automatically turns print PDFs into web optimized ePapers that Google loves.
LABS FOR THE 21ST CENTURY<br />
3<br />
Basel<strong>in</strong>e <strong>for</strong> percentage reduction: There are two commonly<br />
used ways to express percentage reduction:<br />
1. percentage reduction relative to total loads (<strong>in</strong>clud<strong>in</strong>g<br />
process loads)<br />
2. percentage reduction relative to “regulated loads”<br />
(exclud<strong>in</strong>g process loads)<br />
Appendix G of the 2004 version specifies the first<br />
approach (i.e., based on total loads). Earlier versions of<br />
LEED-NC (prior to 2.2) followed the second approach.<br />
This often created confusion about what was <strong>in</strong>cluded or<br />
excluded <strong>in</strong> the percentage calculation, <strong>and</strong> was especially<br />
problematic <strong>in</strong> laboratory build<strong>in</strong>gs. For example, fume<br />
hoods were sometimes <strong>in</strong>cluded because they were part<br />
of the HVAC system, <strong>and</strong> other times excluded because<br />
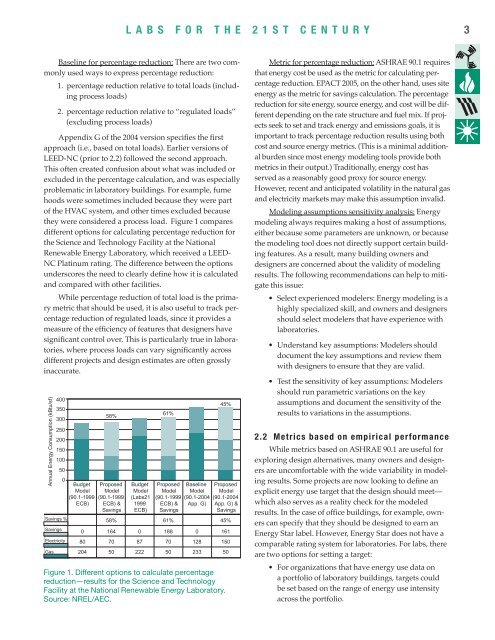
they were considered a process load. Figure 1 compares<br />
different options <strong>for</strong> calculat<strong>in</strong>g percentage reduction <strong>for</strong><br />
the Science <strong>and</strong> Technology Facility at the National<br />
Renewable <strong>Energy</strong> Laboratory, which received a LEED-<br />
NC Plat<strong>in</strong>um rat<strong>in</strong>g. The difference between the options<br />
underscores the need to clearly def<strong>in</strong>e how it is calculated<br />
<strong>and</strong> compared with other facilities.<br />
While percentage reduction of total load is the primary<br />
metric that should be used, it is also useful to track percentage<br />
reduction of regulated loads, s<strong>in</strong>ce it provides a<br />
measure of the efficiency of features that designers have<br />
significant control over. This is particularly true <strong>in</strong> laboratories,<br />
where process loads can vary significantly across<br />
different projects <strong>and</strong> design estimates are often grossly<br />
<strong>in</strong>accurate.<br />
Annual <strong>Energy</strong> Consumption (kBtu/sf)<br />
100<br />
50<br />
0<br />
Sav<strong>in</strong>gs %<br />
Sav<strong>in</strong>gs<br />
Electricity<br />
Gas<br />
400<br />
350<br />
300<br />
250<br />
200<br />
150<br />
Budget<br />
Model<br />
(90.1-1999<br />
ECB)<br />
0<br />
80<br />
204<br />
58%<br />
Proposed<br />
Model<br />
(90.1-1999<br />
ECB) &<br />
Sav<strong>in</strong>gs<br />
58%<br />
164<br />
70<br />
50<br />
Budget<br />
Model<br />
(Labs21<br />
1999<br />
ECB)<br />
0<br />
87<br />
222<br />
61%<br />
Proposed<br />
Model<br />
(90.1-1999<br />
ECB) &<br />
Sav<strong>in</strong>gs<br />
61%<br />
188<br />
70<br />
50<br />
Basel<strong>in</strong>e<br />
Model<br />
(90.1-2004<br />
App. G)<br />
0<br />
128<br />
233<br />
45%<br />
Proposed<br />
Model<br />
(90.1-2004<br />
App. G) &<br />
Sav<strong>in</strong>gs<br />
Figure 1. Different options to calculate percentage<br />
reduction—results <strong>for</strong> the Science <strong>and</strong> Technology<br />
Facility at the National Renewable <strong>Energy</strong> Laboratory.<br />
Source: NREL/AEC.<br />
45%<br />
161<br />
150<br />
50<br />
Metric <strong>for</strong> percentage reduction: ASHRAE 90.1 requires<br />
that energy cost be used as the metric <strong>for</strong> calculat<strong>in</strong>g percentage<br />
reduction. EPACT 2005, on the other h<strong>and</strong>, uses site<br />
energy as the metric <strong>for</strong> sav<strong>in</strong>gs calculation. The percentage<br />
reduction <strong>for</strong> site energy, source energy, <strong>and</strong> cost will be different<br />
depend<strong>in</strong>g on the rate structure <strong>and</strong> fuel mix. If projects<br />
seek to set <strong>and</strong> track energy <strong>and</strong> emissions goals, it is<br />
important to track percentage reduction results us<strong>in</strong>g both<br />
cost <strong>and</strong> source energy metrics. (This is a m<strong>in</strong>imal additional<br />
burden s<strong>in</strong>ce most energy model<strong>in</strong>g tools provide both<br />
metrics <strong>in</strong> their output.) Traditionally, energy cost has<br />
served as a reasonably good proxy <strong>for</strong> source energy.<br />
However, recent <strong>and</strong> anticipated volatility <strong>in</strong> the natural gas<br />
<strong>and</strong> electricity markets may make this assumption <strong>in</strong>valid.<br />
Model<strong>in</strong>g assumptions sensitivity analysis: <strong>Energy</strong><br />
model<strong>in</strong>g always requires mak<strong>in</strong>g a host of assumptions,<br />
either because some parameters are unknown, or because<br />
the model<strong>in</strong>g tool does not directly support certa<strong>in</strong> build<strong>in</strong>g<br />
features. As a result, many build<strong>in</strong>g owners <strong>and</strong><br />
designers are concerned about the validity of model<strong>in</strong>g<br />
results. The follow<strong>in</strong>g recommendations can help to mitigate<br />
this issue:<br />
• Select experienced modelers: <strong>Energy</strong> model<strong>in</strong>g is a<br />
highly specialized skill, <strong>and</strong> owners <strong>and</strong> designers<br />
should select modelers that have experience with<br />
laboratories.<br />
• Underst<strong>and</strong> key assumptions: Modelers should<br />
document the key assumptions <strong>and</strong> review them<br />
with designers to ensure that they are valid.<br />
• Test the sensitivity of key assumptions: Modelers<br />
should run parametric variations on the key<br />
assumptions <strong>and</strong> document the sensitivity of the<br />
results to variations <strong>in</strong> the assumptions.<br />
2.2 <strong>Metrics</strong> based on empirical per<strong>for</strong>mance<br />
While metrics based on ASHRAE 90.1 are useful <strong>for</strong><br />
explor<strong>in</strong>g design alternatives, many owners <strong>and</strong> designers<br />
are uncom<strong>for</strong>table with the wide variability <strong>in</strong> model<strong>in</strong>g<br />
results. Some projects are now look<strong>in</strong>g to def<strong>in</strong>e an<br />
explicit energy use target that the design should meet—<br />
which also serves as a reality check <strong>for</strong> the modeled<br />
results. In the case of office build<strong>in</strong>gs, <strong>for</strong> example, owners<br />
can specify that they should be designed to earn an<br />
<strong>Energy</strong> Star label. However, <strong>Energy</strong> Star does not have a<br />
comparable rat<strong>in</strong>g system <strong>for</strong> laboratories. For labs, there<br />
are two options <strong>for</strong> sett<strong>in</strong>g a target:<br />
• For organizations that have energy use data on<br />
a portfolio of laboratory build<strong>in</strong>gs, targets could<br />
be set based on the range of energy use <strong>in</strong>tensity<br />
across the portfolio.