Metrics and Benchmarks for Energy Efficiency in Laboratories - I2SL
Metrics and Benchmarks for Energy Efficiency in Laboratories - I2SL
Metrics and Benchmarks for Energy Efficiency in Laboratories - I2SL

Create successful ePaper yourself
Turn your PDF publications into a flip-book with our unique Google optimized e-Paper software.
4 LABS FOR THE 21ST CENTURY<br />
<br />
<br />
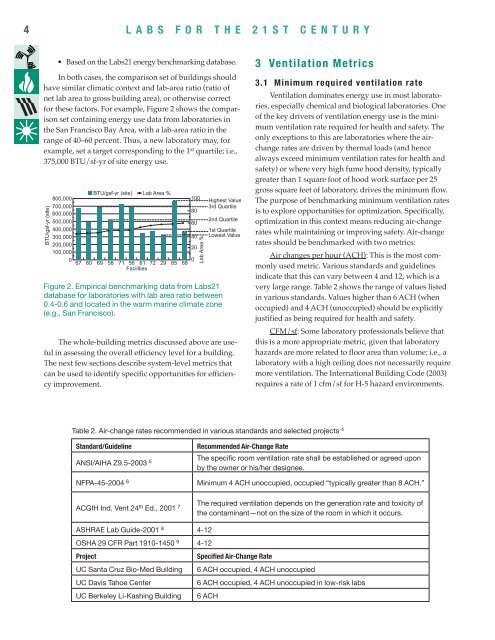
• Based on the Labs21 energy benchmark<strong>in</strong>g database.<br />
In both cases, the comparison set of build<strong>in</strong>gs should<br />
have similar climatic context <strong>and</strong> lab-area ratio (ratio of<br />
net lab area to gross build<strong>in</strong>g area), or otherwise correct<br />
<strong>for</strong> these factors. For example, Figure 2 shows the comparison<br />
set conta<strong>in</strong><strong>in</strong>g energy use data from laboratories <strong>in</strong><br />
the San Francisco Bay Area, with a lab-area ratio <strong>in</strong> the<br />
range of 40–60 percent. Thus, a new laboratory may, <strong>for</strong><br />
example, set a target correspond<strong>in</strong>g to the 1 st quartile; i.e.,<br />
375,000 BTU/sf-yr of site energy use.<br />
BTU/gsf-yr (site)<br />
800,000<br />
700,000<br />
600,000<br />
500,000<br />
400,000<br />
300,000<br />
200,000<br />
100,000<br />
0<br />
BTU/gsf-yr (site) Lab Area %<br />
67 60 69 58 71 56 61 72 29 65 68<br />
Facilities<br />
Figure 2. Empirical benchmark<strong>in</strong>g data from Labs21<br />
database <strong>for</strong> laboratories with lab area ratio between<br />
0.4-0.6 <strong>and</strong> located <strong>in</strong> the warm mar<strong>in</strong>e climate zone<br />
(e.g., San Francisco).<br />
The whole-build<strong>in</strong>g metrics discussed above are useful<br />
<strong>in</strong> assess<strong>in</strong>g the overall efficiency level <strong>for</strong> a build<strong>in</strong>g.<br />
The next few sections describe system-level metrics that<br />
can be used to identify specific opportunities <strong>for</strong> efficiency<br />
improvement.<br />
3 Ventilation <strong>Metrics</strong><br />
3.1 M<strong>in</strong>imum required ventilation rate<br />
Ventilation dom<strong>in</strong>ates energy use <strong>in</strong> most laboratories,<br />
especially chemical <strong>and</strong> biological laboratories. One<br />
of the key drivers of ventilation energy use is the m<strong>in</strong>imum<br />
ventilation rate required <strong>for</strong> health <strong>and</strong> safety. The<br />
only exceptions to this are laboratories where the airchange<br />
rates are driven by thermal loads (<strong>and</strong> hence<br />
always exceed m<strong>in</strong>imum ventilation rates <strong>for</strong> health <strong>and</strong><br />
safety) or where very high fume hood density, typically<br />
greater than 1 square foot of hood work surface per 25<br />
gross square feet of laboratory, drives the m<strong>in</strong>imum flow.<br />
100 The purpose of benchmark<strong>in</strong>g m<strong>in</strong>imum ventilation rates<br />
Highest Value<br />
3rd Quartile<br />
80<br />
is to explore opportunities <strong>for</strong> optimization. Specifically,<br />
60<br />
2nd Quartile<br />
optimization <strong>in</strong> this context means reduc<strong>in</strong>g air-change<br />
40<br />
1st Quartile<br />
Lowest Value<br />
rates while ma<strong>in</strong>ta<strong>in</strong><strong>in</strong>g or improv<strong>in</strong>g safety. Air-change<br />
rates should be benchmarked with two metrics:<br />
20<br />
0<br />
Lab Area %<br />
Air changes per hour (ACH): This is the most commonly<br />
used metric. Various st<strong>and</strong>ards <strong>and</strong> guidel<strong>in</strong>es<br />
<strong>in</strong>dicate that this can vary between 4 <strong>and</strong> 12, which is a<br />
very large range. Table 2 shows the range of values listed<br />
<strong>in</strong> various st<strong>and</strong>ards. Values higher than 6 ACH (when<br />
occupied) <strong>and</strong> 4 ACH (unoccupied) should be explicitly<br />
justified as be<strong>in</strong>g required <strong>for</strong> health <strong>and</strong> safety.<br />
CFM/sf: Some laboratory professionals believe that<br />
this is a more appropriate metric, given that laboratory<br />
hazards are more related to floor area than volume; i.e., a<br />
laboratory with a high ceil<strong>in</strong>g does not necessarily require<br />
more ventilation. The International Build<strong>in</strong>g Code (2003)<br />
requires a rate of 1 cfm/sf <strong>for</strong> H-5 hazard environments.<br />
Table 2. Air-change rates recommended <strong>in</strong> various st<strong>and</strong>ards <strong>and</strong> selected projects 4<br />
St<strong>and</strong>ard/Guidel<strong>in</strong>e<br />
ANSI/AIHA Z9.5-2003 5<br />
NFPA-45-2004 6<br />
ACGIH Ind. Vent 24 th Ed., 2001 7<br />
Recommended Air-Change Rate<br />
The specific room ventilation rate shall be established or agreed upon<br />
by the owner or his/her designee.<br />
M<strong>in</strong>imum 4 ACH unoccupied, occupied “typically greater than 8 ACH.”<br />
The required ventilation depends on the generation rate <strong>and</strong> toxicity of<br />
the contam<strong>in</strong>ant—not on the size of the room <strong>in</strong> which it occurs.<br />
ASHRAE Lab Guide-2001 8 4-12<br />
OSHA 29 CFR Part 1910-1450 9 4-12<br />
Project<br />
Specified Air-Change Rate<br />
UC Santa Cruz Bio-Med Build<strong>in</strong>g 6 ACH occupied, 4 ACH unoccupied<br />
UC Davis Tahoe Center<br />
6 ACH occupied, 4 ACH unoccupied <strong>in</strong> low-risk labs<br />
UC Berkeley Li-Kash<strong>in</strong>g Build<strong>in</strong>g 6 ACH