
You also want an ePaper? Increase the reach of your titles
YUMPU automatically turns print PDFs into web optimized ePapers that Google loves.
Air Transport Market Analysis<br />
<strong>December</strong> 2010<br />
COMPARING DECEMBER TO NOVEMBER<br />
Month on<br />
Month<br />
Comparison<br />
<strong>December</strong> 2010 vs. November 2010<br />
RPK ASK PLF pt FTK AFTK FLF pt<br />
Africa 1.2% -0.7% 1.3% -4.1% -3.3% -0.2%<br />
Asia/Pacific -0.2% 0.2% -0.3% 1.9% -0.1% 1.3%<br />
Europe -1.9% -3.1% 1.0% -1.3% -0.1% -0.6%<br />
Latin America -0.6% -0.4% -0.2% -1.3% -1.4% 0.0%<br />
Middle East 0.3% -0.1% 0.3% 2.0% -0.4% 1.1%<br />
North America 0.0% 0.0% 0.0% 5.4% 1.5% 1.6%<br />
Industry -0.7% -1.2% 0.4% 1.5% 0.0% 0.8%<br />
Data are seasonally adjusted.<br />
All figures are expressed in % change month on month except, PLF pt and FLF<br />
pt which are the percentage point difference between load factors of two<br />
consecutive months.<br />
On a seasonally adjusted basis whilst<br />
passenger traffic declined by just under<br />
1%, freight traffic increased by some 1.5%<br />
Adjusting for the effects of the severe<br />
winter weather suggests that passenger<br />
traffic rose moderately.<br />
Europe in particular was affected by the<br />
severe winter weather which is reflected in<br />
the monthly figures.<br />
The bankruptcy of Mexicana continues to<br />
have an impact on Latin America although<br />
this will continue to diminish.<br />
In terms of freight North America was up<br />
by some 5.4% although this should be<br />
looked at against the November figures<br />
where there was a decline of some 7% in<br />
FTKs which suggests a timing issue.<br />
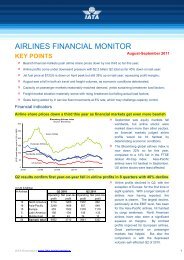
AIR TRAVEL VOLUME GROWTH TEMPORARILY DENTED BY WEATHER<br />
300<br />
International Passenger Traffic<br />
Source: <strong>IATA</strong><br />
20<br />
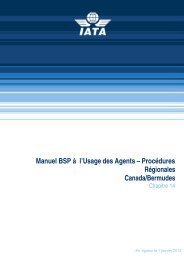
Passenger Growth By Region<br />
Source: <strong>IATA</strong><br />
Nov-10<br />
Dec-10<br />
Monthly RPKs (Billion)<br />
280<br />
260<br />
240<br />
220<br />
200<br />
180<br />
160<br />
Actual<br />
Seasonally Adjusted<br />
% Growth in RPKs<br />
15<br />
10<br />
5<br />
0<br />
13.3<br />
11.7<br />
5.6<br />
2.9<br />
7.8<br />
3.3<br />
0.6<br />
-1.1<br />
16.8<br />
14.1<br />
9.5<br />
6.7<br />
8.2<br />
4.9<br />
May-05<br />
Aug-05<br />
Nov-05<br />
Feb-06<br />
May-06<br />
Aug-06<br />
Nov-06<br />
Feb-07<br />
May-07<br />
Aug-07<br />
Nov-07<br />
Feb-08<br />
May-08<br />
Aug-08<br />
Nov-08<br />
Feb-09<br />
May-09<br />
Aug-09<br />
Nov-09<br />
Feb-10<br />
May-10<br />
Aug-10<br />
Nov-10<br />
-5<br />
Africa Asia Pacific Europe Latin<br />
America<br />
Middle East<br />
North<br />
America<br />
Total<br />
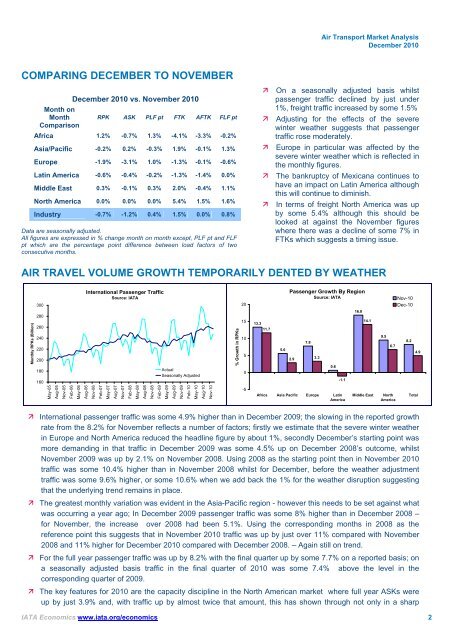
International passenger traffic was some 4.9% higher than in <strong>December</strong> 2009; the slowing in the reported growth<br />
rate from the 8.2% for November reflects a number of factors; firstly we estimate that the severe winter weather<br />
in Europe and North America reduced the headline figure by about 1%, secondly <strong>December</strong>’s starting point was<br />
more demanding in that traffic in <strong>December</strong> 2009 was some 4.5% up on <strong>December</strong> 2008’s outcome, whilst<br />
November 2009 was up by 2.1% on November 2008. Using 2008 as the starting point then in November 2010<br />
traffic was some 10.4% higher than in November 2008 whilst for <strong>December</strong>, before the weather adjustment<br />
traffic was some 9.6% higher, or some 10.6% when we add back the 1% for the weather disruption suggesting<br />
that the underlying trend remains in place.<br />
The greatest monthly variation was evident in the Asia-Pacific region - however this needs to be set against what<br />
was occurring a year ago; In <strong>December</strong> 2009 passenger traffic was some 8% higher than in <strong>December</strong> 2008 –<br />
for November, the increase over 2008 had been 5.1%. Using the corresponding months in 2008 as the<br />
reference point this suggests that in November 2010 traffic was up by just over 11% compared with November<br />
2008 and 11% higher for <strong>December</strong> 2010 compared with <strong>December</strong> 2008. – Again still on trend.<br />
For the full year passenger traffic was up by 8.2% with the final quarter up by some 7.7% on a reported basis; on<br />
a seasonally adjusted basis traffic in the final quarter of 2010 was some 7.4% above the level in the<br />
corresponding quarter of 2009.<br />
The key features for 2010 are the capacity discipline in the North American market where full year ASKs were<br />
up by just 3.9% and, with traffic up by almost twice that amount, this has shown through not only in a sharp<br />
<strong>IATA</strong> Economics www.iata.org/economics 2