
Create successful ePaper yourself
Turn your PDF publications into a flip-book with our unique Google optimized e-Paper software.
Air Transport Market Analysis<br />
<strong>December</strong> 2010<br />
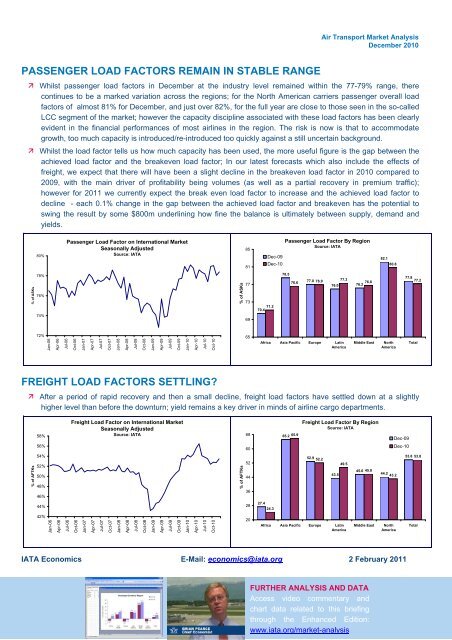
PASSENGER LOAD FACTORS REMAIN IN STABLE RANGE<br />
Whilst passenger load factors in <strong>December</strong> at the industry level remained within the 77-79% range, there<br />
continues to be a marked variation across the regions; for the North American carriers passenger overall load<br />
factors of almost 81% for <strong>December</strong>, and just over 82%, for the full year are close to those seen in the so-called<br />
LCC segment of the market; however the capacity discipline associated with these load factors has been clearly<br />
evident in the financial performances of most airlines in the region. The risk is now is that to accommodate<br />
growth, too much capacity is introduced/re-introduced too quickly against a still uncertain background.<br />
Whilst the load factor tells us how much capacity has been used, the more useful figure is the gap between the<br />
achieved load factor and the breakeven load factor; In our latest forecasts which also include the effects of<br />
freight, we expect that there will have been a slight decline in the breakeven load factor in 2010 compared to<br />
2009, with the main driver of profitability being volumes (as well as a partial recovery in premium traffic);<br />
however for 2011 we currently expect the break even load factor to increase and the achieved load factor to<br />
decline - each 0.1% change in the gap between the achieved load factor and breakeven has the potential to<br />
swing the result by some $800m underlining how fine the balance is ultimately between supply, demand and<br />
yields.<br />
80%<br />
Passenger Load Factor on International Market<br />
Seasonally Adjusted<br />
Source: <strong>IATA</strong><br />
85<br />
81<br />
Dec-09<br />
Dec-10<br />
Passenger Load Factor By Region<br />
Source: <strong>IATA</strong><br />
82.1<br />
80.8<br />
% of ASKs<br />
78%<br />
76%<br />
74%<br />
% of ASKs<br />
77<br />
73<br />
69<br />
71.2<br />
70.4<br />
78.5<br />
76.6<br />
77.0 76.9<br />
77.3<br />
76.8<br />
76.0 76.2<br />
77.8<br />
77.2<br />
72%<br />
Jan-06<br />
Apr-06<br />
Jul-06<br />
Oct-06<br />
Jan-07<br />
Apr-07<br />
Jul-07<br />
Oct-07<br />
Jan-08<br />
Apr-08<br />
Jul-08<br />
Oct-08<br />
Jan-09<br />
Apr-09<br />
Jul-09<br />
Oct-09<br />
Jan-10<br />
Apr-10<br />
Jul-10<br />
Oct-10<br />
65<br />
Africa Asia Pacific Europe Latin<br />
America<br />
Middle East<br />
North<br />
America<br />
Total<br />
FREIGHT LOAD FACTORS SETTLING?<br />
After a period of rapid recovery and then a small decline, freight load factors have settled down at a slightly<br />
higher level than before the downturn; yield remains a key driver in minds of airline cargo departments.<br />
58%<br />
Freight Load Factor on International Market<br />
Seasonally Adjusted<br />
Source: <strong>IATA</strong><br />
68<br />
65.2 65.9<br />
Freight Load Factor By Region<br />
Source: <strong>IATA</strong><br />
Dec-09<br />
56%<br />
60<br />
Dec-10<br />
% of AFTKs<br />
54%<br />
52%<br />
50%<br />
48%<br />
46%<br />
% of AFTKs<br />
52<br />
44<br />
36<br />
52.9 52.2<br />
43.5<br />
49.5<br />
45.6 45.8<br />
44.2<br />
43.2<br />
53.8 53.8<br />
44%<br />
28<br />
27.4<br />
24.3<br />
42%<br />
Jan-06<br />
Apr-06<br />
Jul-06<br />
Oct-06<br />
Jan-07<br />
Apr-07<br />
Jul-07<br />
Oct-07<br />
Jan-08<br />
Apr-08<br />
Jul-08<br />
Oct-08<br />
Jan-09<br />
Apr-09<br />
Jul-09<br />
Oct-09<br />
Jan-10<br />
Apr-10<br />
Jul-10<br />
Oct-10<br />
20<br />
Africa Asia Pacific Europe Latin<br />
America<br />
Middle East<br />
North<br />
America<br />
Total<br />
<strong>IATA</strong> Economics E-Mail: economics@iata.org 2 February 2011<br />
FURTHER ANALYSIS AND DATA<br />
Access video commentary and<br />
chart data related to this briefing<br />
<strong>IATA</strong> Economics www.iata.org/economics through the Enhanced Edition:<br />
4<br />
www.iata.org/market-analysis