Biannual Survey of Suppliers of Business ... - Industrie Canada
Biannual Survey of Suppliers of Business ... - Industrie Canada
Biannual Survey of Suppliers of Business ... - Industrie Canada

Create successful ePaper yourself
Turn your PDF publications into a flip-book with our unique Google optimized e-Paper software.
populaires continued to increase loans as well, with disbursals<br />
rising 10.3 percent in the second half <strong>of</strong> 2012 compared with<br />
the first half <strong>of</strong> 2012. Loan disbursals by domestic banks, which<br />
make up 42.2 percent <strong>of</strong> the new loans market, also continued<br />
to grow steadily increasing disbursals by 3.4 percent in the<br />
second half <strong>of</strong> 2012 compared with the first half <strong>of</strong> 2012. Yearover-year,<br />
loans from domestic banks, other banks (including<br />
foreign), credit unions and Caisses populaires have increased<br />
by 10 percent, 27 percent, and 19 percent respectively.<br />
Table 1: Value <strong>of</strong> credit disbursed ($ millions) by<br />
supplier type<br />
2011 2012<br />
Supplier type H1 H2 H1 H2<br />
Domestic banks 26,726 29,994 30,563 31,609<br />
Other banks 15,609 13,191 16,567 19,962<br />
Credit unions, Caisses 6,744 7,419 8,029 8,856<br />
populaires<br />
Finance companies 6,876 8,081 9,370 9,242<br />
Insurance companies 5,578 5,964 5,850 5,193<br />
and portfolio managers<br />
All suppliers 61,533 64,648 70,379 74,862<br />
Source: Statistics <strong>Canada</strong>, <strong>Biannual</strong> <strong>Survey</strong> <strong>of</strong> <strong>Suppliers</strong> <strong>of</strong> <strong>Business</strong><br />
Financing, 2012.<br />
Industry Conditions<br />
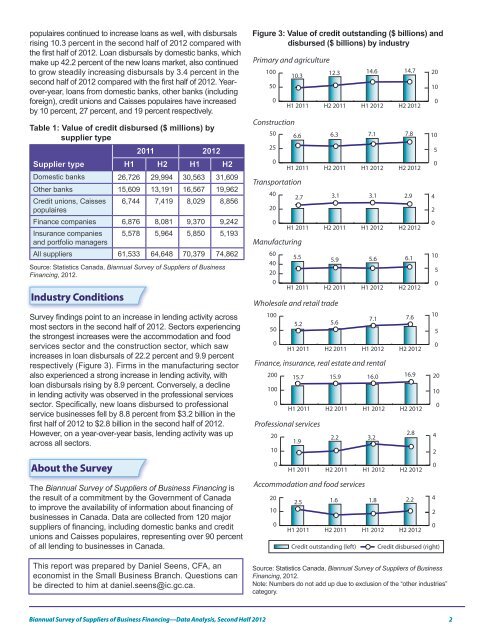
<strong>Survey</strong> findings point to an increase in lending activity across<br />
most sectors in the second half <strong>of</strong> 2012. Sectors experiencing<br />
the strongest increases were the accommodation and food<br />
services sector and the construction sector, which saw<br />
increases in loan disbursals <strong>of</strong> 22.2 percent and 9.9 percent<br />
respectively (Figure 3). Firms in the manufacturing sector<br />
also experienced a strong increase in lending activity, with<br />
loan disbursals rising by 8.9 percent. Conversely, a decline<br />
in lending activity was observed in the pr<strong>of</strong>essional services<br />
sector. Specifically, new loans disbursed to pr<strong>of</strong>essional<br />
service businesses fell by 8.8 percent from $3.2 billion in the<br />
first half <strong>of</strong> 2012 to $2.8 billion in the second half <strong>of</strong> 2012.<br />
However, on a year-over-year basis, lending activity was up<br />
across all sectors.<br />
About the <strong>Survey</strong><br />
The <strong>Biannual</strong> <strong>Survey</strong> <strong>of</strong> <strong>Suppliers</strong> <strong>of</strong> <strong>Business</strong> Financing is<br />
the result <strong>of</strong> a commitment by the Government <strong>of</strong> <strong>Canada</strong><br />
to improve the availability <strong>of</strong> information about financing <strong>of</strong><br />
businesses in <strong>Canada</strong>. Data are collected from 120 major<br />
suppliers <strong>of</strong> financing, including domestic banks and credit<br />
unions and Caisses populaires, representing over 90 percent<br />
<strong>of</strong> all lending to businesses in <strong>Canada</strong>.<br />
This report was prepared by Daniel Seens, CFA, an<br />
economist in the Small <strong>Business</strong> Branch. Questions can<br />
be directed to him at daniel.seens@ic.gc.ca.<br />
Figure 3: Value <strong>of</strong> credit outstanding ($ billions) and<br />
disbursed ($ billions) by industry<br />
Primary and agriculture<br />
100<br />
10.3<br />
12.3 14.6<br />
50<br />
0<br />
Construction<br />
50<br />
25<br />
0<br />
H1 2011<br />
6.6<br />
H1 2011<br />
Transportation<br />
40<br />
20<br />
0<br />
2.7<br />
H1 2011<br />
Manufacturing<br />
60<br />
40<br />
20<br />
0<br />
5.5<br />
H1 2011<br />
H2 2011<br />
H2 2011<br />
H1 2012<br />
H1 2012<br />
3.1 3.1<br />
H2 2011<br />
H1 2012<br />
5.9 5.6<br />
H2 2011<br />
Wholesale and retail trade<br />
100<br />
50<br />
0<br />
5.2<br />
H1 2011<br />
H2 2011<br />
H1 2012<br />
H1 2012<br />
Finance, insurance, real estate and rental<br />
200<br />
100<br />
0<br />
15.7<br />
H1 2011<br />
Pr<strong>of</strong>essional services<br />
20<br />
10<br />
0<br />
1.9<br />
H1 2011<br />
15.9 16.0<br />
H2 2011<br />
H1 2012<br />
2.2 3.2<br />
H2 2011<br />
Accommodation and food services<br />
20<br />
10<br />
0<br />
2.5<br />
H1 2011<br />
6.3 7.1<br />
5.6<br />
H1 2012<br />
1.6 1.8<br />
H2 2011<br />
Credit outstanding (left)<br />
H2 2012<br />
H2 2012<br />
H2 2012<br />
H2 2012<br />
H2 2012<br />
H2 2012<br />
Source: Statistics <strong>Canada</strong>, <strong>Biannual</strong> <strong>Survey</strong> <strong>of</strong> <strong>Suppliers</strong> <strong>of</strong> <strong>Business</strong><br />
Financing, 2012.<br />
Note: Numbers do not add up due to exclusion <strong>of</strong> the “other industries”<br />
category.<br />
7.1<br />
H1 2012<br />
14.7<br />
7.8<br />
2.9<br />
6.1<br />
7.6<br />
16.9<br />
2.8<br />
H2 2012<br />
2.2<br />
H2 2012<br />
20<br />
10<br />
0<br />
10<br />
4<br />
2<br />
0<br />
5<br />
0<br />
10<br />
5<br />
0<br />
10<br />
5<br />
0<br />
20<br />
10<br />
4<br />
2<br />
0<br />
4<br />
2<br />
0<br />
0<br />
Credit disbursed (right)<br />
<strong>Biannual</strong> <strong>Survey</strong> <strong>of</strong> <strong>Suppliers</strong> <strong>of</strong> <strong>Business</strong> Financing—Data Analysis, Second Half 2012 2