Electrical resistance tomography for monitoring emulsions and foams
Electrical resistance tomography for monitoring emulsions and foams
Electrical resistance tomography for monitoring emulsions and foams

Create successful ePaper yourself
Turn your PDF publications into a flip-book with our unique Google optimized e-Paper software.
<strong>Electrical</strong> <strong>resistance</strong> <strong>tomography</strong> <strong>for</strong> <strong>monitoring</strong> <strong>emulsions</strong> <strong>and</strong> <strong>foams</strong><br />
Thodoris D. Karapantsios*, Margaritis Kostoglou<br />
School of Chemistry, Department of Chemical Technology & Industrial Chemistry,<br />
Aristotle University of Thessaloniki, University Box 116, 541 24 Thessaloniki, Greece<br />
*corresponding author email: karapant@chem.auth.gr<br />
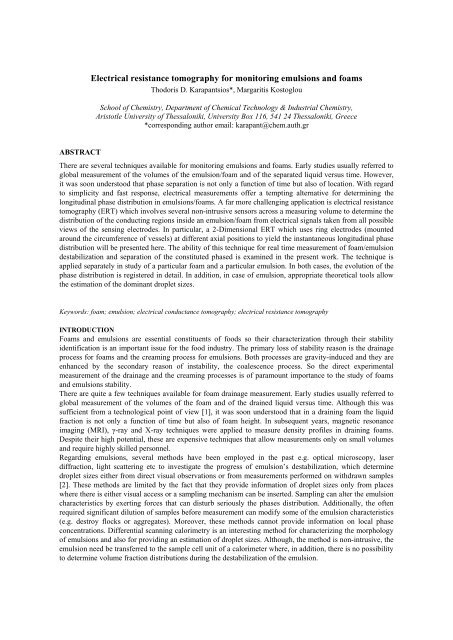
ABSTRACT<br />
There are several techniques available <strong>for</strong> <strong>monitoring</strong> <strong>emulsions</strong> <strong>and</strong> <strong>foams</strong>. Early studies usually referred to<br />
global measurement of the volumes of the emulsion/foam <strong>and</strong> of the separated liquid versus time. However,<br />
it was soon understood that phase separation is not only a function of time but also of location. With regard<br />
to simplicity <strong>and</strong> fast response, electrical measurements offer a tempting alternative <strong>for</strong> determining the<br />
longitudinal phase distribution in <strong>emulsions</strong>/<strong>foams</strong>. A far more challenging application is electrical <strong>resistance</strong><br />
<strong>tomography</strong> (ERT) which involves several non-intrusive sensors across a measuring volume to determine the<br />
distribution of the conducting regions inside an emulsion/foam from electrical signals taken from all possible<br />
views of the sensing electrodes. In particular, a 2-Dimensional ERT which uses ring electrodes (mounted<br />
around the circumference of vessels) at different axial positions to yield the instantaneous longitudinal phase<br />
distribution will be presented here. The ability of this technique <strong>for</strong> real time measurement of foam/emulsion<br />
destabilization <strong>and</strong> separation of the constituted phased is examined in the present work. The technique is<br />
applied separately in study of a particular foam <strong>and</strong> a particular emulsion. In both cases, the evolution of the<br />
phase distribution is registered in detail. In addition, in case of emulsion, appropriate theoretical tools allow<br />
the estimation of the dominant droplet sizes.<br />
Keywords: foam; emulsion; electrical conductance <strong>tomography</strong>; electrical <strong>resistance</strong> <strong>tomography</strong><br />
INTRODUCTION<br />
Foams <strong>and</strong> <strong>emulsions</strong> are essential constituents of foods so their characterization through their stability<br />
identification is an important issue <strong>for</strong> the food industry. The primary loss of stability reason is the drainage<br />
process <strong>for</strong> <strong>foams</strong> <strong>and</strong> the creaming process <strong>for</strong> <strong>emulsions</strong>. Both processes are gravity-induced <strong>and</strong> they are<br />
enhanced by the secondary reason of instability, the coalescence process. So the direct experimental<br />
measurement of the drainage <strong>and</strong> the creaming processes is of paramount importance to the study of <strong>foams</strong><br />
<strong>and</strong> <strong>emulsions</strong> stability.<br />
There are quite a few techniques available <strong>for</strong> foam drainage measurement. Early studies usually referred to<br />
global measurement of the volumes of the foam <strong>and</strong> of the drained liquid versus time. Although this was<br />
sufficient from a technological point of view [1], it was soon understood that in a draining foam the liquid<br />
fraction is not only a function of time but also of foam height. In subsequent years, magnetic resonance<br />
imaging (MRI), γ-ray <strong>and</strong> X-ray techniques were applied to measure density profiles in draining <strong>foams</strong>.<br />
Despite their high potential, these are expensive techniques that allow measurements only on small volumes<br />
<strong>and</strong> require highly skilled personnel.<br />
Regarding <strong>emulsions</strong>, several methods have been employed in the past e.g. optical microscopy, laser<br />
diffraction, light scattering etc to investigate the progress of emulsion’s destabilization, which determine<br />
droplet sizes either from direct visual observations or from measurements per<strong>for</strong>med on withdrawn samples<br />
[2]. These methods are limited by the fact that they provide in<strong>for</strong>mation of droplet sizes only from places<br />
where there is either visual access or a sampling mechanism can be inserted. Sampling can alter the emulsion<br />
characteristics by exerting <strong>for</strong>ces that can disturb seriously the phases distribution. Additionally, the often<br />
required significant dilution of samples be<strong>for</strong>e measurement can modify some of the emulsion characteristics<br />
(e.g. destroy flocks or aggregates). Moreover, these methods cannot provide in<strong>for</strong>mation on local phase<br />
concentrations. Differential scanning calorimetry is an interesting method <strong>for</strong> characterizing the morphology<br />
of <strong>emulsions</strong> <strong>and</strong> also <strong>for</strong> providing an estimation of droplet sizes. Although, the method is non-intrusive, the<br />
emulsion need be transferred to the sample cell unit of a calorimeter where, in addition, there is no possibility<br />
to determine volume fraction distributions during the destabilization of the emulsion.
With regard to simplicity <strong>and</strong> fast response, electrical measurements offer a tempting alternative <strong>for</strong><br />
determining the longitudinal liquid content profile in draining <strong>foams</strong>. This is implemented by placing several<br />
small electrodes along the vertical direction of the foam <strong>and</strong> scanning them at a rate faster than the time scale<br />
of drainage (usually a scan through all electrodes in less than a second is enough). Another important<br />
advantage is the possibility of using non-intrusive electrodes that can be attached to the wall of test vessels of<br />
virtually any size. <strong>Electrical</strong> techniques appear also to be a tempting option <strong>for</strong> measuring non-intrusively the<br />
temporal evolution of local volume fractions inside <strong>emulsions</strong> (opaque or transparent). Such techniques have<br />
been used in the past <strong>for</strong> <strong>monitoring</strong> other applications such as mixing, bubble columns, multiphase flows,<br />
solid-liquid filtration, <strong>and</strong> polymerization reactors. In those studies different electrode geometries <strong>and</strong><br />
possibilities to arrange/configure electrodes have been employed. A pair of ring electrodes running the<br />
internal circumference of a vessel <strong>and</strong> separated by a certain distance in the axial direction constitutes a probe<br />
which, apart from being non-intrusive, is particularly sensitive to phase distribution patterns in the cylindrical<br />
segment between the ring electrodes. Ring electrodes have been successfully applied to a number of multi<br />
phase applications e.g. [3]. It has been reported that in cases of radially homogeneous dispersions the<br />
separation distance between electrodes can be significantly reduced in favor of more localized (axially)<br />
measurements.<br />
MATERIALS & METHODS<br />
Soya protein isolate (SPI, PRO FAM® 974)) purchased from VIOTREK is used as the foaming agent<br />
without any further purification. The isoelectric point of protein is 5. Xanthan gum (XG) purchased from<br />
SIGMA is used to increase the viscosity of the liquid phase since most high molecular weight<br />
polysaccharides are hydrophilic <strong>and</strong> so do not have a high tendency to adsorb at the air water interface.<br />
Solutions of SPI are prepared in de-ionized water at 1% (w/v) by gentle stirring <strong>for</strong> one hour. The insoluble<br />
SPI fraction (~50%) is removed by centrifugation at 10000 rpm <strong>for</strong> 15 min (ROTINA 35, HETTICH) <strong>and</strong> the<br />
supernatant is refrigerated <strong>for</strong> 24 hours at 4 o C. The soluble fraction is used to prepare the<br />
protein/polysaccharide mixed solution by gradually adding 0.1% (w/v) xanthan gum <strong>and</strong> further gentle<br />
stirring <strong>for</strong> another hour. The resulting liquid serum has viscosity 12 cp (Covette DV-II Viscometer,<br />
Brookfield), natural pH 6.9 (MP 220,Mettler Toledo), electrical specific conductivity 0.52 mS/cm (ECM, Dr.<br />
Lange) <strong>and</strong> equilibrium surface tension 44.5 mN/m (ring method, Sigma 70, KSV); all properties measured at<br />
25 o C. This serum is then left in the fridge at 4 o C <strong>for</strong> additional 24 hours. Foams are prepared by whipping air<br />
into 300 ml of the above solution using a Sunbeam Mixmaster mixer <strong>for</strong> 10 min at 900 rpm. Part of the<br />
produced foam is then decanted to fill a Plexiglas test tube up to its top <strong>and</strong> is allowed to drain. The Plexiglas<br />
test tube has 70 mm internal diameter <strong>and</strong> 170 mm height. The conductance gauge consists of six parallel<br />
stainless-steel rings that are placed at various heights along the tube, flush with its inner surface (Figure 1a).<br />
The electrodes are 2 mm wide. The electrodes of the gauge are combined in pairs to give several conductance<br />
probes. The separation distances of the probes are: probe 1, 5mm; probe 2, 15mm; probe 3, 10mm; probe 4,<br />
30mm. Assuming a radially uni<strong>for</strong>m foam at all times during drainage, the separation distance between<br />
electrodes (dictating the measuring volume also in the radial direction) is not a matter of concern <strong>and</strong> the<br />
selection of pairs is solely based on their relative position along the foam height. Thus, <strong>for</strong> obtaining data at<br />
different heights the four electrode pairs (probes) shown in Figure 1a are selected. Apart from the ring<br />
electrodes, a pair of disc-like <strong>and</strong> a pair of rod-like electrodes are manufactured, each one having the same<br />
active (<strong>for</strong> electrical flow) surface area with a ring electrode. Each disc electrode has available <strong>for</strong> electrical<br />
current flow only its front plane surface whereas each rod electrode only its side cylindrical surface. For all<br />
pairs, the electrodes separation distance is large enough to average bubble size undulations yet small enough<br />
to preserve the local character of measurements.<br />
The oil-in-water <strong>emulsions</strong> were prepared using a NaCl aqueous solution, n-hexane <strong>and</strong> C10E5 as emulsifier.<br />
The aqueous solution was prepared by dissolving NaCl at a concentration of 50mg/L into Millipore filtered<br />
water. After salt dissolution the electrical conductivity of the aqueous solution was 125 μS/cm, a value<br />
typical of tap water. Hexane was spectroscopy grade (purity ≥ 98.5%, Uvasol, Merck). Three different oil-towater<br />
volume ratios: 40/60, 20/80, 5/95 were used <strong>for</strong> making <strong>emulsions</strong>. The emulsifier, C10E5 (Nikko<br />
Chemicals Ltd), was initially dissolved in water but once in contact with hexane during emulsification it<br />
started dissolving into hexane <strong>and</strong> partitioned between the two phases. The partition coefficient of C10E5<br />
between water <strong>and</strong> hexane is K p =13.9. To achieve the same final C10E5 concentration when increasing the<br />
hexane/water volume ratio, higher initial surfactant concentrations in water have been employed. The final<br />
concentrations of C10E5 after partitioning are C f =10 -4 , 2⋅10 -4 , 5⋅10 -4 , 10 -3 M, respectively. With only<br />
exception the case 5/95 hexane-in-water <strong>and</strong> final concentration C f = 10 -4 M, all other cases have initial<br />
surfactant concentrations, C i , above the critical micellization concentration (CMC). Emulsification was
conducted inside a cylindrical Plexiglas vessel having 19.5 cm height <strong>and</strong> 7 cm internal diameter. The vessel<br />
was furnished with sixteen stainless steel ring electrodes flush mounted to the inner wall, 1.5 cm apart from<br />
each other. Electrodes combined in pairs provide several non-intrusive conductance probes. <strong>Electrical</strong> signals<br />
from multiple probes combined with a multiplexer <strong>and</strong> a suitable inverse reconstruction algorithm <strong>for</strong> data<br />
reduction constitute a tomographic imaging system. As this was an attempt to employ tomographic<br />
measurements to emulsification, tests were initially conducted with signals taken from all possible views of<br />
the sensing electrodes. Due to the intense mixing during emulsification virtually no angular or radial<br />
variations of volume fractions were found but only variations in the axial direction. To ease the<br />
computational ef<strong>for</strong>t <strong>and</strong> increase data acquisition rate, only three probes at different axial locations along the<br />
vessel were eventually employed, designated <strong>for</strong> convenience as high, middle <strong>and</strong> low (Figure 1b). These<br />
probes consisted of adjacent electrodes which offered certain advantages: the 1.5 cm separation distance<br />
between rings was large enough to average droplet size undulations yet small enough to prevent the local<br />
character of measurements. All probes were located at the lower half of the emulsion, 1, 4 <strong>and</strong> 7 cm,<br />
respectively, from the bottom of the vessel (distances calculated from the center of probes). The free surface<br />
of the emulsion was 16 cm above the bottom of the vessel (total liquid volume 616 ml). Emulsification was<br />
implemented by intense mixing of water <strong>and</strong> oil using an impeller (Rushton turbine, d=4.6 cm) placed at the<br />
central axis of the vessel. The impeller was placed 1.7 cm above the bottom of the vessel.<br />
(a)<br />
(b)<br />
Figure 1. (a) Experimental test tube with flush mounted ring electrodes <strong>for</strong> foam stability experiments. (b) Schematic<br />
representation of the employed experimental set-up <strong>for</strong> emulsion stability experiments<br />
RESULTS & DISCUSSION<br />
Although our <strong>foams</strong> continue to drain <strong>for</strong> several hours we have decided <strong>for</strong> practical reasons to present here<br />
results only <strong>for</strong> the first hour after their <strong>for</strong>mation. Volumetric measurements in our initially uni<strong>for</strong>m <strong>and</strong><br />
homogeneous foam yield an independent check of electrical data reduction to liquid fraction values. The<br />
volumetrically determined initial liquid fraction is 0.25. Figure 2a presents data obtained from the four<br />
measuring probes along the foam column. Global volumetric measurements are also presented <strong>for</strong><br />
comparison. The four probes give qualitatively similar results [4,5]. However, both the time <strong>for</strong> drainage<br />
onset (moment when curves start to decline) <strong>and</strong> the liquid fraction variation with time show a monotonous<br />
trend among probes: The lower a probe is located in the foam the later the drainage starts <strong>and</strong> the slower the<br />
drainage rate. This is normal <strong>and</strong> is due to hydrostatic effects in the foam.<br />
Interestingly, a slight gradual rise of the electrical signal is observed from time zero until the moment<br />
(different <strong>for</strong> each probe) that the liquid starts to leak out of the measuring volume. This rise corresponds to a<br />
liquid fraction increase of about 0.01. This is just a small difference which in terms of accuracy is out of the<br />
capacity of determination but in terms of resolution it can be safely sensed. Inasmuch as capillary hold-up<br />
effects are restricted to low heights (the capillary length at our bottom foam-liquid interface is estimated<br />
around 1 cm) they can not be blamed <strong>for</strong> the liquid fraction rise with time. Such signal rise could be<br />
explained by a slight temperature increase during the experiment but our temperature recordings at the wall
do not confirm this. Nor the ionic strength of the solution has changed with time as conductivity<br />
measurements show. Another possible explanation is a bubble size effect (through tortuosity) as bubbles get<br />
larger with time. Datye <strong>and</strong> Lemlich [6] observed a similar small bubble size effect on the conductivity of<br />
dry <strong>foams</strong>. Although qualitatively correct, this remains to be seen from the analysis of the close-up photos.<br />
To our knowledge, this is the first time that such a feature is reported regarding electrical signals in <strong>foams</strong>.<br />
The role of the electrode geometry <strong>and</strong> intrusiveness is examined next. Figures 2b shows the electrical <strong>and</strong><br />
volumetric measurements, respectively, obtained by employing ring, rod <strong>and</strong> disc electrodes simultaneously.<br />
For comparison, the data obtained when using just the ring electrodes are shown. Beside their different shape,<br />
rod <strong>and</strong> disc electrodes have a much longer vertical surface exposed to the foam compared to the narrow (2<br />
mm) ring electrodes <strong>and</strong> one may have concerns whether this may enhance drainage. It must be also stressed<br />
that rod <strong>and</strong> disc electrodes are immersion electrodes while ring electrodes are flush mounted at the wall of<br />
the container.<br />
Figure 3 present electrical measurements of local water volume fraction obtained by the three probes (high,<br />
middle, low) during the destabilization process of hexane-in-water <strong>emulsions</strong> <strong>for</strong> a particular C10E5<br />
concentrations <strong>for</strong> 40/60 (v/v) <strong>emulsions</strong>. The mentioned v/v proportion refers to the end of hexane addition.<br />
<strong>Electrical</strong> signals from all runs exhibit similar features. Time t=0 is the moment that the impeller is switchedoff<br />
which corresponds to a well-mixed homogeneous emulsion along the test vessel [7]. This means that<br />
signals from the three probes start from the same initial water volume fraction which <strong>for</strong> the three examined<br />
oil/water proportions is 0.95, 0.80 or 0.60, respectively. At long times, electrical curves of water fraction tend<br />
to unity which corresponds to presence of water alone. This is because all three probes are located at the<br />
lower half of the emulsion volume so at the end of phase separation electrodes are covered only by water. In<br />
all curves, a fast rise is observed at the beginning which progressively turns into a slower rise at longer times.<br />
The initial fast rise corresponds to large oil droplets that separate rapidly from the aqueous phase whereas the<br />
slow rise corresponds to small droplets that take longer to destabilize.<br />
A direct approach to extract problem parameters from experimental data is developed in [8]. The shape of the<br />
evolving water volume fraction curve <strong>for</strong> the low measuring probe (Fig. 3) implies a bidisperse size<br />
distribution of droplets. The term bidisperse literally refers to a population with two discrete sizes.<br />
Nevertheless, in practice, it is a good approximation <strong>for</strong> any bimodal distribution with no very broad modes<br />
<strong>and</strong> with limited overlapping between modes. This is apparently the case here since the distinct character of<br />
the two modes is clear in the experimental conductance curves (see below). The development procedure to<br />
estimate droplet sizes <strong>and</strong> relative volume fractions from the experimental data of the low probe is briefly<br />
described. The first step is to find the slopes of the two linear regions of the volume fraction evolution curve<br />
<strong>and</strong> the corresponding transition point φ c between the two regions (see Figure 4). The slopes are related to<br />
front (separation line between regions of different oil volume fraction) velocities through a theory <strong>for</strong> the<br />
relation between nonuni<strong>for</strong>m oil volume fraction <strong>and</strong> liquid conductance. Next, the velocity is related to<br />
bubble buoyancy velocity <strong>and</strong> final to bubble size (through the use of the appropriate drag law).<br />
Following the mentioned procedure one can derive the average diameter of large <strong>and</strong> small bubbles d L <strong>and</strong> d s<br />
<strong>and</strong> the corresponding oil volume fractions φ L <strong>and</strong> φ s , respectively. The results of the analysis are shown in<br />
Table 1. The two droplet size modes appear to have very different values which is compatible with the way<br />
of producing the <strong>emulsions</strong> in the present work. The oil is introduced from a capillary to an intensively<br />
stirred tank. The initial large droplets leaving the capillary undergo turbulent breakage (the existence of<br />
surfactant prevents coalescence both in the emulsification <strong>and</strong> the destabilization stage). It is well known that<br />
in case of intensive turbulence breakage occurs by dripping tiny droplets from the surface of mother droplets<br />
[9]. This type of breakage leads to a bimodal distribution. The large mode corresponds to the continuously<br />
decreasing size of the initial droplets <strong>and</strong> the small mode to the fragments. The above mechanism is imposed<br />
by surface energy <strong>and</strong> capillary pressure criteria [9]. Further to the expected bimodal shape, it is evident from<br />
Table 1 that the size of the large mode decreases as the surfactant concentration increases. This is explained<br />
by the fact that the reduction of surface energy leads to higher breakage rate <strong>and</strong> thus to larger breakage<br />
extent. Finally, the higher large mode size <strong>for</strong> larger oil volume fraction probably is due to the well-known<br />
damping of turbulence by the presence of the dispersed phase. For very high breakage extent the breakage<br />
mechanism changes from dripping to equal size breakage leading to the merging of the two modes to one.<br />
This seems to be the case <strong>for</strong> the 20/80 v/v mixture with 10 -3 surfactant concentration in which the second<br />
mode vanishes. It is noted that the average diameter resulted from the processing of microscope images is<br />
also shown in Table 1. The deviation between the diameters d L ,d s from the electrical technique <strong>and</strong> the D opt<br />
can be explained based on the different physical principles of the measuring techniques.
0.28<br />
0.28<br />
0.28<br />
0.28<br />
0.26<br />
0.26<br />
0.26<br />
0.26<br />
liquid fraction<br />
0.24<br />
1 0.24<br />
2<br />
0.22<br />
0.22<br />
3<br />
0.2 1,2,3,4 electrical probes<br />
0.2<br />
volumetrically<br />
4<br />
0.18<br />
0.18<br />
0 10 20 30 40 50 60<br />
t, min<br />
local liquid fraction<br />
0.24<br />
0.22<br />
0.2<br />
ring electrodes<br />
disc electrodes<br />
rod electrodes<br />
0.24<br />
0.22<br />
0.2<br />
ring electrodes only<br />
(a)<br />
0.18<br />
0.18<br />
0 10 20 30 40 50 60<br />
t, min<br />
simultaneous use<br />
(a)<br />
(b)<br />
Figure 2. Local electrical conductance measurements: (a) evolution of liquid fraction with time at different heights<br />
(probes) (b) Comparison between ring, disk <strong>and</strong> rod electrodes<br />
1<br />
c)<br />
0.95<br />
0.9<br />
0.85<br />
φw, -<br />
0.8<br />
0.75<br />
0.7<br />
0.65<br />
0.6<br />
0.55<br />
high<br />
middle<br />
low<br />
0 1000 2000 3000 4000 5000 6000 7000 8000<br />
t,s<br />
Figure 3. Water fraction (φ w ) as a function of time (t) during destabilization of a hexane-in-water emulsion at a<br />
40/60(v/v) (final proportion) oil/water volume ratio at three positions (C f =5·10 -4 M is the concentration of surfactant<br />
after partitioning between the two phases)<br />
1.01<br />
1<br />
0.99<br />
0.98<br />
φ w<br />
, -<br />
0.97<br />
0.96<br />
0.95<br />
φ c = 0.986<br />
0.94<br />
0 1000 2000 3000 4000 5000 6000 7000 8000<br />
t,s<br />
Figure 4. The procedure followed in order to calculate the two slopes <strong>and</strong> the transition point φ c .
Table 2. Results from the theoretical analysis of electrical data from the lower electrode ring based on the assumption of<br />
a bidisperse droplet size distribution: bubble diameters d L <strong>and</strong> d s with oil volume fractions φ L <strong>and</strong> φ s respectively. D opt is<br />
the number average diameter from the optical measurements.<br />
Concentration of Hexane φ L<br />
d L<br />
φ s<br />
d s D opt (μm)<br />
C 10 E 5 (M) %(v/v)<br />
(μm)<br />
(μm)<br />
1·10 -4 5 0.042 88.3 0.008 10 17.74<br />
2·10 -4 5 0.034 74.8 0.016 9.62 30.58<br />
5·10 -4 5 0.036 39.2 0.014 9.56 22.86<br />
1·10 -3 5 0.033 21.8 0.017 8.3 15.78<br />
1·10 -4 20 0.155 126 0.045 10.7 8.6<br />
2·10 -4 20 0.14 123 0.06 15 13.64<br />
5·10 -4 20 0.147 85.2 0.053 9.38 25.93<br />
1·10 -3 20 0.2 27 0 - 27.68<br />
CONCLUSION<br />
In the present work, the capabilities of the electric <strong>resistance</strong> <strong>tomography</strong> technique based on flush mounted<br />
cylindrical electrode probes, as a tool <strong>for</strong> studying the stability of <strong>foams</strong> <strong>and</strong> <strong>emulsions</strong>, are demonstrated.<br />
The particular electrode design has the advantage of no interference with the destabilizing process which is<br />
the case <strong>for</strong> immersed electrodes. The use of multiple sensing probes provided accurate measurements of<br />
local water fractions at different heights along the test vessel both <strong>for</strong> <strong>foams</strong> <strong>and</strong> <strong>emulsions</strong> <strong>and</strong> allows<br />
detailed registration of the destabilization process. In case of <strong>emulsions</strong>, using the appropriate theoretical<br />
treatment, the conductance curves obtained from the electrode probe can be used to estimate the two<br />
characteristic droplet sizes of an assumed bimodal distribution.<br />
REFERENCES<br />
[1] Bikerman J.J. 1973 Foams, Chapter 6, Springer, London.<br />
[2] Sjoblom J. 1996 Emulsions <strong>and</strong> Emulsions stability, Vol 61, Marcel Dekker, New York.<br />
[3] Tsochatzidis N., Karapantsios T.D., Kostoglou M. & Karabelas A.J. 1992 A conductance probe <strong>for</strong> measuring liquid<br />
fraction in pipes <strong>and</strong> packed beds, Int. J. Multiphase Flow, 18, 653-667.<br />
[4] Karapantsios T.D. & Papara M. 2008 On the design of electrical conductance probes <strong>for</strong> foam drainage applications -<br />
Assessment of ring electrodes per<strong>for</strong>mance <strong>and</strong> bubble size effects on measurements, Colloids <strong>and</strong> Surfaces A, 323,<br />
139-148.<br />
[5] Papara M., Zabulis X. & Karapantsios T.D. 2009 Container effects on the free drainage of wet <strong>foams</strong>, Chemical<br />
Engineering Science, 64, 1404-1415.<br />
[6] Datye A.K. & Lemlich R. 1983 Liquid distribution <strong>and</strong> electrical conductivity in foam, Int. J. Multiphase Flow, 9, 627<br />
– 636.<br />
[7] Kalogianni E.P., Varka E.M., Karapantsios T.D., Kostoglou M., Santini E., Liggieri L. & Ravera F. 2010 A multiprobe<br />
non-intrusive electrical technique <strong>for</strong> <strong>monitoring</strong> emulsification of hexane-in-water with the emulsifier C10E5<br />
soluble in both phases, Colloids <strong>and</strong> Surfaces A, 354, 353-363.<br />
[8] Kostoglou M, Varka E.M, Kalogianni E.P. & Karapantsios, T.D. 2010 Evolution of volume fractions <strong>and</strong> droplet<br />
sizes by analysis of electrical conductance curves during destabilization of oil-in-water <strong>emulsions</strong>, Journal of Colloid<br />
<strong>and</strong> Interface Science, 349, 408-416.<br />
[9] Kostoglou M. & Karabelas A.J. 2005 Towards a unified framework <strong>for</strong> the derivation of breakage functions based on<br />
the statistical theory of turbulence, Chemical Engineering Science, 60, 6584-6595.