The Implementation of Integrated Management of Childhood Illness ...
The Implementation of Integrated Management of Childhood Illness ...
The Implementation of Integrated Management of Childhood Illness ...

You also want an ePaper? Increase the reach of your titles
YUMPU automatically turns print PDFs into web optimized ePapers that Google loves.
Pro<br />
ii.<br />
Pneumonia<br />
In total, about 7% <strong>of</strong> the children were classified with pneumonia and the highest<br />
number was classified in the 1-4 years age group (Table 4-6). However, the 2-11<br />
month group received proportionately most <strong>of</strong> the pneumonia classifications, as<br />
attendees aged aged 2-11 months were roughly half as many as attendees aged 1-4<br />
months (Table 4-4). In Nankhwali, almost 2/5 <strong>of</strong> all pneumonia classifications fell<br />
within the 2-11 month age group.<br />
<strong>The</strong> proportion <strong>of</strong> children who were classified with pneumonia varied from 1%<br />
in Nkope to 22% in Nankhwali. In Nankhwali, where pneumonia classifications<br />
were more common than other respiratory infections (Figure 4-4), 10 out <strong>of</strong> the 15<br />
children less than two months were given a pneumonia classification.<br />
Table 4-6: Number <strong>of</strong> pneumonia cases and proportion <strong>of</strong> total children in each age group<br />
classified with pneumonia by facility. (g) Government run, (c) CHAM-run.<br />
HC<br />
Total < 2 months 2-11 months 1-4 years 5-14 years 0-14 years<br />
children n (%) n (%) n (%) n (%) n (%)<br />
MBCH (g) 1569 5 (0,3) 49 (3) 65 (4) 48 (3) 167 (11)<br />
Nankumba (g) 1119 0 (0) 11 (1) 13 (1) 6 (1) 30 (3)<br />
Malembo (c) 466 0 (0) 13 (3) 12 (3) 3 (1) 28 (6)<br />
Nankhwali (c ) 243 10 (4) 20 (8) 12 (5) 11 (5) 53 (22)<br />
Nkope (c) 668 2 (0,3) 3 (0,4) 3 (0,4) 1 (0,1) 9 (1)<br />
Grand Total 4065 17 (0,4) 96 (2) 105 (3) 69 (2) 287 (7)<br />
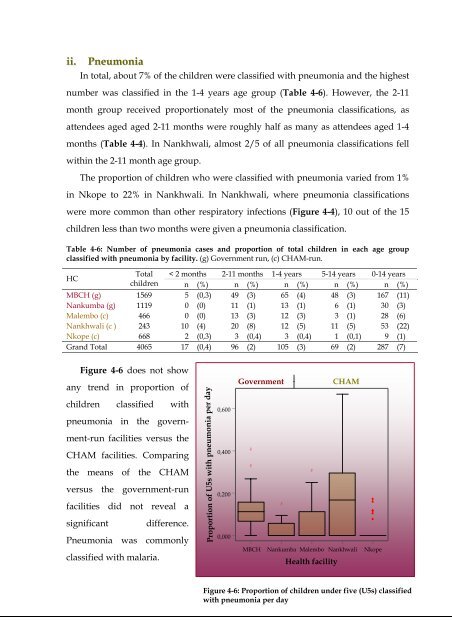
Figure 4-6 does not show<br />
any trend in proportion <strong>of</strong><br />
Government<br />
|<br />
CHAM<br />
tion <strong>of</strong> U5s with pneumonia p ay<br />
por er d<br />
children classified with<br />
pneumonia in the govern-<br />
0,600<br />
ment-run facilities versus the<br />
CHAM facilities. Comparing<br />
0,400<br />
<br />
the means <strong>of</strong> the CHAM<br />
<br />
<br />
versus the government-run<br />
facilities did not reveal a<br />
significant difference.<br />
0,200<br />
<br />
<br />
<br />
<br />
Pneumonia was commonly<br />
classified with malaria.<br />
0,000<br />
MBCH Nankumba Malembo Nankhwali Nkope<br />
Health facility<br />
Figure 4-6: Proportion <strong>of</strong> children under five (U5s) classified<br />
with pneumonia per day<br />
35