Density of lean meat tissue in pork - measured by CT - ICoMST ...
Density of lean meat tissue in pork - measured by CT - ICoMST ...
Density of lean meat tissue in pork - measured by CT - ICoMST ...

You also want an ePaper? Increase the reach of your titles
YUMPU automatically turns print PDFs into web optimized ePapers that Google loves.
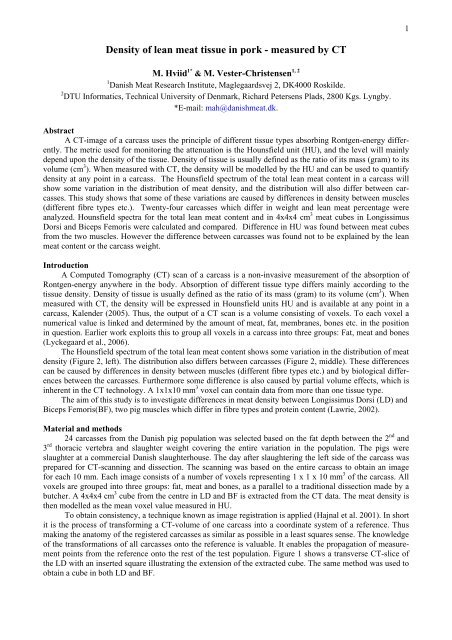
1<br />
<strong>Density</strong> <strong>of</strong> <strong>lean</strong> <strong>meat</strong> <strong>tissue</strong> <strong>in</strong> <strong>pork</strong> - <strong>measured</strong> <strong>by</strong> <strong>CT</strong><br />
M. Hviid 1* & M. Vester-Christensen 1, 2<br />
1 Danish Meat Research Institute, Maglegaardsvej 2, DK4000 Roskilde.<br />
2 DTU Informatics, Technical University <strong>of</strong> Denmark, Richard Petersens Plads, 2800 Kgs. Lyng<strong>by</strong>.<br />
*E-mail: mah@danish<strong>meat</strong>.dk.<br />
Abstract<br />
A <strong>CT</strong>-image <strong>of</strong> a carcass uses the pr<strong>in</strong>ciple <strong>of</strong> different <strong>tissue</strong> types absorb<strong>in</strong>g Rontgen-energy differently.<br />
The metric used for monitor<strong>in</strong>g the attenuation is the Hounsfield unit (HU), and the level will ma<strong>in</strong>ly<br />
depend upon the density <strong>of</strong> the <strong>tissue</strong>. <strong>Density</strong> <strong>of</strong> <strong>tissue</strong> is usually def<strong>in</strong>ed as the ratio <strong>of</strong> its mass (gram) to its<br />
volume (cm 3 ). When <strong>measured</strong> with <strong>CT</strong>, the density will be modelled <strong>by</strong> the HU and can be used to quantify<br />
density at any po<strong>in</strong>t <strong>in</strong> a carcass. The Hounsfield spectrum <strong>of</strong> the total <strong>lean</strong> <strong>meat</strong> content <strong>in</strong> a carcass will<br />
show some variation <strong>in</strong> the distribution <strong>of</strong> <strong>meat</strong> density, and the distribution will also differ between carcasses.<br />
This study shows that some <strong>of</strong> these variations are caused <strong>by</strong> differences <strong>in</strong> density between muscles<br />
(different fibre types etc.). Twenty-four carcasses which differ <strong>in</strong> weight and <strong>lean</strong> <strong>meat</strong> percentage were<br />
analyzed. Hounsfield spectra for the total <strong>lean</strong> <strong>meat</strong> content and <strong>in</strong> 4x4x4 cm 3 <strong>meat</strong> cubes <strong>in</strong> Longissimus<br />
Dorsi and Biceps Femoris were calculated and compared. Difference <strong>in</strong> HU was found between <strong>meat</strong> cubes<br />
from the two muscles. However the difference between carcasses was found not to be expla<strong>in</strong>ed <strong>by</strong> the <strong>lean</strong><br />
<strong>meat</strong> content or the carcass weight.<br />
Introduction<br />
A Computed Tomography (<strong>CT</strong>) scan <strong>of</strong> a carcass is a non-<strong>in</strong>vasive measurement <strong>of</strong> the absorption <strong>of</strong><br />
Rontgen-energy anywhere <strong>in</strong> the body. Absorption <strong>of</strong> different <strong>tissue</strong> type differs ma<strong>in</strong>ly accord<strong>in</strong>g to the<br />
<strong>tissue</strong> density. <strong>Density</strong> <strong>of</strong> <strong>tissue</strong> is usually def<strong>in</strong>ed as the ratio <strong>of</strong> its mass (gram) to its volume (cm 3 ). When<br />
<strong>measured</strong> with <strong>CT</strong>, the density will be expressed <strong>in</strong> Hounsfield units HU and is available at any po<strong>in</strong>t <strong>in</strong> a<br />
carcass, Kalender (2005). Thus, the output <strong>of</strong> a <strong>CT</strong> scan is a volume consist<strong>in</strong>g <strong>of</strong> voxels. To each voxel a<br />
numerical value is l<strong>in</strong>ked and determ<strong>in</strong>ed <strong>by</strong> the amount <strong>of</strong> <strong>meat</strong>, fat, membranes, bones etc. <strong>in</strong> the position<br />
<strong>in</strong> question. Earlier work exploits this to group all voxels <strong>in</strong> a carcass <strong>in</strong>to three groups: Fat, <strong>meat</strong> and bones<br />
(Lyckegaard et al., 2006).<br />
The Hounsfield spectrum <strong>of</strong> the total <strong>lean</strong> <strong>meat</strong> content shows some variation <strong>in</strong> the distribution <strong>of</strong> <strong>meat</strong><br />
density (Figure 2, left). The distribution also differs between carcasses (Figure 2, middle). These differences<br />
can be caused <strong>by</strong> differences <strong>in</strong> density between muscles (different fibre types etc.) and <strong>by</strong> biological differences<br />
between the carcasses. Furthermore some difference is also caused <strong>by</strong> partial volume effects, which is<br />
<strong>in</strong>herent <strong>in</strong> the <strong>CT</strong> technology. A 1x1x10 mm 3 voxel can conta<strong>in</strong> data from more than one <strong>tissue</strong> type.<br />
The aim <strong>of</strong> this study is to <strong>in</strong>vestigate differences <strong>in</strong> <strong>meat</strong> density between Longissimus Dorsi (LD) and<br />
Biceps Femoris(BF), two pig muscles which differ <strong>in</strong> fibre types and prote<strong>in</strong> content (Lawrie, 2002).<br />
Material and methods<br />
24 carcasses from the Danish pig population was selected based on the fat depth between the 2 nd and<br />
3 rd thoracic vertebra and slaughter weight cover<strong>in</strong>g the entire variation <strong>in</strong> the population. The pigs were<br />
slaughter at a commercial Danish slaughterhouse. The day after slaughter<strong>in</strong>g the left side <strong>of</strong> the carcass was<br />
prepared for <strong>CT</strong>-scann<strong>in</strong>g and dissection. The scann<strong>in</strong>g was based on the entire carcass to obta<strong>in</strong> an image<br />
for each 10 mm. Each image consists <strong>of</strong> a number <strong>of</strong> voxels represent<strong>in</strong>g 1 x 1 x 10 mm 3 <strong>of</strong> the carcass. All<br />
voxels are grouped <strong>in</strong>to three groups: fat, <strong>meat</strong> and bones, as a parallel to a traditional dissection made <strong>by</strong> a<br />
butcher. A 4x4x4 cm 3 cube from the centre <strong>in</strong> LD and BF is extracted from the <strong>CT</strong> data. The <strong>meat</strong> density is<br />
then modelled as the mean voxel value <strong>measured</strong> <strong>in</strong> HU.<br />
To obta<strong>in</strong> consistency, a technique known as image registration is applied (Hajnal et al. 2001). In short<br />
it is the process <strong>of</strong> transform<strong>in</strong>g a <strong>CT</strong>-volume <strong>of</strong> one carcass <strong>in</strong>to a coord<strong>in</strong>ate system <strong>of</strong> a reference. Thus<br />
mak<strong>in</strong>g the anatomy <strong>of</strong> the registered carcasses as similar as possible <strong>in</strong> a least squares sense. The knowledge<br />
<strong>of</strong> the transformations <strong>of</strong> all carcasses onto the reference is valuable. It enables the propagation <strong>of</strong> measurement<br />
po<strong>in</strong>ts from the reference onto the rest <strong>of</strong> the test population. Figure 1 shows a transverse <strong>CT</strong>-slice <strong>of</strong><br />
the LD with an <strong>in</strong>serted square illustrat<strong>in</strong>g the extension <strong>of</strong> the extracted cube. The same method was used to<br />
obta<strong>in</strong> a cube <strong>in</strong> both LD and BF.
2<br />
Figure 1.. Slice from the <strong>CT</strong>-volume depict<strong>in</strong>g LD. The <strong>in</strong>serted square illustrates the extension <strong>of</strong> the extracted<br />
cube.<br />
After scann<strong>in</strong>g a traditional total dissection was made on the same carcass side to calculate the <strong>lean</strong><br />
<strong>meat</strong> content. The two muscles Longissimus Dorsi and Biceps Femoris was m<strong>in</strong>ced after dissection. Prote<strong>in</strong><br />
content was analyzed <strong>in</strong> a sample <strong>of</strong> 200 g from each muscle/carcass <strong>by</strong> us<strong>in</strong>g the Kjeltec-Tecator system<br />
(ISO/IEC 17025).<br />
Results and discussions<br />
The mean value and standard deviation for <strong>lean</strong> <strong>meat</strong> content <strong>in</strong> the left side carcass, the total <strong>meat</strong><br />
density, the <strong>meat</strong> density from LD and BF and prote<strong>in</strong> content <strong>in</strong> LD and BF are shown <strong>in</strong> Table 1. A t-test<br />
shows that the densities <strong>in</strong> LD and BF are significantly different, as is the prote<strong>in</strong> content.<br />
Table 1. Mean and std. for the analyzed traits <strong>in</strong> 24 carcasses<br />
Carcass<br />
<strong>lean</strong> <strong>meat</strong><br />
percent<br />
Total<br />
carcass<br />
<strong>meat</strong> HU<br />
LD, Meat<br />
density<br />
HU<br />
BF, Meat<br />
density<br />
HU<br />
LD, Prote<strong>in</strong><br />
percent<br />
BF, Prote<strong>in</strong><br />
Percent<br />
Mean * 63.5 57.5 69.6 a 65.4 a 22.8 b 21.3 b<br />
STD 3.0 1.7 2.1 2.4 0.3 0.3<br />
* Different letter <strong>in</strong>dicate that the mean is significant different at 0.1 % level p
3<br />
Carcass All Carcasses BF+LD estimated distribution<br />
Figure 2. Distribution <strong>of</strong> <strong>meat</strong> density, HU <strong>in</strong> carcass, LD and BF.<br />
Figure 3. Plot <strong>of</strong> <strong>meat</strong> density and prote<strong>in</strong> content <strong>in</strong> LD and BF.<br />
Conclusions<br />
LD and BF has different <strong>meat</strong> density <strong>measured</strong> with <strong>CT</strong>. The different level <strong>of</strong> <strong>meat</strong> density <strong>in</strong> the<br />
two muscles could be expla<strong>in</strong>ed <strong>by</strong> different level <strong>of</strong> prote<strong>in</strong>, but the correlation between <strong>meat</strong> density and<br />
prote<strong>in</strong> content with<strong>in</strong> a muscle was not significant. However as <strong>in</strong>dicated <strong>in</strong> figure 3 there is a clear dist<strong>in</strong>ction<br />
between the two muscles both <strong>in</strong> the <strong>CT</strong> density measurements and <strong>in</strong> prote<strong>in</strong> level.<br />
In summary, some <strong>of</strong> the variation <strong>in</strong> total <strong>meat</strong> density for a carcass is caused <strong>by</strong> difference <strong>in</strong> density<br />
<strong>of</strong> the muscles, and not only because <strong>of</strong> partial volume effects.<br />
Reference<br />
Hajnal, J. V, Hawkes, D.J., Hill D.L.G. Medical Image Registration, CRC Press 2001.<br />
Kalender, W.A. (2005). Computed Tomography, second edition pp. 17-30. Publicis Corporate publ.<br />
Lawrie, R.A., (2002). Lawrie’s Meat Science, sixth edition pp. 58-95. Woodhead publ. Food science and<br />
technology.<br />
Lyckegaard, A., Larsen, R., Christensen, L. B., Vester-Christensen, M., Olsen, E. V. 2006. Contextual<br />
Analysis <strong>of</strong> <strong>CT</strong> Scanned Pig Carcasses. 52nd International Congress <strong>of</strong> Meat Science and Technology.