Measuring our performance - British American Tobacco
Measuring our performance - British American Tobacco
Measuring our performance - British American Tobacco

Create successful ePaper yourself
Turn your PDF publications into a flip-book with our unique Google optimized e-Paper software.
<strong>Measuring</strong> <strong>our</strong> <strong>performance</strong><br />
2008<br />
2009<br />
2010<br />
128.8p +19%<br />
153.0p +19%<br />
175.7p +15%<br />
(annual %)<br />
30<br />
10<br />
-10<br />
-30<br />
-50<br />
-70<br />
5<br />
-10<br />
-25<br />
Upper quartile Lower quartile<br />
(annual %)<br />
20<br />
Upper quartile Lower quartile<br />
<strong>British</strong> <strong>American</strong> <strong>Tobacco</strong> Annual Report 2010<br />
Business review<br />
We have a wide range of measures and indicators by which the Board assesses<br />
<strong>performance</strong> compared to the Group’s strategy. To ensure management’s focus<br />
is aligned with the interests of <strong>our</strong> shareholders, <strong>our</strong> KPIs are reflected in <strong>our</strong><br />
management incentive schemes. Although <strong>our</strong> other business measures are<br />
not directly included in management’s incentives, we believe they improve the<br />
quality of <strong>our</strong> business and contribute to shareholder value, particularly over<br />
the long term.<br />
Shareholder value<br />
Key <strong>performance</strong> indicators (KPIs)<br />
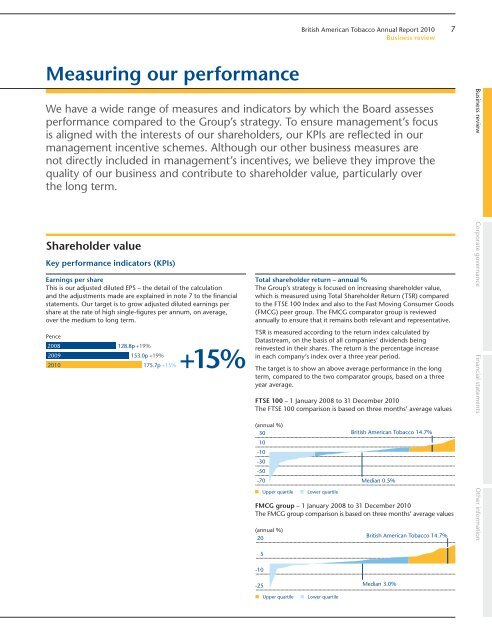
Earnings per share<br />
This is <strong>our</strong> adjusted diluted EPS – the detail of the calculation<br />
and the adjustments made are explained in note 7 to the financial<br />
statements. Our target is to grow adjusted diluted earnings per<br />
share at the rate of high single-figures per annum, on average,<br />
over the medium to long term.<br />
Pence<br />
+15%<br />
Total shareholder return – annual %<br />
The Group’s strategy is focused on increasing shareholder value,<br />
which is measured using Total Shareholder Return (TSR) compared<br />
to the FTSE 100 Index and also to the Fast Moving Consumer Goods<br />
(FMCG) peer group. The FMCG comparator group is reviewed<br />
annually to ensure that it remains both relevant and representative.<br />
TSR is measured according to the return index calculated by<br />
Datastream, on the basis of all companies’ dividends being<br />
reinvested in their shares. The return is the percentage increase<br />
in each company’s index over a three year period.<br />
The target is to show an above average <strong>performance</strong> in the long<br />
term, compared to the two comparator groups, based on a three<br />
year average.<br />
FTSE 100 – 1 January 2008 to 31 December 2010<br />
The FTSE 100 comparison is based on three months’ average values<br />
<strong>British</strong> <strong>American</strong> <strong>Tobacco</strong> 14.7%<br />
Median 0.5%<br />
FMCG group – 1 January 2008 to 31 December 2010<br />
The FMCG group comparison is based on three months’ average values<br />
<strong>British</strong> <strong>American</strong> <strong>Tobacco</strong> 14.7%<br />
Median 3.0%<br />
7<br />
Business review Corporate governance Financial statements Other information
8 <strong>British</strong> <strong>American</strong> <strong>Tobacco</strong> Annual Report 2010<br />
Business review<br />
<strong>Measuring</strong> <strong>our</strong> <strong>performance</strong> (continued)<br />
Growth<br />
Key <strong>performance</strong> indicators (KPIs)<br />
Revenue growth<br />
This figure is calculated as the revenue of the Group after the<br />
deduction of any duties, excise and other taxes, as published<br />
in the Group income statement.<br />
Our target is to grow revenue, on average over the medium<br />
to long term, by 3-4 per cent per annum.<br />
£ million %<br />
2008<br />
2009<br />
2010<br />
Billion<br />
2008<br />
2009<br />
2010<br />
%<br />
2009<br />
2010<br />
12,122 +21%<br />
14,208 +17%<br />
14,883 +5%<br />
187 +16%<br />
195 +4%<br />
208 +7%<br />
25.0<br />
25.3<br />
+5%<br />
Global Drive Brand (GDB) volume<br />
GDB volumes are calculated as the total volumes of the f<strong>our</strong> brands<br />
– Dunhill, Kent, Lucky Strike and Pall Mall – sold by <strong>our</strong> subsidiaries.<br />
Our target is to achieve high single-figure growth, on average, over<br />
the long term.<br />
+7%<br />
Group’s share of key subsidiary markets<br />
This is <strong>our</strong> retail market share in the Group’s Top 40 markets<br />
which covers around 80 per cent of the volumes of subsidiaries.<br />
The information used in this calculation is based on publicly<br />
available information and internal company analysis.<br />
Our target is to continue to grow market share.<br />
Business measures<br />
Share growth in key segments<br />
This is <strong>our</strong> overall share of volume in the Group’s Top 40 markets<br />
in three key segments: Adult Smokers Under 30 (ASU30), Premium<br />
and Fresh Taste.<br />
Our target is to maintain or grow <strong>our</strong> share of volume in each<br />
segment each year on an organic basis.<br />
2009<br />
ASU30<br />
2010<br />
2009<br />
Premium<br />
2010<br />
2009<br />
Fresh Taste<br />
2010<br />
2009<br />
ASU30<br />
2010<br />
2009<br />
Premium<br />
2010<br />
2009 29<br />
Fresh Taste<br />
2010 30<br />
25.2<br />
26.1<br />
26.5<br />
26.7<br />
25.9<br />
26.9<br />
Strategic segment volume<br />
This is <strong>our</strong> total volume sales in the Group’s Top 40 markets in three<br />
key segments: Adult Smokers Under 30 (ASU30), Premium and<br />
Fresh Taste.<br />
Our target is to maintain or grow total volume in each segment each<br />
year on an organic basis.<br />
Billion<br />
183<br />
179<br />
182<br />
177<br />
Our key strategic segments no longer include the Lights segment.<br />
Our Menthol segment has been renamed Fresh Taste and now includes<br />
Menthol and Mint, although this does not affect the reported share<br />
and volume figures for the segment and the comparisons with 2009.
Productivity<br />
Key <strong>performance</strong> indicators (KPIs)<br />
Adjusted profit from operations<br />
Profit used in this assessment is the adjusted profit from operations<br />
of the Group’s subsidiaries – adjusted for the items shown as<br />
memorandum information on the Group income statement.<br />
The Group’s target is to grow adjusted profit from operations on<br />
average by 6 per cent per annum.<br />
£ million %<br />
2008<br />
2009<br />
2010<br />
3,717 +24%<br />
4,461 +20%<br />
4,984 +12%<br />
Overheads and productivity savings<br />
Overheads are calculated as the total costs of all subsidiaries,<br />
less variable costs and less all marketing investment.<br />
Productivity savings are the savings in supply chain, overheads<br />
and indirect costs (anything other than leaf, wrapping materials,<br />
cigarette-making machinery and lab<strong>our</strong>).<br />
A specific target is set each year to contribute to the £800 million<br />
savings target set for 2012. The £800 million target was reached<br />
in 2010, two years ahead of plan.<br />
Cash flow – free cash flow<br />
Free cash flow is defined as net cash from operating activities<br />
(including dividends from associates, restructuring costs and<br />
taxation) less net interest, net capital expenditure and dividends<br />
to minorities.<br />
A specific target is set each year for free cash flow. The target for<br />
2010 was exceeded.<br />
£ million<br />
2008<br />
2009<br />
2010<br />
2,604 +52%<br />
2,630 +1%<br />
3,240 +23%<br />
+12%<br />
+23%<br />
Business measures<br />
2008<br />
2009<br />
2010<br />
2008<br />
2009<br />
2010<br />
<strong>British</strong> <strong>American</strong> <strong>Tobacco</strong> Annual Report 2010<br />
Business review<br />
Operating margin<br />
This is the percentage of adjusted profit from operations divided<br />
by revenue.<br />
Our target is to increase operating margin to at least 35 per cent<br />
by 2012.<br />
86<br />
30.7<br />
31.4<br />
92<br />
33.5<br />
Free cash flow as a percentage of adjusted earnings<br />
This measures <strong>our</strong> free cash flow as a ratio of the adjusted<br />
diluted earnings.<br />
Our target is to maintain the percentage figure in the mid-80s.<br />
%<br />
101<br />
9<br />
Business review Corporate governance Financial statements Other information
10 <strong>British</strong> <strong>American</strong> <strong>Tobacco</strong> Annual Report 2010<br />
Business review<br />
<strong>Measuring</strong> <strong>our</strong> <strong>performance</strong> (continued)<br />
Winning organisation<br />
Business measures<br />
‘Y<strong>our</strong> Voice’ employee opinion survey<br />
We collect views from employees through <strong>our</strong> ‘Y<strong>our</strong> Voice’<br />
survey once every two years to help us measure <strong>our</strong> progress<br />
in employee engagement.<br />
Our target is to achieve more positive scores than the other Fast<br />
Moving Consumer Goods (FMCG) companies in <strong>our</strong> comparator<br />
benchmark group in all areas. In 2010, scores in all categories were<br />
more positive than the FMCG benchmark, and we either maintained<br />
or improved on <strong>our</strong> 2008 score in eight of the 11 categories.<br />
Responsibility*<br />
Business measures<br />
Dow Jones Sustainability Indexes<br />
The Indexes track the economic, environmental and social<br />
<strong>performance</strong> of leading companies based on the integration<br />
of sustainability into their businesses.<br />
Our target is to achieve a higher score than the sector average in a<br />
minimum of 14 out of 18 categories. In 2010, we achieved a higher<br />
score in 17 categories.<br />
Group energy use<br />
This measure tracks Group energy use in gigajoules per million<br />
cigarettes equivalent.<br />
Our target is to reduce energy use by 6.7 per cent by 2012 from<br />
<strong>our</strong> 2007 base.<br />
2007 base<br />
2010<br />
11.82<br />
11.14<br />
Waste to landfill<br />
This measure tracks Group waste sent to landfill in tonnes per million<br />
cigarettes equivalent.<br />
Our target is to reduce waste sent to landfill in tonnes per million<br />
cigarettes equivalent by 12 per cent by 2012 from <strong>our</strong> 2007 base.<br />
2007 base<br />
2010<br />
0.018<br />
0.025<br />
2009<br />
2010<br />
2010<br />
2002 base<br />
2010<br />
2000 base<br />
Tonnes per million cigarettes equivalent Percentage of waste recycled<br />
2010<br />
2009<br />
2010<br />
0.85<br />
0.27**<br />
4.15<br />
0.37<br />
0.38*<br />
Water use<br />
This measure tracks Group water use in cubic metres per million<br />
cigarettes equivalent.<br />
Our target is to reduce water use by 48 per cent by 2012 from<br />
<strong>our</strong> 2002 base.<br />
Cubic metres per million cigarettes equivalent<br />
4.85<br />
Carbon dioxide equivalent (CO 2 e)<br />
CO 2 e is largely derived from energy consumption and we track this<br />
in tonnes per million cigarettes equivalent.<br />
Our target is to reduce Group CO 2 e by 50 per cent by 2030 from<br />
<strong>our</strong> 2000 base.<br />
Gigajoules per million cigarettes equivalent Tonnes CO 2 per million cigarettes equivalent<br />
* 2010 figures exclude <strong>performance</strong> data from <strong>our</strong> acquisition in Indonesia<br />
Lost Workday Case Incident Rate (LWCIR)<br />
The LWCIR is a standard health and safety measure that helps us<br />
measure working days lost through injury on a consistent basis<br />
year-on-year.<br />
Our global aim is to have an LWCIR of 0.2 by the end of 2012.<br />
The local target set for all of <strong>our</strong> companies is zero accidents.<br />
LWCIR: Lost workday cases through injury x 200,000 ÷ total h<strong>our</strong>s worked<br />
* Excludes Indonesia<br />
** Includes Indonesia<br />
1.38<br />
Recycling<br />
This measure tracks the total percentage of Group waste re-used<br />
or recycled against total waste generated.<br />
Our target is to recycle more than 85 per cent of waste generated<br />
in each year.<br />
83.3<br />
85.2<br />
For more information visit<br />
www.bat.com/sustainability