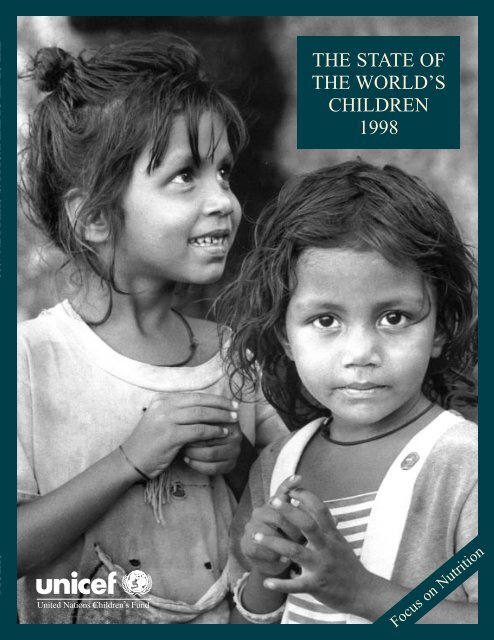
THE STATE OF THE WORLD'S CHILDREN 1998 - Unicef
THE STATE OF THE WORLD'S CHILDREN 1998 - Unicef
THE STATE OF THE WORLD'S CHILDREN 1998 - Unicef

You also want an ePaper? Increase the reach of your titles
YUMPU automatically turns print PDFs into web optimized ePapers that Google loves.
Focus on Nutrition<br />
<strong>THE</strong> <strong>STATE</strong> <strong>OF</strong><br />
<strong>THE</strong> WORLD’S<br />
<strong>CHILDREN</strong><br />
<strong>1998</strong>
<strong>THE</strong> <strong>STATE</strong> <strong>OF</strong> <strong>THE</strong> WORLD’S <strong>CHILDREN</strong><br />
<strong>1998</strong>
Oxford University Press, Walton Street,<br />
Oxford, OX2 6DP, Oxfordshire, UK.<br />
Oxford, New York, Toronto, Delhi, Bombay,<br />
Calcutta, Madras, Karachi, Kuala Lumpur,<br />
Singapore, Hong Kong, Tokyo, Nairobi,<br />
Dar es Salaam, Cape Town, Melbourne,<br />
Auckland and associated companies in<br />
Berlin and Ibadan.<br />
Oxford is a trade mark of Oxford<br />
University Press.<br />
Published in the United States by<br />
Oxford University Press, New York.<br />
Any part of <strong>THE</strong> <strong>STATE</strong> <strong>OF</strong> <strong>THE</strong> WORLD’S <strong>CHILDREN</strong><br />
may be freely reproduced with the appropriate<br />
acknowledgement.<br />
The Library of Congress has catalogued this<br />
serial publication as follows:<br />
The state of the world’s children — Oxford and<br />
New York: Oxford University Press<br />
for UNICEF<br />
v.; ill.; 20cm. Annual. Began publication<br />
in 1980.<br />
1. Children — Developing countries — Periodicals.<br />
2. Children — Care and hygiene — Developing<br />
countries — Periodicals. I. UNICEF.<br />
HQ 792.2. S73 83-647550 362.7’1’091724<br />
UNICEF, UNICEF House, 3 UN Plaza,<br />
New York, NY 10017, USA.<br />
E-mail: pubdoc@unicef.org<br />
Web site: www.unicef.org<br />
British Library Cataloguing in<br />
Publication Data<br />
The state of the world’s children <strong>1998</strong><br />
1. Children — Care and hygiene<br />
613’0432 RJ101<br />
UNICEF, Palais des Nations, CH-1211,<br />
Geneva 10, Switzerland.<br />
Cover photo<br />
India, 1996, 96-0163/Dominica<br />
ISBN 0-19-829401-8<br />
ISSN 0265-718X<br />
Back cover photo<br />
Sudan, 1993, UNICEF/93-1007/Press
<strong>THE</strong> <strong>STATE</strong><br />
<strong>OF</strong> <strong>THE</strong> WORLD’S<br />
<strong>CHILDREN</strong><br />
<strong>1998</strong><br />
Carol Bellamy, Executive Director,<br />
United Nations Children’s Fund<br />
Published for UNICEF by<br />
Oxford University Press
Contents<br />
Foreword by Kofi A. Annan, Secretary-General of the United Nations<br />
Chapter I<br />
Malnutrition: Causes, consequences and solutions<br />
Malnutrition is rarely regarded as an emergency; the children affected are not facing famine and betray few or<br />
no obvious signs. Yet the largely invisible crisis of malnutrition is implicated in more than half of all child<br />
deaths worldwide and violates children’s rights in profound ways, compromising their physical and mental<br />
development and helping perpetuate poverty. More widespread than many suspect — with one out of every<br />
three children affected — malnutrition lowers the productivity and abilities of entire societies. This chapter<br />
examines the scale of this intractable tragedy, the approaches that are helping resolve it and the new light that<br />
scientific research is shedding on it.<br />
The silent emergency: In this section, the scale of malnutrition and the complex interplay of factors that<br />
cause it, including poor health services and discrimination against women, are presented.<br />
Approaches that work: Community involvement, food fortification, growth monitoring and promotion,<br />
supplementation programmes — these are some of the many and often overlapping approaches that are<br />
changing, and saving, children’s lives.<br />
Bringing science to bear: Vitamin A reduced maternal death rates by 44 per cent on average, according to<br />
a recent study. This section spotlights some of the breakthroughs that science is making in the fight for better<br />
nutrition.<br />
Chapter II<br />
Statistical tables<br />
6<br />
7<br />
9<br />
37<br />
71<br />
91<br />
Statistics, vital indicators of the care, nurture and resources that children receive in their communities and<br />
countries, help chart progress towards the goals set at the 1990 World Summit for Children. The eight tables<br />
in this report have been expanded to give the broadest possible coverage of important basic indicators for nutrition,<br />
health, education, demographics, economic indicators and the situation of women, plus rates of<br />
progress and regional summaries. They also include complete data, as available, on less populous countries,<br />
covering 193 countries in all, listed alphabetically. Countries are shown on page 93 in descending order of<br />
their estimated 1996 under-five mortality rates, which is also the first basic indicator in table 1.<br />
Panels<br />
1 VITAMIN A SUPPLEMENTS SAVE PREGNANT WOMEN’S LIVES 12<br />
2 WHAT IS MALNUTRITION? 14<br />
3 STUNTING LINKED TO IMPAIRED INTELLECTUAL DEVELOPMENT 16<br />
4 RECOGNIZING <strong>THE</strong> RIGHT TO NUTRITION 20<br />
5 GROWTH AND SANITATION: WHAT CAN WE LEARN FROM CHICKENS? 26<br />
6 BREASTMILK AND TRANSMISSION <strong>OF</strong> HIV 30<br />
7 HIGH-ENERGY BISCUITS FOR MO<strong>THE</strong>RS BOOST INFANT SURVIVAL BY 50 PER CENT 32<br />
8 UNICEF AND <strong>THE</strong> WORLD FOOD PROGRAMME 38<br />
9 TRIPLE A TAKES HOLD IN OMAN 40<br />
10 CELEBRATING GAINS IN <strong>CHILDREN</strong>’S HEALTH IN BRAZIL 42<br />
11 REWRITING ELIAS’S STORY IN MBEYA 44<br />
4
12 WOMEN IN NIGER TAKE <strong>THE</strong> LEAD AGAINST MALNUTRITION 46<br />
13 BFHI: BREASTFEEDING BREAKTHROUGHS 50<br />
14 TACKLING MALNUTRITION IN BANGLADESH 52<br />
15 KIWANIS MOBILIZE TO END IODINE DEFICIENCY’S DEADLY TOLL 56<br />
16 INDONESIA MAKES STRIDES AGAINST VITAMIN A DEFICIENCY 62<br />
17 MAKING FOOD ENRICHMENT PROGRAMMES SUSTAINABLE 64<br />
18 ZINC AND VITAMIN A: TAKING <strong>THE</strong> STING OUT <strong>OF</strong> MALARIA 74<br />
19 PROTECTING NUTRITION IN CRISES 80<br />
20 PROGRESS AGAINST WORMS FOR PENNIES 84<br />
21 CHILD NUTRITION A PRIORITY FOR <strong>THE</strong> NEW SOUTH AFRICA 86<br />
Spotlights<br />
WORLD FOOD SUMMIT 39<br />
TEN STEPS TO SUCCESSFUL BREASTFEEDING 49<br />
VITAMIN A 76<br />
ZINC 77<br />
IRON 78<br />
IODINE 79<br />
FOLATE 83<br />
Text figures<br />
FIG. 1 MALNUTRITION AND CHILD MORTALITY 11<br />
FIG. 2 TRENDS IN CHILD MALNUTRITION, BY REGION 18<br />
FIG. 3 FROM GOOD NUTRITION TO GREATER PRODUCTIVITY AND BEYOND 19<br />
FIG. 4 POVERTY AND MALNUTRITION IN LATIN AMERICA AND <strong>THE</strong> CARIBBEAN 21<br />
FIG. 5 CAUSES <strong>OF</strong> CHILD MALNUTRITION 24<br />
FIG. 6 INADEQUATE DIETARY INTAKE/DISEASE CYCLE 25<br />
FIG. 7 INTERGENERATIONAL CYCLE <strong>OF</strong> GROWTH FAILURE 34<br />
FIG. 8 BETTER NUTRITION THROUGH TRIPLE A 41<br />
FIG. 9 IODINE DEFICIENCY DISORDERS AND SALT IODIZATION 55<br />
FIG. 10 PROGRESS IN VITAMIN A SUPPLEMENTATION PROGRAMMES 59<br />
FIG. 11 MEASLES DEATHS AND VITAMIN A SUPPLEMENTATION 72<br />
FIG. 12 ZINC SUPPLEMENTATION AND CHILD GROWTH (ECUADOR, 1986) 73<br />
FIG. 13 MATERNAL HEIGHT AND CAESAREAN DELIVERY (GUATEMALA, 1984-1986) 75<br />
References 88<br />
Index 128<br />
Glossary 131<br />
5
Foreword<br />
To look into some aspects of the future, we do not need projections by supercomputers.<br />
Much of the next millennium can be seen in how we care for our children today.<br />
Tomorrow’s world may be influenced by science and technology; but more than<br />
anything, it is already taking shape in the bodies and minds of our children.<br />
In The State of the World’s Children <strong>1998</strong>, UNICEF — the only United Nations agency<br />
dedicated exclusively to children — spells out a simple but most pressing truth. Sound nutrition<br />
can change children’s lives, improve their physical and mental development, protect their health<br />
and lay a firm foundation for future productivity.<br />
Over 200 million children in developing countries under the age of five are malnourished.<br />
For them, and for the world at large, this message is especially urgent. Malnutrition contributes to<br />
more than half of the nearly 12 million under-five deaths in developing countries each year.<br />
Malnourished children often suffer the loss of precious mental capacities. They fall ill more often.<br />
If they survive, they may grow up with lasting mental or physical disabilities.<br />
This human suffering and waste happen because of illness — much of it preventable; because<br />
breastfeeding is stopped too early; because children’s nutritional needs are not sufficiently understood;<br />
because long-entrenched prejudices imprison women and children in poverty.<br />
The world knows what is needed to end malnutrition. With a strong foundation of cooperation<br />
between local communities, non-governmental organizations, governments and international<br />
agencies, the future — and the lives of our children — can take the shape we want and they deserve,<br />
of healthy growth and development, greater productivity, social equity and peace.<br />
Kofi A. Annan<br />
Secretary-General of the United Nations<br />
6
Chapter I<br />
Malnutrition: Causes,<br />
consequences and solutions<br />
UNICEF/2982/Murray-Lee<br />
A healthy baby girl waits in a maternal and child health centre in Benin.<br />
7
The silent emergency<br />
UNICEF/97-0412/Balaguer<br />
It is implicated in more than half of<br />
all child deaths worldwide — a<br />
proportion unmatched by any infectious<br />
disease since the Black Death.<br />
Yet it is not an infectious disease.<br />
Its ravages extend to the millions<br />
of survivors who are left crippled,<br />
chronically vulnerable to illness —<br />
and intellectually disabled.<br />
It imperils women, families and,<br />
ultimately, the viability of whole societies.<br />
It undermines the struggle of the<br />
United Nations for peace, equity and<br />
justice. It is an egregious violation of<br />
child rights that undermines virtually<br />
every aspect of UNICEF’s work for<br />
the survival, protection and full development<br />
of the world’s children.<br />
Yet the worldwide crisis of malnutrition<br />
has stirred little public alarm,<br />
despite substantial and growing scientific<br />
evidence of the danger. More attention<br />
is lavished on the gyrations of<br />
world stock markets than on malnutrition’s<br />
vast destructive potential — or<br />
on the equally powerful benefits of<br />
sound nutrition, including mounting<br />
evidence that improved nutrition,<br />
such as an adequate intake of vitamin<br />
A and iodine, can bring profound benefits<br />
to entire populations.<br />
Malnutrition is a silent emergency.<br />
But the crisis is real, and its persis-<br />
Photo: Improved nutrition brings profound<br />
benefits. A Bolivian girl holds a piece of bread.<br />
tence has profound and frightening<br />
implications for children, society and<br />
the future of humankind.<br />
Malnutrition is not, as many think,<br />
a simple matter of whether a child can<br />
satisfy her appetite. A child who eats<br />
enough to satisfy immediate hunger<br />
can still be malnourished.<br />
And malnutrition is not just a silent<br />
emergency — it is largely an invisible<br />
one as well. Three quarters of the children<br />
who die worldwide of causes<br />
related to malnutrition are what nutritionists<br />
describe as mildly to moderately<br />
malnourished and betray no outward<br />
signs of problems to a casual observer.<br />
Malnutrition’s global toll is also<br />
not mainly a consequence of famines,<br />
wars and other catastrophes, as is<br />
widely thought; in fact, such events<br />
are responsible for only a tiny part of<br />
the worldwide malnutrition crisis. But<br />
such emergencies, like the ongoing<br />
crises in the Great Lakes region of<br />
Central Africa and in the Democratic<br />
People’s Republic of Korea, often<br />
result in the severest forms of malnutrition.<br />
Meeting food needs in these<br />
situations is essential, but so is protecting<br />
people from illness and ensuring<br />
that young children and other vulnerable<br />
groups receive good care.<br />
Child malnutrition is not confined<br />
to the developing world. In some<br />
industrialized countries, widening income<br />
disparities, coupled with reduc-<br />
More attention is lavished on<br />
the gyrations of world stock<br />
markets than on malnutrition’s<br />
vast destructive potential —<br />
or on the equally powerful<br />
benefits of sound nutrition.<br />
9
Reducing malnutrition should be an urgent<br />
global priority; inaction is a scandalous<br />
affront to the human right to survival.<br />
A malnourished child with his mother<br />
in Afghanistan.<br />
UNICEF/5510/Isaac<br />
tions in social protection, are having<br />
worrying effects on the nutritional<br />
well-being of children.<br />
Whatever the misconceptions, the<br />
dimensions of the malnutrition crisis<br />
are clear. It is a crisis, first and foremost,<br />
about death and disability of children<br />
on a vast scale, about women who<br />
become maternal mortality statistics<br />
partly because of nutritional deficiencies<br />
and about social and economic<br />
costs that strangle development and<br />
snuff out hope.<br />
Malnutrition has long been recognized<br />
as a consequence of poverty. It<br />
is increasingly clear that it is also a cause.<br />
In some parts of the world, notably<br />
Latin America and East Asia, there<br />
have been dramatic gains in reducing<br />
child malnutrition. But overall, the<br />
absolute number of malnourished children<br />
worldwide has grown.<br />
Half of South Asia’s children are malnourished.<br />
In Africa, one of every three<br />
children is underweight, and in several<br />
countries of the continent, the nutritional<br />
status of children is worsening.<br />
Malnourished children are much<br />
more likely to die as a result of a common<br />
childhood disease than those<br />
who are adequately nourished. And<br />
research indicates a link between malnutrition<br />
in early life — including the<br />
period of foetal growth — and the development<br />
later in life of chronic conditions<br />
like coronary heart disease,<br />
diabetes and high blood pressure, giving<br />
the countries in which malnutrition<br />
is already a major problem new<br />
cause for concern.<br />
The most critically vulnerable<br />
groups are developing foetuses, children<br />
up to the age of three and women<br />
before and during pregnancy and<br />
while they are breastfeeding. Among<br />
children, malnutrition is especially<br />
prone to strike those who lack nutritionally<br />
adequate diets, are not protected<br />
from frequent illness and do<br />
not receive adequate care.<br />
Illness is frequently a consequence<br />
of malnutrition — and malnutrition is<br />
also commonly the result of illness.<br />
Malaria, a major cause of child deaths<br />
in large parts of the world, also takes<br />
a major toll on child growth and development.<br />
In parts of Africa where<br />
malaria is common, about one third of<br />
child malnutrition is caused by malaria.<br />
The disease also has dangerous nutritional<br />
consequences for pregnant<br />
women. In addition, pregnant women<br />
are more susceptible to malaria, and<br />
children born to mothers with malaria<br />
run a greater chance of being born<br />
underweight and anaemic.<br />
There is no one kind of malnutrition.<br />
It can take a variety of forms that<br />
often appear in combination and contribute<br />
to each other, such as proteinenergy<br />
malnutrition, iodine deficiency<br />
disorders and deficiencies of iron and<br />
vitamin A, to name just a few.<br />
Many involve deficiencies of ‘micronutrients’<br />
— substances like vitamin<br />
A and iodine that the human body<br />
cannot make itself but that are needed,<br />
often in only tiny amounts, to orchestrate<br />
a whole range of essential physiological<br />
functions.<br />
Each type of malnutrition is the result<br />
of a complex interplay of factors<br />
involving such diverse elements as<br />
household access to food, child and<br />
maternal care, safe water and sanitation<br />
and access to basic health services.<br />
And each wreaks its own particular<br />
kind of havoc on the human body.<br />
Iodine deficiency can damage intellectual<br />
capacity; anaemia is a factor<br />
in the pregnancy and childbirth complications<br />
that kill 585,000 women<br />
annually; folate deficiency in expectant<br />
mothers can cause birth defects in<br />
infants, such as spina bifida; and vitamin<br />
D deficiency can lead to poor<br />
bone formation, including rickets.<br />
Vitamin A deficiency, which affects<br />
about 100 million young children<br />
worldwide, was long known to<br />
10
cause blindness. But it has become increasingly<br />
clear that even mild vitamin<br />
A deficiency also impairs the<br />
immune system, reducing children’s<br />
resistance to diarrhoea, which kills<br />
2.2 million children a year, and<br />
measles, which kills nearly 1 million<br />
annually. And new findings strongly<br />
suggest that vitamin A deficiency is a<br />
cause of maternal mortality as well,<br />
especially among women in impoverished<br />
regions (Panel 1).<br />
At its most basic level, malnutrition<br />
is a consequence of disease and<br />
inadequate dietary intake, which usually<br />
occur in a debilitating and often<br />
lethal combination. But many more<br />
elements — social, political, economic,<br />
cultural — are involved beyond the<br />
physiological.<br />
Discrimination and violence against<br />
women are major causes of malnutrition.<br />
Women are the principal providers<br />
of nourishment during the most crucial<br />
periods of children’s development,<br />
but the caring practices vital to<br />
children’s nutritional well-being invariably<br />
suffer when the division of<br />
labour and resources in families and<br />
communities favours men, and when<br />
women and girls face discrimination<br />
in education and employment.<br />
A lack of access to good education<br />
and correct information is also a cause<br />
of malnutrition. Without information<br />
strategies and better and more accessible<br />
education programmes, the awareness,<br />
skills and behaviours needed<br />
to combat malnutrition cannot be<br />
developed.<br />
There is, in short, nothing simple<br />
about malnutrition — except perhaps<br />
the fact of how vast a toll it is taking.<br />
Of the nearly 12 million children<br />
under five who die each year in developing<br />
countries mainly from preventable<br />
causes, the deaths of over<br />
6 million, or 55 per cent, are either<br />
directly or indirectly attributable to<br />
malnutrition (Fig. 1).<br />
Some 2.2 million children die from<br />
diarrhoeal dehydration as a result of<br />
persistent diarrhoea that is often aggravated<br />
by malnutrition.<br />
And anaemia has been identified<br />
as a contributing factor, if not a principal<br />
cause, in 20 per cent to 23 per<br />
cent of all post-partum maternal<br />
deaths in Africa and Asia, 1 an estimate<br />
many experts regard as conservative.<br />
If there were no other consequences<br />
of malnutrition, these horrific<br />
statistics would be more than enough<br />
to make its reduction an urgent global<br />
priority — and inaction a scandalous<br />
affront to the human right to survival.<br />
But the issue goes beyond child<br />
survival and maternal mortality and<br />
morbidity. Malnourished children,<br />
unlike their well-nourished peers, not<br />
only have lifetime disabilities and<br />
weakened immune systems, but they<br />
also lack the capacity for learning that<br />
their well-nourished peers have.<br />
In young children, malnutrition<br />
dulls motivation and curiosity and reduces<br />
play and exploratory activities.<br />
These effects, in turn, impair mental<br />
and cognitive development by reducing<br />
the amount of interaction children<br />
have both with their environment, and<br />
with those who provide care.<br />
Malnutrition in an expectant mother,<br />
especially iodine deficiency, can produce<br />
varying degrees of mental retardation<br />
in her infant.<br />
In infancy and early childhood,<br />
iron deficiency anaemia can delay<br />
psychomotor development and impair<br />
cognitive development, lowering IQ<br />
by about 9 points.<br />
Anaemic pre-schoolers have been<br />
found to have difficulty in maintaining<br />
attention and discriminating between<br />
visual stimuli. Poor school achievement<br />
among primary school and adolescent<br />
children has also been linked<br />
to iron deficiency. 2<br />
Low-birthweight babies have IQs<br />
that average 5 points below those of<br />
Fig. 1 Malnutrition and child<br />
mortality<br />
If a child is even mildly underweight, the mortality<br />
risk is increased. WHO estimates that malnutrition<br />
was associated with over half of all child deaths<br />
that occurred in developing countries in 1995.<br />
Perinatal<br />
causes<br />
18%<br />
Other<br />
32%<br />
Acute respiratory<br />
infections (ARI)<br />
19%<br />
Malnutrition<br />
55%<br />
Diarrhoea<br />
19%<br />
Measles<br />
7%<br />
Malaria<br />
5%<br />
Source: WHO, based on C.J.L. Murray and A.D. Lopez, The<br />
Global Burden of Disease, Harvard University Press,<br />
Cambridge (USA), 1996; and D.L. Pelletier, E.A. Frongillo and<br />
J.P. Habicht, ‘Epidemiological evidence for a potentiating<br />
effect of malnutrition on child mortality’, in American Journal<br />
of Public Health, 1993:83.<br />
11
Panel 1<br />
Vitamin A supplements save<br />
pregnant women’s lives<br />
Gilles Vauclair<br />
Each year, nearly 600,000 women<br />
die worldwide from pregnancyrelated<br />
causes. Prenatal vitamin<br />
A supplements will help reduce this<br />
massive toll, according to preliminary<br />
results from a major new study.<br />
By measuring the impact of low<br />
weekly doses of the vitamin on the<br />
health and survival of pregnant<br />
women in southern Nepal, the study<br />
found that deaths among women receiving<br />
either low-dose vitamin A or<br />
beta-carotene supplements dropped<br />
dramatically, by an average 44 per cent.<br />
Like many parts of the developing<br />
world, Nepal has a notoriously high<br />
maternal mortality rate — 125 times<br />
that of the United States — and vitamin<br />
A deficiency is common, particularly<br />
among pregnant women.<br />
Night-blindness, long ignored by the<br />
medical establishment and viewed<br />
by women as a routine consequence<br />
of pregnancy, but in reality a worrying<br />
sign of vitamin A deficiency, develops<br />
in 10 to 20 per cent of pregnant<br />
women.<br />
Researchers from Johns Hopkins<br />
University in the United States and<br />
the National Society for Eye Health<br />
and Blindness Prevention in Nepal,<br />
supported by the United States<br />
Agency for International Development<br />
(USAID) and Task Force Sight<br />
and Life, based in Switzerland, conducted<br />
the study to see whether<br />
maternal, foetal or infant mortality<br />
could be lowered by providing women<br />
of childbearing age one lowdose<br />
vitamin A capsule each week.<br />
Night-blindness and anaemia in women<br />
in the study and birth defects<br />
in their infants were also carefully<br />
investigated.<br />
Approximately 44,000 young married<br />
women, nearly half of whom became<br />
pregnant during the study,<br />
were given either vitamin A supplements<br />
a or placebos. The supplements<br />
were in the form of either pure vitamin<br />
A or beta-carotene, the vitamin<br />
A-active ingredient found in fruits<br />
and vegetables that the body converts<br />
to vitamin A.<br />
Among the women receiving pure<br />
vitamin A there were 38 per cent<br />
fewer deaths and among those receiving<br />
beta-carotene there were 50<br />
per cent fewer deaths, during pregnancy<br />
and the three months following<br />
childbirth, than among women<br />
receiving no supplements. b Anaemia,<br />
which is usually associated with iron<br />
deficiency and which is known to be<br />
a contributing cause of maternal<br />
deaths, was a surprising 45 per cent<br />
lower in the women receiving supplements<br />
who were not infected with<br />
hookworm.<br />
Women suffering from nightblindness<br />
(an inability to see at dusk<br />
or in dim light) were found to be<br />
more likely to get infections, to be<br />
anaemic and underweight and to<br />
be at greater risk of death. Nightblindness<br />
was reduced by 38 per<br />
cent and 16 per cent, respectively, in<br />
the vitamin A and beta-carotene<br />
groups, leaving questions about the<br />
most appropriate mix of nutrients,<br />
and the amounts needed, to prevent<br />
the condition. No reduction in foetal<br />
or infant mortality through six<br />
months of age was apparent in children<br />
born to women in the study.<br />
The scientists have not yet completed<br />
analysing the effects of supplements<br />
on the different causes of<br />
maternal deaths. However, deaths<br />
from infection are one important<br />
cause of high maternal mortality<br />
rates, and vitamin A is known to be<br />
essential for the effective functioning<br />
of the immune system that reduces<br />
the severity of infection.<br />
The results of this study indicate<br />
that where vitamin A deficiency is<br />
common, the regular and adequate<br />
12
intake of vitamin A c or betacarotene<br />
by women during their<br />
reproductive years can markedly<br />
reduce their risk of pregnancyrelated<br />
mortality. Adequate intake<br />
of vitamin A may also dramatically<br />
reduce anaemia in pregnant women<br />
if combined with deworming.<br />
This study helps highlight the<br />
urgent need to improve the nutrition<br />
of girls and women as part of<br />
a multi-pronged approach to reduce<br />
the tragedy of maternal mortality<br />
in the developing world and<br />
opens the way to new prevention<br />
strategies that can be widely implemented<br />
in the near future.<br />
NOTES<br />
a. The low-dose supplements contained<br />
7,000 µg of retinol equivalents (RE)<br />
(23,300 IU) of vitamin A, or a similar<br />
amount of beta-carotene, which is<br />
approximately equivalent to a woman’s<br />
weekly requirement.<br />
b. Deaths were reduced from 713 per<br />
100,000 pregnancies in the group of<br />
women not receiving supplements to 443<br />
and 354 deaths per 100,000 respectively<br />
in women receiving the weekly vitamin<br />
A and beta-carotene supplements.<br />
c. Although found in many foods,<br />
vitamin A has powerful biological effects<br />
and care is essential to prevent the<br />
misuse of supplements, especially by<br />
pregnant women. High-dose (200,000 IU)<br />
vitamin A supplements of the type<br />
routinely provided at four to six monthly<br />
intervals to young children in developing<br />
countries should never be taken by<br />
women of childbearing age because of<br />
the risk of possible harm to a developing<br />
foetus. High-dose supplements may,<br />
however, be safely given to women<br />
within eight weeks following childbirth.<br />
Low-dose weekly vitamin A supplements,<br />
like those given in this study,<br />
and even lower-dose daily supplements<br />
can be taken by women during their<br />
reproductive years with little risk to<br />
mother or foetus and with considerable<br />
benefit wherever deficiency is likely.<br />
Photo: A mother and child in Nepal, where<br />
a recent study showed that weekly vitamin<br />
A supplements given to pregnant women<br />
substantially reduced maternal deaths.<br />
healthy children. And children who<br />
were not breastfed have IQs that are 8<br />
points lower than breastfed children.<br />
The depletion of human intelligence<br />
on such a scale — for reasons<br />
that are almost entirely preventable —<br />
is a profligate, even criminal, waste.<br />
Robbed of their mental as well as<br />
physical potential, malnourished children<br />
who live past childhood face<br />
diminished futures. They will become<br />
adults with lower physical and intellectual<br />
abilities, lower levels of productivity<br />
and higher levels of chronic<br />
illness and disability, often in societies<br />
with little economic capacity for<br />
even minimal therapeutic and rehabilitative<br />
measures.<br />
At the family level, the increased<br />
costs and pressures that malnutritionlinked<br />
disability and illness place on<br />
those who care for them can be devastating<br />
to poor families — especially to<br />
mothers, who receive little or no help<br />
from strained social services in developing<br />
countries.<br />
And when the losses that occur in<br />
the microcosm of the family are repeated<br />
millions of times at the societal<br />
level, the drain on global development<br />
is staggering.<br />
In 1990 alone, the worldwide loss<br />
of social productivity caused by four<br />
overlapping types of malnutrition — nutritional<br />
stunting and wasting, iodine<br />
deficiency disorders and deficiencies<br />
of iron and vitamin A — amounted to<br />
almost 46 million years of productive,<br />
disability-free life, according to one<br />
reckoning. 3<br />
Vitamin and mineral deficiencies<br />
are estimated to cost some countries<br />
the equivalent of more than 5 per cent<br />
of their gross national product in lost<br />
lives, disability and productivity. By<br />
this calculation, Bangladesh and India<br />
forfeited a total of $18 billion in 1995. 4<br />
Malnourished children’s low resistance<br />
to illness diminishes the effectiveness<br />
of the considerable resources<br />
Vitamin and mineral<br />
deficiencies are estimated<br />
to cost some countries the<br />
equivalent of more than<br />
5 per cent of their gross<br />
national product in lost lives,<br />
disability and productivity.<br />
13
Panel 2<br />
What is malnutrition?<br />
Malnutrition is usually the result<br />
of a combination of inadequate<br />
dietary intake and<br />
infection (Fig. 6). In children, malnutrition<br />
is synonymous with growth<br />
failure — malnourished children are<br />
shorter and lighter than they should<br />
be for their age. To get a measure of<br />
malnutrition in a population, young<br />
children can be weighed and measured<br />
and the results compared to<br />
those of a ‘reference population’<br />
known to have grown well. Measuring<br />
weight and height is the most<br />
common way of assessing malnutrition<br />
in populations.<br />
Although many people still refer<br />
to growth failure as ‘protein-energy<br />
malnutrition,’ or PEM, it is now recognized<br />
that poor growth in children<br />
results not only from a deficiency of<br />
protein and energy but also from an<br />
inadequate intake of vital minerals<br />
(such as iron, zinc and iodine) and vitamins<br />
(such as vitamin A), and often<br />
essential fatty acids as well. These<br />
minerals are needed in tiny quantities,<br />
on the order of a few thousandths of<br />
a gram or less each day. They are consequently<br />
called micronutrients. Micronutrients<br />
are needed for the production<br />
of enzymes, hormones and<br />
other substances that are required to<br />
regulate biological processes leading<br />
to growth, activity, development and<br />
the functioning of the immune and<br />
reproductive systems.<br />
All of the minerals that the body<br />
needs — calcium, phosphorous, iron,<br />
zinc, iodine, sodium, potassium and<br />
magnesium, for example — have to<br />
come either from the food we eat or<br />
from supplements. While the body<br />
manufactures many of the complex<br />
organic molecules it needs from simpler<br />
building blocks, the vitamins —<br />
A, the B complex, C and so on — are<br />
not synthesized. Vitamin D is exceptional<br />
in that it can be made in the<br />
skin, providing a person has sufficient<br />
exposure to direct sunlight.<br />
While micronutrients are needed<br />
at all ages, the effects of inadequate<br />
intake are particularly serious during<br />
periods of rapid growth, pregnancy,<br />
early childhood and lactation. We are<br />
learning more every day about the<br />
importance of micronutrients for the<br />
UNICEF/94-0736/Toutounji<br />
physical and the cognitive development<br />
of children.<br />
While widespread moderate malnutrition<br />
may not be obvious unless<br />
children are weighed and measured,<br />
some severely malnourished children<br />
develop clinical signs that are<br />
easily observed — severe wasting (or<br />
marasmus) and the syndrome known<br />
as kwashiorkor, with skin and hair<br />
changes and swelling of arms and<br />
legs. Despite years of research, the<br />
reasons why some children develop<br />
kwashiorkor and why others develop<br />
marasmus remains a mystery. What<br />
is clear is that left untreated, children<br />
with either condition are at high risk<br />
of dying from severe malnutrition,<br />
and that both kwashiorkor and marasmus<br />
can be prevented by ensuring<br />
an adequate intake of nutritious food<br />
and freedom from repeated infections.<br />
Less severe forms of malnutrition<br />
also cause death, mostly because<br />
they weaken children’s resistance to<br />
illness (Fig. 1).<br />
The 1990 World Summit for<br />
Children singled out deficiencies of<br />
three micronutrients — iron, iodine,<br />
and vitamin A — as being particularly<br />
common and of special concern for<br />
children and women in developing<br />
countries. Recently, knowledge of the<br />
prevalence and importance of zinc for<br />
child growth and development has<br />
placed it in that league as well. Vitamin<br />
D deficiency is now recognized as a<br />
major problem of children in countries<br />
such as Mongolia, the northern parts<br />
of China and some of the countries of<br />
the Commonwealth of Independent<br />
States that have long winters.<br />
Throughout this report, the term<br />
malnutrition is used to refer to the consequences<br />
of the combination of an<br />
inadequate intake of protein energy,<br />
micronutrients and frequent infections.<br />
Photo: Three sisters at a health centre in Haiti.<br />
14
that are spent to ensure that families<br />
have access to basic health services<br />
and sanitation. And investments in<br />
basic education by governments and<br />
their partners are compromised by<br />
malnutrition’s pernicious effects on<br />
brain development and intellectual<br />
performance.<br />
Iodine deficiency and iron deficiency<br />
anemia, which threaten millions<br />
of children, are especially worrisome<br />
factors as countries strive to<br />
improve their educational systems.<br />
Iron-deficient children under the<br />
age of two years show problems with<br />
coordination and balance and appear<br />
more withdrawn and hesitant. Such<br />
factors can hinder a child’s ability to<br />
interact with and learn from the environment<br />
and may lead to lower intellectual<br />
abilities. 5<br />
Severe iodine deficiency in utero<br />
can cause the profound mental retardation<br />
of cretinism. But milder deficiencies<br />
also take an intellectual toll.<br />
In the republic of Georgia, for instance,<br />
a widespread iodine deficiency,<br />
recently detected, is estimated<br />
to have robbed the country of 500,000<br />
IQ points in the 50,000 babies born in<br />
1996 alone. 6<br />
Many children suffer from multiple<br />
types of malnutrition, so numbers<br />
tend to overlap. But it is reliably estimated<br />
that globally 226 million children<br />
are stunted — shorter than they<br />
should be for their age, and shorter<br />
than could be accounted for by any<br />
genetic variation (Panel 2). Stunting<br />
is particularly dangerous for women,<br />
as stunted women are more likely to<br />
experience obstructed labour and are<br />
thus at greater risk of dying while giving<br />
birth. Stunting is associated with a<br />
long-term reduction in dietary intake,<br />
most often closely related to repeated<br />
episodes of illness and poor-quality diets.<br />
A study in Guatemala found that<br />
severely stunted men had an average<br />
of 1.8 fewer years of schooling than<br />
those who were non-stunted, while<br />
severely stunted women had, on average,<br />
one year less. The differences are<br />
important since every additional year<br />
of schooling translated into 6 per cent<br />
more in wages 7 (Panel 3).<br />
Some 67 million children are estimated<br />
to be wasted, which means<br />
they are below the weight they should<br />
be for their height — the result of reduced<br />
dietary intake, illness, or both.<br />
About 183 million children weigh<br />
less than they should for their age. In<br />
one study, children who were severely<br />
underweight 8 were found to be two to<br />
eight times more likely to die within<br />
the following year as children of normal<br />
weight for their age. 9<br />
More than 2 billion people — principally<br />
women and children — are<br />
iron deficient, 10 and the World Health<br />
Organization (WHO) has estimated<br />
that 51 per cent of children under the<br />
age of four in developing countries<br />
are anaemic. 11<br />
In most regions of the developing<br />
world, malnutrition rates have been<br />
falling over the last two decades, but<br />
at markedly different paces (Fig. 2).<br />
The exception is sub-Saharan Africa,<br />
where malnutrition rates began increasing<br />
in most countries during the<br />
early 1990s, following the regional<br />
economic decline that began in the<br />
late 1980s. As government budgets<br />
shrank, basic social services and<br />
health services were hit particularly<br />
hard. Per capita incomes also declined,<br />
affecting people’s ability to<br />
purchase food.<br />
In the United States, researchers<br />
estimate that over 13 million children —<br />
more than one in every four under the<br />
age of 12 — have a difficult time getting<br />
all the food they need, a problem<br />
that is often at its worst during the last<br />
week of the month when families’<br />
social benefits or wages run out. 12<br />
Over 20 per cent of children in the<br />
United States live in poverty, more<br />
Iron-deficient children under<br />
the age of two years show<br />
problems with coordination<br />
and balance and appear more<br />
withdrawn and hesitant. Such<br />
factors can hinder a child’s<br />
ability to interact with and<br />
learn from the environment<br />
and may lead to lower<br />
intellectual abilities.<br />
15
Panel 3<br />
Stunting linked to impaired intellectual development<br />
The effects of stunting<br />
In a non-verbal intelligence test given to eightyear-olds<br />
in the Philippines, scores strongly<br />
correlated with children’s level of stunting at<br />
age two. Children severely stunted at age two<br />
had the lowest test scores, while non-stunted<br />
children had scores on average 11 points higher.<br />
IQ score<br />
60<br />
55<br />
50<br />
45<br />
40<br />
None Mild Moderate Severe<br />
Level of stunting<br />
Malnutrition early in life is<br />
linked to deficits in children’s<br />
intellectual development that<br />
persist in spite of schooling and impair<br />
their learning ability, according<br />
to a recent study in the Philippines.<br />
The study analysed stunting —<br />
which is low height for age and a<br />
basic indicator of malnutrition —<br />
among more than 2,000 children living<br />
in metropolitan Cebu, the Philippines’<br />
second largest city. Nearly<br />
two thirds of the children studied<br />
were stunted. Those stunted earliest<br />
in life, before six months of age, were<br />
the most severely stunted by age<br />
two, the study found. The same children<br />
scored significantly lower on intelligence<br />
tests at 8 and 11 years of age<br />
than children who were not stunted.<br />
The study holds profound implications<br />
on a global level: 226 million<br />
children under age five in developing<br />
countries, nearly 40 per cent of this<br />
age group, suffer from moderate or<br />
severe stunting. “High levels of stunting<br />
among children suggest that there<br />
will also be long-term deficits in mental<br />
and physical development that<br />
can leave children ill-prepared to take<br />
maximum advantage of learning opportunities<br />
in school. This can also<br />
have consequences for children’s success<br />
later in life,” says Linda S. Adair,<br />
Ph.D., Associate Professor of Nutrition<br />
at the University of North<br />
Carolina, in Chapel Hill (US), one of<br />
the researchers.<br />
“Stunting does not directly cause<br />
poor intellectual development in children,”<br />
emphasizes Professor Adair.<br />
“Rather, the same underlying factors<br />
that cause stunting are also likely to<br />
impair children’s intellectual growth.”<br />
Among children in Cebu, the causes<br />
include low birthweight, insufficient<br />
breastfeeding, nutritionally inadequate<br />
food given to complement or<br />
replace breastmilk, and frequent diarrhoea<br />
and respiratory infections.<br />
Stunted children tend to enter school<br />
later and miss more days of school<br />
than well-nourished children, the<br />
study also found.<br />
The study, part of a collaborative<br />
research programme of the Office of<br />
Population Studies at the University<br />
of San Carlos in Cebu and the University<br />
of North Carolina, found that<br />
28 per cent of the children surveyed<br />
were severely stunted. At age two,<br />
these children were nearly 11 centimeters<br />
(5 inches) shorter than children<br />
who were not stunted. The IQ<br />
scores of the severely stunted children<br />
at eight years of age were 11<br />
points lower than those of the children<br />
who were not stunted.<br />
When the children in the study<br />
were tested again at age 11, those<br />
who had been most severely stunted<br />
at age 2 still scored lower on the intelligence<br />
test than children who had<br />
not been stunted, although the gap<br />
was narrower at about 5 IQ points.<br />
Children who were severely stunted<br />
Nearly 40 per cent of all children under five in<br />
the world are stunted due to malnutrition. Many<br />
of them will also face challenges in school as<br />
a result. Here, a contrast in stature is apparent<br />
between two girls the same age in Bangladesh.<br />
also had significantly lower scores on<br />
language and math achievement tests.<br />
Most of the children in the study<br />
were from poor families, and their<br />
diets, and those of their mothers, were<br />
below the nutritional levels recommended<br />
by the Philippine Government.<br />
They came from densely populated,<br />
poor urban communities, from<br />
newly settled areas on the outskirts of<br />
the city and from rural communities.<br />
This study underscores the importance<br />
and lasting impact of nutrition<br />
in the crucial months of infancy and<br />
beginning before birth with sound<br />
maternal nutrition. Infants denied a<br />
strong start in life face problems in<br />
making up the lost ground, and the<br />
impact on their own development<br />
and that of their societies can be a<br />
lasting one.<br />
UNICEF/97-0518/Vauclair<br />
16
than double the rate of most other industrialized<br />
countries. 13<br />
In the United Kingdom, children<br />
and adults in poor families face health<br />
risks linked to diet, according to a recent<br />
study that cited high rates of<br />
anaemia in children and adults, and<br />
of premature and low-weight births,<br />
dental diseases, diabetes, obesity and<br />
hypertension. 14<br />
In Central and Eastern Europe,<br />
economic dislocations accompanying<br />
the transition to market economies<br />
and major cutbacks in state-run social<br />
programmes are having a more profound<br />
effect on the most vulnerable.<br />
In the Russian Federation, the<br />
prevalence of stunting among children<br />
under two years of age increased<br />
from 9 per cent in 1992 to 15 per cent<br />
in 1994. 15 And in the Central Asian republics<br />
and Kazakstan, 60 per cent of<br />
pregnant women and young children<br />
are now anaemic.<br />
The effects of malnutrition also<br />
cross generations. The infants of<br />
women who are themselves malnourished<br />
and underweight are likely to be<br />
small at birth.<br />
Overall, 60 per cent of women of<br />
childbearing age in South Asia —<br />
where half of all children are underweight<br />
— are themselves underweight.<br />
In South-East Asia, the proportion of<br />
underweight women is 45 per cent; it<br />
is 20 per cent in sub-Saharan Africa.<br />
The power of good<br />
nutrition<br />
The devastation of malnutrition is<br />
hard to overstate, but so is the countervailing<br />
power of nutrition. Not only<br />
is good nutrition the key to the healthy<br />
development of individuals, families<br />
and societies, but there is also growing<br />
reason to believe that improving<br />
the nutrition of women and children<br />
will contribute to overcoming some of<br />
the greatest health challenges facing<br />
the world, including the burden of<br />
chronic and degenerative disease, maternal<br />
mortality, malaria and AIDS.<br />
The most obvious proof of the<br />
power of good nutrition can be seen in<br />
the taller, stronger, healthier children<br />
of many countries, separated by only<br />
a generation from their shorter, less<br />
robust parents, and by the better diets<br />
and more healthful, nurturing environments<br />
they enjoy.<br />
Stronger children grow into<br />
stronger, more productive adults. Wellnourished<br />
girls grow into women who<br />
face fewer risks during pregnancy and<br />
childbearing, and whose children set<br />
out on firmer developmental paths,<br />
physically and mentally. And history<br />
shows that societies that meet women’s<br />
and children’s nutritional needs also<br />
lift their capacities for greater social<br />
and economic progress (Fig. 3).<br />
Approximately half of the economic<br />
growth achieved by the United<br />
Kingdom and a number of Western<br />
European countries between 1790 and<br />
1980, for example, has been attributed<br />
to better nutrition and improved health<br />
and sanitation conditions, social investments<br />
made as much as a century<br />
earlier. 16<br />
Even in countries or regions where<br />
poverty is entrenched, the health and<br />
development of children and women<br />
can be greatly protected or improved<br />
(Fig 4). In parts of Brazil, for example,<br />
the percentage of underweight children<br />
plummeted from 17 per cent in 1973 to<br />
just under 6 per cent in 1996, at a time<br />
when poverty rates almost doubled.<br />
Much has already been achieved.<br />
For example, 12 million children every<br />
year are being spared irreversible<br />
mental impairment from iodine deficiency<br />
because of iodized salt. And<br />
more than 60 per cent of young children<br />
around the world are receiving<br />
vitamin A supplements.<br />
Some effects of even severe malnutrition<br />
on a child’s mental development<br />
Approximately half of the<br />
economic growth achieved by<br />
the United Kingdom and a<br />
number of Western European<br />
countries between 1790 and<br />
1980, for example, has been<br />
attributed to better nutrition<br />
and improved health and<br />
sanitation conditions, social<br />
investments made as much<br />
as a century earlier.<br />
17
Fig. 2 Trends in child malnutrition, by region<br />
The chart shows trends in malnutrition in 41 countries, in four regions, covering<br />
over half of children under five years old in the developing world. Countries with<br />
under-five populations below 1 million are not included, even where trend data<br />
were available.<br />
50<br />
Niger<br />
Mali<br />
Percentage underweight<br />
40<br />
Burundi<br />
Madagascar<br />
Congo Dem. Rep.<br />
30<br />
Malawi<br />
Ghana<br />
Zambia<br />
Senegal Uganda<br />
Tanzania<br />
Kenya<br />
20<br />
10<br />
0<br />
Côte d'lvoire<br />
Cameroon<br />
Zimbabwe<br />
1985 1990 1995<br />
Percentage underweight<br />
80<br />
70<br />
Bangladesh<br />
Bangladesh<br />
60<br />
Nepal<br />
Nepal Pakistan<br />
50 Sri Lanka<br />
Viet Nam<br />
Indonesia<br />
Sri Lanka<br />
Viet Nam<br />
Pakistan<br />
40<br />
Indonesia<br />
Myanmar<br />
Philippines<br />
30<br />
Philippines<br />
Myanmar<br />
20 China<br />
China<br />
10<br />
Asia and Pacific<br />
0<br />
1985 1990 1995<br />
Sub-Saharan Africa<br />
Asia and Pacific<br />
50<br />
50<br />
40<br />
40<br />
30<br />
Yemen<br />
30<br />
Guatemala<br />
Percentage underweight<br />
20<br />
10<br />
0<br />
Sudan<br />
Morocco<br />
Syria<br />
Egypt<br />
Turkey<br />
Algeria<br />
Tunisia<br />
1985 1990 1995<br />
Percentage underweight<br />
20<br />
10<br />
0<br />
Haiti<br />
Honduras<br />
Dominican Rep.<br />
Colombia<br />
Chile Brazil<br />
1985 1990 1995<br />
Bolivia<br />
Peru<br />
Middle East and North Africa<br />
Latin America and the Caribbean<br />
Note: Malnutrition is measured as the percentage of under-five children below -2 standard<br />
deviations of the median value for the National Center for Health Statistics (NCHS) reference<br />
population for weight-for-age. Rates have been adjusted for age; data for some countries reflect<br />
rates for the under-three population.<br />
Source: UNICEF, 1997.<br />
18
can be at least partially reversed. The<br />
intelligence of severely malnourished<br />
children was found to improve<br />
markedly, for example, when health<br />
care, adequate food and stimulation<br />
were provided continually. 17<br />
And there is increasing evidence<br />
that good nutrition helps the body resist<br />
infection; that when infection occurs,<br />
nutrition relieves its severity and<br />
seriousness; and that it speeds recovery.<br />
Thirty years ago, most people<br />
could readily accept the notion that a<br />
‘good diet’ was beneficial to overall<br />
health. But the idea that specific nutrients<br />
could help fend off — or, even<br />
more outlandishly, help treat — specific<br />
diseases smacked of ‘fringe science’.<br />
Today, through clinical trials and<br />
studies, the fringe is edging closer to<br />
the mainstream, as nutrition scientists as<br />
well as immunologists, paediatricians<br />
and gerontologists test the implications<br />
for public policy of large-scale<br />
interventions to improve nutrition and<br />
its effects on an array of critical physiological<br />
processes.<br />
Malnutrition, reflected in the poor<br />
growth of children and adolescents and<br />
the high prevalence of low-birthweight<br />
babies, already has well-known effects<br />
on a child’s capacity to resist illness.<br />
It is thus reasonable to argue<br />
that in the global fight to reduce childhood<br />
death and illness, initiatives to<br />
improve nutrition may be as powerful<br />
and important as, for example, immunization<br />
programmes.<br />
There are now numerous scientific<br />
studies that suggest, but do not yet<br />
prove, that vitamin A deficiency in a<br />
mother infected with the human immunodeficiency<br />
virus (HIV) may increase<br />
her risk of transmitting the<br />
virus to her infant.<br />
Early in the next millennium, it is<br />
thought that between 4 million and 5<br />
million children will be infected with<br />
HIV. The majority, mostly in sub-<br />
Saharan Africa, will acquire the infection<br />
directly from their mothers.<br />
Although it will take another year or<br />
two to be absolutely sure, improving<br />
the vitamin A status of populations<br />
where both HIV infection and vitamin<br />
A deficiency are common may make<br />
some contribution to reducing the<br />
transmission of the virus.<br />
The right to good<br />
nutrition<br />
However far-reaching the benefits of<br />
nutrition may be, ensuring good nutrition<br />
is a matter of international law,<br />
articulated in variously specific language<br />
in international declarations<br />
and human rights instruments dating<br />
back to the adoption of the Declara-<br />
Fig. 3 From good nutrition to greater productivity and beyond<br />
Good early nutrition is most likely to result where there is economic growth, especially equitable growth; when<br />
social services become affordable and accessible; and when adequate investment is made in human resources,<br />
including the empowerment of women. Good nutrition, in turn, contributes to greater productivity and thus to<br />
economic growth.<br />
Increased productivity<br />
Poverty reduction<br />
Improved child<br />
nutrition<br />
Enhanced human<br />
capital<br />
Economic growth<br />
Social-sector<br />
investments<br />
Source: Adapted from Stuart Gillespie, John Mason and Reynaldo Martorell, How Nutrition Improves, ACC/SCN, Geneva, 1996.<br />
19
Panel 4<br />
Recognizing the right to nutrition<br />
Nutrition has been expressed as<br />
a right in international human<br />
rights instruments since 1924.<br />
Among these are declarations, which<br />
are non-binding, and conventions<br />
and covenants, which are treaties<br />
carrying the force of law.<br />
Some of these human rights milestones<br />
are noted below.<br />
1924: Declaration of the Rights of<br />
the Child (also known as the<br />
Declaration of Geneva). Adopted<br />
after World War I by the League of<br />
Nations through the efforts of British<br />
child rights pioneer Eglantyne Jebb,<br />
the Declaration marks the beginning<br />
of the international child rights<br />
movement and is also the first international<br />
affirmation of the right to<br />
nutrition. The Declaration affirms<br />
that “the child must be given the<br />
means needed for its normal development,<br />
both materially and spiritually”<br />
and states that “the hungry<br />
child should be fed.”<br />
1948: Universal Declaration of<br />
Human Rights. This human rights<br />
landmark, adopted by the United<br />
Nations General Assembly, proclaims<br />
in article 25 that “everyone has the<br />
right to a standard of living adequate<br />
for the health and well-being of himself<br />
and of his family, including food,<br />
clothing, housing and medical care<br />
and necessary social services . . . .”<br />
This article also affirms that “motherhood<br />
and childhood are entitled to<br />
special care and assistance.”<br />
1959: Declaration of the Rights of<br />
the Child. Adopted unanimously by<br />
the United Nations General Assembly,<br />
the Declaration states in principle<br />
4 that children “shall be entitled to<br />
grow and develop in health” and that<br />
children “shall have the right to adequate<br />
nutrition, housing, recreation<br />
and medical services.”<br />
1966: International Covenant on<br />
Economic, Social and Cultural Rights.<br />
Adopted by the United Nations and<br />
ratified by 137 States as of mid-<br />
September 1997, this Covenant was<br />
the first to spell out States’ obligations<br />
to respect people’s economic,<br />
social and cultural rights. Article 11<br />
affirms the right of everyone to an<br />
adequate standard of living, including<br />
adequate food, and the “fundamental<br />
right of everyone to be free from<br />
hunger.” The Covenant also mandates<br />
States parties to take steps to<br />
realize this right, including measures<br />
“to improve methods of production,<br />
conservation and distribution of food.”<br />
1986: Declaration on the Right to<br />
Development. Article 1 of the Declaration,<br />
which was adopted by the<br />
United Nations General Assembly,<br />
proclaims that the right to development<br />
“is an inalienable human<br />
right,” with all people entitled to participate<br />
in and enjoy economic, social,<br />
cultural and political development<br />
“in which all human rights and<br />
fundamental freedoms can be fully<br />
realized.” Article 8 calls for all States<br />
to ensure equal opportunity for all in<br />
access to health services and food.<br />
1989: Convention on the Rights of<br />
the Child. The most widely ratified<br />
human rights treaty, the Convention<br />
establishes as international law all<br />
rights to ensure children’s survival,<br />
development and protection. Article<br />
24 mandates States parties to recognize<br />
children’s right to the “highest<br />
attainable standard of health” and to<br />
take measures to implement this<br />
right. Among key steps, States are<br />
mandated to provide medical assistance<br />
and health care to all children,<br />
with an emphasis on primary health<br />
care; combat disease and malnutrition,<br />
within the framework of primary<br />
health care, through the provision<br />
of adequate nutritious foods,<br />
and safe drinking water and adequate<br />
sanitation; and provide families<br />
with information about the advantages<br />
of breastfeeding.<br />
Ratifications: 191 States as of mid-<br />
September 1997, with only two countries<br />
— Somalia and the United<br />
States — yet to ratify.<br />
1990: World Declaration and Plan<br />
of Action on the Survival, Protection<br />
and Development of Children. The<br />
unprecedented numbers of world<br />
leaders attending the World Summit<br />
for Children committed themselves<br />
to “give high priority to the rights of<br />
children” in the Summit’s World<br />
Declaration. The Summit’s Plan of<br />
Action set out the steps in 7 major<br />
and 20 supporting goals for implementing<br />
the Declaration. Reducing<br />
severe and moderate malnutrition by<br />
half of 1990 levels among under-five<br />
children by the end of the century is<br />
the main nutrition goal.<br />
The 7 supporting nutrition goals<br />
are: reduction of low-weight births to<br />
less than 10 per cent of all births;<br />
reduction of iron deficiency anaemia<br />
in women by one third of 1990 levels;<br />
virtual elimination of iodine deficiency<br />
disorders; virtual elimination of<br />
vitamin A deficiency; empowerment<br />
of all women to exclusively breastfeed<br />
their children for about the first<br />
six months; institutionalization of<br />
growth monitoring and promotion;<br />
and dissemination of knowledge and<br />
supporting services to increase food<br />
production to ensure household food<br />
security.<br />
20
tion of the Rights of the Child in 1924<br />
(Panel 4).<br />
Under the 1979 Convention on the<br />
Elimination of All Forms of Discrimination<br />
against Women, for example,<br />
States parties must ensure that<br />
women receive full and equal access<br />
to health care, including adequate nutrition<br />
during pregnancy and lactation.<br />
And the 1990 World Summit for<br />
Children, with a Plan of Action that<br />
recognized the devastating effects of<br />
malnutrition on women and their children,<br />
set specific nutritional goals for<br />
children and women, including access<br />
to adequate food during pregnancy<br />
and lactation; the promotion, protection<br />
and support of breastfeeding and<br />
complementary feeding practices; growth<br />
monitoring with appropriate follow-up<br />
actions; and nutritional surveillance.<br />
But the right to nutrition receives<br />
its fullest and most ringing expression<br />
in the 1989 Convention on the Rights<br />
of the Child, whose 191 ratifications<br />
as of late 1997 make it the most<br />
universally embraced human rights<br />
instrument in history.<br />
Under the Convention, which<br />
commits States parties to realize the<br />
full spectrum of children’s political,<br />
civil, social, economic and cultural<br />
rights, virtually every government in<br />
the world recognizes the right of all<br />
children to the highest attainable standard<br />
of health, to facilities for the<br />
treatment of illness and for the rehabilitation<br />
of health — specifically including<br />
the right to good nutrition and<br />
its three vital components: food, health<br />
and care.<br />
Under the Convention’s pre-eminent<br />
guiding principle, good child nutrition<br />
is a right because it is in the “best interests<br />
of the child.”<br />
Article 24 of the Convention specifies<br />
that States parties must take “appropriate<br />
measures” to reduce infant<br />
and child mortality, and to combat<br />
disease and malnutrition through the<br />
use of readily available technology<br />
and through the provision of adequate,<br />
nutritious foods and safe drinking water.<br />
The world is obligated to ease<br />
child malnutrition on the basis of international<br />
law, scientific knowledge,<br />
practical experience and basic morality.<br />
The ravages caused by malnutrition<br />
on individuals, families and societies<br />
are preventable. The measures<br />
needed to reduce and end it are becoming<br />
increasingly well understood.<br />
And the gains for humanity from<br />
doing so — in greater creativity, energy,<br />
productivity, well-being and happiness<br />
— are immeasurable.<br />
Why time is of<br />
the essence<br />
A child’s organs and tissues, blood,<br />
brain and bones are formed, and intellectual<br />
and physical potential is<br />
shaped, during the period from conception<br />
through age three.<br />
Since human development proceeds<br />
particularly rapidly for the first<br />
18 months of life, the nutritional status<br />
of pregnant and lactating mothers and<br />
young children is of paramount importance<br />
for a child’s later physical,<br />
mental and social development. It is not<br />
an exaggeration to say that the evolution<br />
of society as a whole hinges on<br />
the nutrition of mothers and children<br />
during this crucial period of their lives.<br />
The healthy newborn who develops<br />
from a single cell — roughly the<br />
size of the period at the end of this<br />
sentence — will have some 2 billion<br />
cells and weigh an average of 3,250<br />
grams. 18 Under optimal conditions,<br />
the infant will double its birthweight<br />
in the first four months of life; by its<br />
third birthday, a healthy child will be<br />
four and a half times as heavy.<br />
Brain cells proliferate at the rate of<br />
250,000 a minute, beginning in the<br />
third week of gestation. 19 By the time<br />
of birth, a child will have 100 billion<br />
Fig. 4 Poverty and malnutrition in<br />
Latin America and the Caribbean<br />
Malnutrition in Latin America decreased from an<br />
estimated 21% in 1970 to 7.2% in 1997, while<br />
the rate of poverty, measured by income level,<br />
fluctuated only slightly over the last three<br />
decades, dropping from 45% in 1970 to 44% in<br />
1997. These trends show that the reduction of<br />
malnutrition is not solely dependent on increases<br />
in income. In Latin America, the gains in reducing<br />
malnutrition are attributed at the underlying level<br />
to good care practices and access to basic health<br />
services, including family planning, and<br />
water/sanitation services; and at the basic level<br />
to women's empowerment in terms of their<br />
education and the cash resources they control.<br />
Percentage<br />
50<br />
40<br />
30<br />
20<br />
10<br />
Per cent of families with<br />
income below poverty level<br />
Per cent of underweight<br />
children<br />
0<br />
1970 1975 1980 1985 1990 1995 2000<br />
Source: Aaron Lechtig, 'Child Undernutrition in Latin America<br />
and the Caribbean: Trends, reasons and lessons', presented<br />
to the Workshop on the Changing Conditions of the Child in<br />
Latin America and the Caribbean, University of Notre Dame,<br />
South Bend (USA), 26 September 1997, based on ACC/SCN,<br />
'Update of the Nutrition Situation 1996', Summary of results<br />
for the Third Report on the World Nutrition Situation,<br />
ACC/SCN, Geneva, 1996,and ECLAC, Social Panorama of<br />
Latin America 1996, Santiago (Chile), 1996.<br />
21
Women need rest and protection from<br />
overwork during pregnancy. As long as the<br />
unequal division of labour so common around<br />
the world persists, the caring practices vital to<br />
the nutritional well-being of children will<br />
suffer. In Niger, a pregnant woman carries<br />
several large bowls of sorghum.<br />
UNICEF/93-1972/Pirozzi<br />
neurons, linked by synapses, the complex<br />
nerve junctions that begin forming<br />
in the 13th week of gestation. 20<br />
Proliferating most rapidly after<br />
birth, in large part because of the<br />
stimulation and care a child receives,<br />
millions upon millions of these junctions<br />
will be forged by the time a<br />
healthy child reaches the age of two<br />
and a half. Physical, mental and<br />
cognitive development depend on<br />
these communication links between<br />
neurons. Without them, messages<br />
would dead-end, muscles would not<br />
flex, and the complex processes of<br />
thought and learning would not be<br />
possible.<br />
Growth during the foetal stage depends<br />
on how well nourished a<br />
woman was before pregnancy, as well<br />
as how much weight she gains while<br />
she is pregnant. Gains in weight are<br />
essential for the development of new<br />
maternal and foetal tissues, and for<br />
maternal body maintenance and energy.<br />
Since the foetus relies entirely on<br />
the mother for nutrients, pregnant<br />
women not only need to gain weight<br />
but also must maintain an optimal intake<br />
of essential nutrients such as iron<br />
and iodine.<br />
But fulfilling these interlocking<br />
food, health and care needs can be a<br />
struggle for many women in the developing<br />
world, where economic,<br />
social and cultural factors may be a<br />
barrier to good nutrition.<br />
Currently about 24 million lowbirthweight<br />
babies are born every<br />
year, which is about 17 per cent of all<br />
live births. Most are born in developing<br />
countries, where the main cause<br />
of low birthweight is not premature<br />
birth, as it is in the industrialized<br />
world, but poor foetal growth.<br />
Low-birthweight babies, defined<br />
as weighing less than 2.5 kilograms,<br />
are at greater risk of dying than infants<br />
of average weight. If they survive,<br />
they will have more episodes of illness,<br />
their cognitive development may<br />
be impaired, and they are also more<br />
likely to become malnourished. Evidence<br />
is also mounting that low birthweight<br />
predisposes children to a high<br />
risk of diabetes, heart disease and<br />
other chronic conditions later in life.<br />
The measures that are essential<br />
for an expectant mother — care and<br />
rest, a reduced workload and a wellbalanced<br />
diet that affords ample energy,<br />
protein, vitamins, minerals and<br />
essential fatty acids — are equally important<br />
when a woman is breastfeeding<br />
her child.<br />
Breastfeeding perfectly combines<br />
the three fundamentals of sound nutrition<br />
— food, health and care — and is<br />
the next critical window of nutritional<br />
opportunity after pregnancy. While<br />
not all children are breastfed, it remains<br />
an important protection for<br />
children (see also page 47).<br />
Because breastmilk contains all<br />
the nutrients, antibodies, hormones<br />
and antioxidants an infant needs to<br />
thrive, it plays a pivotal role in promoting<br />
the mental and physical development<br />
of children.<br />
Breastfed infants not only show<br />
better immune responses to immunizations,<br />
but their intake of breastmilk<br />
also protects the mucous membranes<br />
that line their gastrointestinal and respiratory<br />
tracts, thus shielding them<br />
against diarrhoea and upper respiratory<br />
tract infections. 21<br />
In countries where infant mortality<br />
rates are high or moderately high,<br />
a bottle-fed baby in a poor community<br />
is 14 times more likely to die from<br />
diarrhoeal diseases and 4 times more<br />
likely to die from pneumonia than a<br />
baby that is exclusively breastfed. 22<br />
Breastfeeding also has cognitive<br />
benefits. In one study, breastfed subjects<br />
generally had IQs that were<br />
about 8 points higher than children<br />
who had been bottle-fed, and higher<br />
achievement scores as well. 23 Nutri-<br />
22
tionists theorize that the effect may be<br />
the result of the growth-promoting<br />
long-chain fatty acids of breastmilk.<br />
It may also be related to the fact that<br />
breastfed infants have fewer infections<br />
and, as healthier infants, they take a<br />
greater interest in their environment<br />
and thus learn more than ill infants.<br />
However, for mothers infected<br />
with HIV, breastfeeding’s enormous<br />
value as a bulwark against malnutrition,<br />
illness and death must be weighed<br />
against the 14 per cent risk that they<br />
may transmit the virus to their infants<br />
through breastmilk — and the vastly<br />
greater risk, especially in poor communities<br />
with inadequate water and<br />
sanitation, that feeding their children<br />
artificially will lead to infant deaths<br />
from diarrhoeal dehydration and respiratory<br />
infections.<br />
During the second half of a child’s<br />
first year, synaptic growth in the prefrontal<br />
cortex of the brain, the seat of<br />
forethought and logic, consumes twice<br />
the amount of energy required by an<br />
adult brain. Much of this synaptic<br />
growth is believed to result from the<br />
caring stimulation that an infant and<br />
young child receives — the nurturing,<br />
feeding and learning play in which<br />
parents engage their children.<br />
After about six months, for optimal<br />
growth and development, a child<br />
needs to be fed frequently with energyrich,<br />
nutrient-dense foods. The failure<br />
to make such investments at the right<br />
time can never be remedied later. An<br />
adequate intake of micronutrients,<br />
especially iodine, iron, vitamin A and<br />
zinc, remains crucial.<br />
Spotlighting the causes<br />
An understanding of the complex and<br />
subtle causes of malnutrition is important<br />
to appreciate the scale and<br />
depth of the problem, the progress<br />
achieved to date and the possibilities<br />
for further progress that exist.<br />
Malnutrition, clearly, is not a simple<br />
problem with a single, simple solution.<br />
Multiple and interrelated determinants<br />
are involved in why malnutrition<br />
develops, and a similarly intricate<br />
series of approaches, multifaceted and<br />
multisectoral, are needed to deal with<br />
it (Fig. 5).<br />
Immediate causes<br />
The interplay between the two most<br />
significant immediate causes of malnutrition<br />
— inadequate dietary intake<br />
and illness — tends to create a<br />
vicious circle: A malnourished child,<br />
whose resistance to illness is compromised,<br />
falls ill, and malnourishment<br />
worsens. Children who enter<br />
this malnutrition-infection cycle can<br />
quickly fall into a potentially fatal<br />
spiral as one condition feeds off the<br />
other (Fig. 6).<br />
Malnutrition lowers the body’s<br />
ability to resist infection by undermining<br />
the functioning of the main<br />
immune-response mechanisms. This<br />
leads to longer, more severe and more<br />
frequent episodes of illness.<br />
Infections cause loss of appetite,<br />
malabsorption and metabolic and behavioural<br />
changes. These, in turn, increase<br />
the body’s requirements for<br />
nutrients, which further affects young<br />
children’s eating patterns and how<br />
they are cared for (see also page 27).<br />
Underlying causes<br />
Three clusters of underlying causes<br />
lead to inadequate dietary intake and<br />
infectious disease: inadequate access<br />
to food in a household; insufficient<br />
health services and an unhealthful environment;<br />
and inadequate care for<br />
children and women.<br />
❑ Household food security<br />
This is defined as sustainable access<br />
to safe food of sufficient quality and<br />
quantity — including energy, protein<br />
and micronutrients — to ensure ade-<br />
A complex interplay of factors such as<br />
household access to food, women’s status,<br />
caring practices, disease and access to safe<br />
water, sanitation and basic health services<br />
affect a child’s nutrition. A girl stands in the<br />
doorway of her home in Lebanon.<br />
UNICEF/5235/Toutounji<br />
23
Fig. 5 Causes of child malnutrition<br />
This conceptual framework on the causes of malnutrition was developed in 1990 as part of the UNICEF Nutrition Strategy. The framework shows that causes of<br />
malnutrition are multisectoral, embracing food, health and caring practices. They are also classified as immediate (individual level), underlying (household or family<br />
level) and basic (societal level), whereby factors at one level influence other levels. The framework is used, at national, district and local levels, to help plan effective<br />
actions to improve nutrition. It serves as a guide in assessing and analysing the causes of the nutrition problem and helps in identifying the most appropriate mixture<br />
of actions.<br />
Child malnutrition,<br />
death and disability<br />
Outcomes<br />
Inadequate dietary<br />
intake<br />
Disease<br />
Immediate causes<br />
Insufficient access<br />
to food<br />
Inadequate<br />
maternal and childcare<br />
practices<br />
Poor water/<br />
sanitation and<br />
inadequate health<br />
services<br />
Underlying causes at<br />
household/family level<br />
Inadequate and/or<br />
inappropriate knowledge and<br />
discriminatory attitudes limit<br />
Quantity and quality of actual<br />
resources — human, economic<br />
and organizational — and the<br />
way they are controlled<br />
household access to actual<br />
resources<br />
Basic causes at<br />
societal level<br />
Potential resources: environment, technology, people<br />
Political, cultural, religious,<br />
economic and social systems,<br />
including women’s status, limit<br />
the utilization of potential<br />
resources<br />
Source: UNICEF, 1997.<br />
24
quate intake and a healthy life for all<br />
members of the family.<br />
In rural areas, household food<br />
security may depend on access to<br />
land and other agricultural resources<br />
to guarantee sufficient domestic<br />
production.<br />
In urban areas, where food is<br />
largely bought on the market, a range<br />
of foods must be available at accessible<br />
prices to ensure food security.<br />
Other potential sources of food are<br />
by exchange, gifts from friends or<br />
family and in extreme circumstances<br />
food aid provided by humanitarian<br />
agencies.<br />
Household food security depends<br />
on access to food — financial, physical<br />
and social — as distinct from its<br />
availability. For instance, there may<br />
be abundant food available on the<br />
market, but poor families that cannot<br />
afford it are not food secure.<br />
For the poor, therefore, household<br />
food security is often extremely precarious.<br />
Agricultural production varies<br />
with the season and longer-term environmental<br />
conditions. Families selling<br />
crops may find themselves paid<br />
fluctuating prices depending on a variety<br />
of factors beyond their control,<br />
while those who need to buy food<br />
may encounter exorbitant prices.<br />
Families living on the edge of survival<br />
have few opportunities to build<br />
up sufficient stocks of food, or to develop<br />
alternatives that would cushion<br />
them in times of hardship. So while<br />
poor families may have adequate access<br />
to food for one month, what is essential<br />
is access that is consistent and<br />
sustainable.<br />
Women have a special role to play<br />
in maintaining household food security.<br />
In most societies, they are solely<br />
responsible for preparing, cooking,<br />
preserving and storing the family’s<br />
food — and in many societies they<br />
have the primary responsibility of<br />
producing and purchasing it. For<br />
Fig. 6<br />
household food security to translate<br />
into good nutrition, this often overwhelming<br />
burden of work must be<br />
redistributed or reduced so that other<br />
needs of children, also related to nutrition,<br />
can be met.<br />
❑<br />
Inadequate dietary intake/disease cycle<br />
Inadequate dietary intake and infection operate in a vicious cycle that accounts for much of the high morbidity<br />
and mortality seen in developing countries. When children don't eat enough or well enough, their immune<br />
system defences are lowered, resulting in greater incidence, severity and duration of disease. Disease speeds<br />
nutrient loss and suppresses appetite — so sick children tend not to eat as they should — and the cycle<br />
continues.<br />
Inadequate dietary intake<br />
Health services, safe water<br />
and sanitation<br />
Weight loss<br />
Growth faltering<br />
Immunity lowered<br />
Mucosal damage<br />
An essential element of good health is<br />
access to curative and preventive<br />
health services that are affordable and<br />
of good quality.<br />
Families should have a health centre<br />
within a reasonable distance, and<br />
the centre’s staff should be qualified<br />
and equipped to give the advice and<br />
care needed. According to the United<br />
Nations Development Programme<br />
(UNDP), access varies widely, but in<br />
as many as 35 of the poorest countries<br />
30 to 50 per cent of the population may<br />
have no access to health services at all. 24<br />
In Africa, the programme known<br />
as the Bamako Initiative was launched<br />
Appetite loss<br />
Nutrient loss<br />
Malabsorption<br />
Altered metabolism<br />
Source: Andrew Tomkins and Fiona Watson, Malnutrition and Infection, ACC/SCN, Geneva, 1989.<br />
Disease:<br />
- incidence<br />
- severity<br />
- duration<br />
25
Panel 5<br />
Growth and sanitation:<br />
What can we learn from chickens?<br />
Poultry farmers have known for<br />
some time that a chicken living<br />
in a dirty environment is a<br />
chicken that grows poorly. Even if it<br />
is not overtly sick all the time, it gains<br />
little weight.<br />
Is there a message here about the<br />
growth of children? Because growth,<br />
like other nutrition outcomes, is determined<br />
most immediately by diet and<br />
illness status, the answer, at least in<br />
part, may be yes. Infectious illness —<br />
which spreads more easily in unsanitary<br />
conditions — leads to poorer dietary<br />
intake and poor use of the<br />
nutrients ingested. This, in turn,<br />
leads to lower resistance to infection,<br />
and so on, in a vicious diet-infection<br />
cycle (Fig. 6).<br />
Now studies suggest that an unsanitary<br />
environment may have effects<br />
beyond those associated with<br />
particular bouts of illness. Researchers<br />
believe that children living in<br />
such conditions may suffer from a<br />
fairly constant, low-level challenge to<br />
their immune systems that impairs<br />
UNICEF/96-0234/Toutounji<br />
their growth, as has been shown in<br />
domestic fowl. Dr. Noel Solomons of<br />
the Centre for Studies of Sensory<br />
Impairment, Aging and Metabolism<br />
and colleagues suggest that along<br />
with classifying children as healthy<br />
(having no clinical illness) and<br />
acutely infected (with signs of illness<br />
readily detectable), there is also a<br />
category of “inapparently infected.”<br />
Children who are inapparently infected<br />
have no signs of clinical illness<br />
but do have abnormal levels of some<br />
immunological indicators. Such inapparent<br />
infections and the chronic<br />
low-level stimulation of the immune<br />
system associated with life in unsanitary<br />
conditions may mean that<br />
nutrients go to support the body’s immune<br />
response rather than growth.<br />
Poverty occurs in both South Asia<br />
and sub-Saharan Africa, but rates of<br />
malnutrition, especially stunting, are<br />
much higher in South Asia. A number<br />
of hypotheses have been advanced<br />
to explain this difference, and<br />
one is that it is due to poorer sanitation<br />
and hygiene practices, the much<br />
greater population density and degree<br />
of overcrowding in South Asia.<br />
Certainly, the dangers posed by<br />
poor access to potable water are well<br />
known. A recent review of data collected<br />
by the Demographic and Health<br />
Surveys, a USAID-supported project,<br />
indicates that health and nutrition<br />
benefits from improved sanitation,<br />
especially improved excreta disposal,<br />
may be even greater than<br />
those associated with better access<br />
to safe water alone.<br />
A group led by Dr. Reynaldo<br />
Martorell of Emory University (US)<br />
has designed a study to shed light on<br />
the relationship between sanitation<br />
and growth stunting. This study<br />
would follow 800 children in two locations<br />
in South Asia and 800 more<br />
in two locations in sub-Saharan<br />
Africa from the time their mothers<br />
become pregnant to when they are<br />
two years old and would collect a<br />
wide range of information on sanitation,<br />
hygiene practices and other aspects<br />
of the household environment.<br />
The children’s growth would be measured<br />
frequently along with indicators<br />
of feeding practices, diet quality, illness<br />
and many other factors. UNICEF<br />
is helping to secure funds for this<br />
study.<br />
Establishing a link between sanitation<br />
conditions and child growth in<br />
a cause-and-effect way will go a long<br />
way to clarifying priorities for action<br />
in this area. Such a link will also<br />
reveal just how useful the ‘dirty<br />
chicken’ model is for understanding<br />
stunted growth among children.<br />
Photo: Unsanitary living conditions cause<br />
illnesses that threaten children’s health and<br />
growth. New research now suggests that growth<br />
is harmed in unhygienic surroundings even<br />
before acute infection occurs. In Egypt, a girl<br />
amid mounds of garbage and animal waste.<br />
26
in 1987 to address the crisis in health<br />
care that came on the heels of budget<br />
cuts and economic decline in the<br />
1980s. It is a strategy for improving<br />
health services by moving their control,<br />
management and even some of<br />
their financing out of central jurisdiction<br />
and into communities.<br />
Now in place in a number of countries<br />
in Africa, the Initiative’s principles<br />
are being adopted and adapted in<br />
other regions as well. The results are<br />
promising: The supply of basic drugs<br />
in health centres is more consistent,<br />
and management committees, composed<br />
of village residents, help ensure<br />
that people pay reasonable fees for<br />
basic services and that the funds generated<br />
are well used.<br />
Nevertheless, the fact remains that<br />
many people do not have access to<br />
health care and may be further deterred<br />
from seeking timely and appropriate<br />
care by user fees for health care<br />
services.<br />
The additional challenge of creating<br />
a climate where preventive health<br />
and nutritional care components are<br />
also integrated into the Bamako model<br />
is harder to realize. Because they are<br />
less tangible to communities, preventive<br />
health and nutrition services are<br />
also often less in demand than curative<br />
care. Prevention, nonetheless, is<br />
vital and cost-effective.<br />
In terms of environmental health,<br />
the lack of ready access to a safe<br />
water supply and proper sanitation<br />
and the unhygienic handling of food<br />
as well as the unhygienic conditions<br />
in and around homes, which cause<br />
most childhood diarrhoea, have significant<br />
implications for the spread of<br />
infectious diseases.<br />
Moreover, when food is handled<br />
under unhygienic conditions and the<br />
environment is unhealthful, littered<br />
with animal and human wastes, young<br />
children are also more prone to infection<br />
by intestinal parasites, another<br />
cause of poor growth and malnutrition<br />
(Panels 5 and 20).<br />
Also, women and children are usually<br />
responsible for fetching the water<br />
needed for domestic use, a task that<br />
drains considerable time and energy.<br />
Depending on how much the distance<br />
to the water source is shortened, it has<br />
been estimated that women could<br />
conserve large reserves of energy, as<br />
many as 300 to 600 calories a day. 25<br />
Progress has been made in improving<br />
access to safe water. But more<br />
than 1.1 billion people lack this fundamental<br />
requirement of good nutrition. 26<br />
As for sanitary waste disposal, the<br />
world is actually losing ground, with<br />
the rate of coverage falling in both<br />
urban and rural areas. Only 18 per cent<br />
of rural dwellers had access to adequate<br />
sanitation services at the end of 1994, 27<br />
and overall some 2.9 billion people<br />
lack access to adequate sanitation. 28<br />
❑ Caring practices<br />
Experience has taught that even when<br />
there is adequate food in the house<br />
and a family lives in a safe and healthful<br />
environment and has access to<br />
health services, children can still become<br />
malnourished.<br />
Inadequate care for children and<br />
women, the third element of malnutrition’s<br />
underlying causes, has only<br />
recently been recognized and understood<br />
in all its harmful ramifications.<br />
Care is manifested in the ways a<br />
child is fed, nurtured, taught and<br />
guided. It is the expression by individuals<br />
and families of the domestic and<br />
cultural values that guide them.<br />
Nutritionally, care encompasses all<br />
measures and behaviours that translate<br />
available food and health resources<br />
into good child growth and<br />
development. This complex of caring<br />
behaviours is often mistakenly assumed<br />
to be the exclusive domain of<br />
mothers. It is, in fact, the responsibility<br />
and domain of the entire family<br />
Experience has taught that<br />
even when there is adequate<br />
food in the house and a<br />
family lives in a safe and<br />
healthful environment and<br />
has access to health services,<br />
children can still become<br />
malnourished.<br />
27
The introduction of<br />
complementary foods is a<br />
critical stage. A child will<br />
be put at increased risk of<br />
malnutrition and illness if<br />
these foods are introduced<br />
much before the age of six<br />
months, or if the preparation<br />
and storage of food in the<br />
home is not hygienic.<br />
and the community, and both mothers<br />
and children require the care of their<br />
families and communities.<br />
In communities where mothers are<br />
supported and cared for, they are, in<br />
turn, better able to care for young<br />
children.<br />
Among the range of caring behaviours<br />
that affects child nutrition and<br />
health, the following are most critical:<br />
t Feeding: As we have seen, exclusive<br />
breastfeeding for about six<br />
months, and then continued breastfeeding<br />
with the addition of safe,<br />
high-quality complementary foods<br />
into the second year of life, provides<br />
the best nourishment and protects<br />
children from infection.<br />
The introduction of complementary<br />
foods is a critical stage. A child<br />
will be put at increased risk of malnutrition<br />
and illness if these foods<br />
are introduced much before the age<br />
of six months, or if the preparation<br />
and storage of food in the home is<br />
not hygienic.<br />
On the other hand, a child must<br />
have complementary foods at the sixmonth<br />
point, since breastmilk no<br />
longer meets all nutritional needs.<br />
Delaying the switch-over much beyond<br />
six months of age can cause a<br />
child’s growth to falter.<br />
From about 6 months to 18 months<br />
of age, the period of complementary<br />
feeding, a child needs frequent feeding<br />
— at least four times daily, depending<br />
on the number of times a<br />
child is breastfed and other factors —<br />
and requires meals that are both dense<br />
in energy and nutrients and easy to<br />
digest.<br />
The foods a family normally eats<br />
will have to be adapted to the needs of<br />
small children, and time must be<br />
made available for preparing the<br />
meals and feeding children.<br />
Good caring practices need to be<br />
grounded in good information and<br />
knowledge and free of cultural biases<br />
and misperceptions. In many cultures,<br />
for instance, food and liquids are<br />
withheld during episodes of diarrhoea<br />
in the mistaken belief that doing<br />
so will end the diarrhoea. The practice<br />
is dangerous because it denies the<br />
child the nutrients and water vital for<br />
recovery.<br />
Other behaviours that affect nutrition<br />
include whether children are fed<br />
first or last among family members,<br />
and whether boys are fed preferentially<br />
over girls. In a number of cultures<br />
and countries, men, adult guests<br />
and male children eat before women<br />
and girls.<br />
The level of knowledge about hygiene<br />
and disease transmission is another<br />
important element of care. It<br />
involves food preparation and storage,<br />
and whether both those who prepare<br />
the food and those who eat it wash<br />
their hands properly before handling it.<br />
Ideas concerning appropriate child<br />
behaviour are also important. If, for<br />
instance, it is considered disrespectful<br />
for a child to ask for food, feeding<br />
problems can occur.<br />
t Protecting children’s health: Similarly<br />
rooted in good knowledge and<br />
information is the caring act of seeing<br />
that children receive essential health<br />
care at the right time. Early treatment<br />
can prevent a disease from becoming<br />
severe.<br />
Immunizations, for example, have<br />
to be carried out according to a specific<br />
schedule. Sound health information<br />
needs to be available to communities,<br />
and families and those caring<br />
for children need to be supported in<br />
seeking appropriate and timely health<br />
care.<br />
Therapeutic treatment for a severely<br />
malnourished child in the<br />
hospital is far more expensive than<br />
preventive care. According to a 1990<br />
US Department of Agriculture study,<br />
28
nutrition investments for pregnant<br />
women were very cost-effective:<br />
Every $1 spent on prenatal nutrition<br />
care yielded an average savings of<br />
about $3 in reduced medical costs for<br />
the children during the first two<br />
months after birth. 29<br />
A study in Ghana has also found<br />
savings in health care costs: Children<br />
receiving vitamin A supplements<br />
made fewer clinic visits and had lower<br />
hospital admission rates than children<br />
not receiving the supplement.<br />
t Support and cognitive stimulation<br />
for children: For optimal development,<br />
children require emotional support<br />
and cognitive stimulation, and<br />
parents and other caregivers have a<br />
crucial role in recognizing and responding<br />
to the actions and needs of<br />
infants.<br />
The link between caring stimulation<br />
and malnourished children is also<br />
important: Several studies have found<br />
that malnourished children who were<br />
given verbal and cognitive stimulation<br />
had higher growth rates than those<br />
who were not. 30<br />
Breastfeeding affords the best<br />
early occasion to provide support and<br />
stimulation. It enables mothers and<br />
their infants to develop a close emotional<br />
bond that benefits both. All<br />
children need — and delight in — the<br />
kind of play and stimulation that is essential<br />
for their cognitive, motor and<br />
social development.<br />
Verbal stimulation by caregivers is<br />
particularly important for a child’s<br />
linguistic development. Ill or malnourished<br />
children who are in pain<br />
and have lost their appetite need special<br />
attention to encourage them to<br />
feed and take a renewed interest in<br />
their surroundings during recovery.<br />
In addition to improved nutrient<br />
intake, optimal cognitive development<br />
also requires stimulation of, and regular<br />
interaction with, young children.<br />
The quality of these actions can be enhanced<br />
through education of parents<br />
and other caregivers. Child-to-child<br />
programmes, for example, can provide<br />
simple resources to older children<br />
to improve the care, development<br />
and nutritional well-being of<br />
their younger siblings.<br />
Policy makers need to recognize<br />
the significance of such measures and<br />
actions and take them into account<br />
when devising policy and programmes.<br />
But the timing must be carefully<br />
planned: Many early child development<br />
activities concentrate on children<br />
who are age three and older<br />
when the focus should be on children<br />
up to the age of three and should link<br />
care, good feeding and psychosocial<br />
activities.<br />
t Care and support for mothers: As<br />
long as the unequal division of labour<br />
and resources in families and communities<br />
continues to favour men, and as<br />
long as girls and women face discrimination<br />
in education and employment,<br />
the caring practices vital to the nutritional<br />
well-being of children will suffer.<br />
Women, on average, put nearly<br />
twice the hours of men into family<br />
and household maintenance. In<br />
Bangladesh, India and Nepal, for example,<br />
girls and women spend three<br />
to five hours more a week than boys<br />
and men in tasks such as carrying fuel<br />
and growing and processing food. 31<br />
They then spend an additional 20<br />
to 30 hours a week performing other<br />
unpaid household work. If the burdens<br />
they carry are not better and<br />
more equitably distributed, both they<br />
and their caring role will suffer.<br />
The elements of care most critical for<br />
women during pregnancy and lactation<br />
include extra quantities of good-quality<br />
food, release from onerous labour, adequate<br />
time for rest, and skilled and<br />
sensitive pre- and post-natal health<br />
care from trained practitioners.<br />
Exclusive breastfeeding for the first six months<br />
of a child’s life not only provides the best<br />
nourishment and protection from infection,<br />
but also enables mothers and their infants to<br />
develop close emotional bonds. A woman<br />
breastfeeds her three-month-old baby in<br />
the Federal Republic of Yugoslavia.<br />
UNICEF/95-0912/Lemoyne<br />
29
Panel 6<br />
Breastmilk and transmission of HIV<br />
Breastfeeding confers enormous<br />
benefits, preventing malnutrition<br />
and illness, saving lives<br />
and money. It is also, however, one<br />
way an HIV-positive mother could<br />
transmit the virus to her infant. A<br />
child stands the greatest risk —<br />
believed to be 20 per cent — of vertical<br />
or mother-to-child transmission<br />
during the time of late pregnancy<br />
and childbirth. There is an additional<br />
14 per cent risk that an infant will become<br />
infected through breastmilk.<br />
This risk of infection through<br />
breastfeeding needs to be weighed<br />
against the great dangers posed by<br />
artificial feeding: In communities<br />
where sanitation is inadequate and<br />
families are poor, death from diarrhoea<br />
is 14 times higher in artificially<br />
fed infants than in those who are<br />
breastfed. If HIV-positive women and<br />
those who fear HIV (without actually<br />
being infected) were to abandon<br />
breastfeeding in large numbers, without<br />
safe and reliable alternatives for<br />
feeding their children, the ensuing<br />
infant deaths from diarrhoea and respiratory<br />
infections could vastly outnumber<br />
those from HIV.<br />
The dilemma facing an HIV-positive<br />
woman who does not have easy access<br />
to safe water, who does not<br />
have enough fuel to sterilize feeding<br />
bottles and prepare alternatives to<br />
breastmilk, or who cannot afford to<br />
buy sufficient formula to ensure her<br />
child’s nutrition is a wrenching one<br />
that no mother can solve on her own.<br />
Support for women facing this dilemma<br />
is imperative, as the Joint United<br />
Nations Programme on HIV/AIDS<br />
(UNAIDS) made clear in 1996. The<br />
following measures are important<br />
starting points:<br />
• Pregnant women should have access<br />
to voluntary and confidential<br />
counselling and testing to determine<br />
their health status. If they<br />
are HIV positive, they should receive<br />
appropriate treatment to<br />
reduce the risk of vertical transmission.<br />
If they are HIV negative,<br />
health education is vital to help<br />
them and their partners remain<br />
that way.<br />
• HIV-positive mothers should be<br />
informed of the risks of both vertical<br />
transmission through breastfeeding<br />
and infections associated<br />
with artificial feeding in their local<br />
environment. Each woman should<br />
be assisted by HIV counsellors or<br />
health professionals to understand<br />
these risks and then make<br />
her own decision.<br />
• If an HIV-positive mother has access<br />
to adequate breastmilk substitutes<br />
that she can prepare<br />
safely, then she should consider<br />
artificial feeding. Other alternatives<br />
include wet-nursing by an<br />
HIV-negative woman, which may<br />
be acceptable in some cultures.<br />
Heat treatment of expressed breastmilk<br />
(62.5°C for 30 minutes) destroys<br />
the virus, which may be a<br />
good choice for some women.<br />
• When mothers who test positive<br />
for HIV choose not to breastfeed<br />
but are unable to or cannot afford<br />
feeding alternatives, help will be<br />
needed from a range of parties, including<br />
governmental and partner<br />
agencies. Attention must be paid<br />
to the needs of the most disadvantaged<br />
women, which include<br />
improved water and sanitation<br />
and attentive family health care.<br />
These measures should be part of<br />
an integrated strategy to reduce vertical<br />
transmission since breastfeeding<br />
is only a small part of the problem.<br />
Access to voluntary, confidential<br />
testing and counselling is key to any<br />
strategy to reduce vertical transmission.<br />
Access to a range of prenatal<br />
and obstetric care measures associated<br />
with reduced transmission risk<br />
is also essential.<br />
Studies now in progress will soon<br />
give a better understanding of the<br />
mechanisms, timing and risks of vertical<br />
transmission. It may be possible<br />
in a few years to offer all women lowcost,<br />
easily delivered services that<br />
will minimize or even eliminate the<br />
risk of vertical transmission. For now,<br />
access to the testing, counselling, information<br />
and other services noted<br />
above should be high priorities.<br />
30
The AIDS pandemic has introduced<br />
new and volatile considerations<br />
and aspects of care into already sensitive<br />
areas of human behaviour and interaction.<br />
High priority should be<br />
given to improving access to services<br />
that help minimize the risk of HIV<br />
transmission to women before, during<br />
and after pregnancy, as well as to their<br />
partners (Panel 6).<br />
Cultural norms and misconceptions<br />
affect the care women receive<br />
during pregnancy. In some culturally<br />
conservative communities in parts of<br />
Asia, for example, fish, meat, eggs<br />
and fat are not part of the diets of<br />
pregnant women because it is feared<br />
they will make a baby too large and<br />
difficult to deliver. Research shows,<br />
however, that better maternal diet can<br />
improve the birthweight of children in<br />
many cases without causing significantly<br />
increased head circumference<br />
of the newborn, which is the factor<br />
most likely to put small women at risk<br />
(Panel 7).<br />
The adjustment of workload is another<br />
aspect of the care accorded<br />
women during pregnancy — and one<br />
with powerful ramifications.<br />
A survey in one village in the<br />
Gambia, for example, found that even<br />
during periods of relatively low seasonal<br />
agricultural activity, women<br />
gained on average just 5.5 kilograms<br />
during pregnancy — only about half<br />
of the recommended weight gain that<br />
women need to sustain their developing<br />
foetus. 32<br />
Reductions in a woman’s workload<br />
during pregnancy, combined with more<br />
food of good quality, improve the nutritional<br />
status of a woman and her<br />
unborn child and reduce the risk that<br />
the child will have a low birthweight.<br />
In Viet Nam, when men assumed<br />
some of their pregnant wives’ responsibilities<br />
during the third trimester of<br />
pregnancy, women rested more, and<br />
their infants weighed more at birth.<br />
In Indonesia, infants born to women<br />
who received a food supplement did not<br />
weigh more at birth, but they developed<br />
better during the first year of life.<br />
The fact that women are usually<br />
the primary caregivers does not<br />
mean that men, families and communities<br />
are exempt from care-giving<br />
responsibilities.<br />
The often oppressive and demanding<br />
patriarchal environment in which<br />
millions of women live must give way<br />
to an equal partnership in which<br />
women enjoy autonomy and the sense<br />
of accomplishment that comes from<br />
building skills and capacities.<br />
At the same time, girls need to be<br />
free from pressures to marry early. A<br />
study in West Africa, for example,<br />
found that nearly 20 per cent of girls<br />
in rural areas of the Gambia and<br />
Senegal and 45 per cent of girls in<br />
Niger marry before the age of 15.<br />
Figures such as these underscore<br />
the great need for girls and women to<br />
be involved in major personal decisions,<br />
including not only their marrying<br />
age but also how closely the births<br />
of their children will be spaced.<br />
Adolescent pregnancy is a major<br />
risk factor for both mother and infant,<br />
as the girl may not have finished<br />
growing before her first pregnancy,<br />
making childbirth dangerous.<br />
The infant of a very young mother<br />
may have a low birthweight (Fig. 7).<br />
Higher risks of toxaemia, haemorrhage,<br />
anaemia, infection, obstructed<br />
labour and perinatal mortality are<br />
all associated with childbearing in<br />
adolescence.<br />
A number of measures are essential,<br />
therefore, to enable women and<br />
girls to develop their skills and abilities.<br />
These include ensuring their access to<br />
family and community resources,<br />
such as credit, and to education and<br />
information.<br />
The often oppressive and<br />
demanding patriarchal<br />
environment in which<br />
millions of women live<br />
must give way to an<br />
equal partnership.<br />
31
Panel 7<br />
High-energy biscuits for mothers boost<br />
infant survival by 50 per cent<br />
In the Gambia, well-targeted interventions<br />
to improve the nutrition of<br />
pregnant women are making a difference<br />
in the birthweight of their babies,<br />
and at the same time sharply<br />
reducing the risk of babies dying during,<br />
or shortly after, birth.<br />
A large, controlled study in the<br />
country’s rural West Kiang region has<br />
determined that the number of lowbirthweight<br />
babies fell by nearly 40<br />
per cent and that stillbirth and perinatal<br />
mortality rates in infants were<br />
almost 50 per cent lower when pregnant<br />
women received a daily ration<br />
of locally prepared, energy-rich biscuits.<br />
These remarkable results<br />
strengthen the argument for providing<br />
food supplements to pregnant<br />
women to reduce low birthweight.<br />
“The study clearly demonstrates<br />
that improved maternal nutrition, deliverable<br />
through a primary health<br />
care system, can have highly beneficial<br />
effects when efficiently targeted<br />
at women in genuine need,” says<br />
one of the study’s authors, Dr. Sana<br />
Ceesay, of the Dunn Nutrition Centre<br />
affiliated with the University of Cambridge,<br />
which has been working in<br />
partnership with the Gambian Health<br />
Department. The findings were published<br />
in the British Medical Journal<br />
in September 1997.<br />
UNICEF estimates that each year<br />
over 24 million babies are born<br />
below the low-birthweight threshold<br />
of 2.5 kg, and that 95 per cent of<br />
these births occur in the developing<br />
world. Low birthweight puts infants<br />
at a greatly increased risk of neonatal<br />
death and is an important cause of<br />
poor growth and development in<br />
later childhood. It can be due to a<br />
number of factors, including a<br />
woman’s small size, uterine infections,<br />
smoking, low oxygen levels in<br />
the blood (due to excessive work or<br />
high altitude) and malarial infection.<br />
However, when all these factors are<br />
UNICEF/91-0873/Pirozzi<br />
equal, the incidence of low birthweight<br />
is higher in economically deprived<br />
mothers than in affluent ones.<br />
The most likely explanation for<br />
the difference is that inadequate<br />
maternal nutrition suppresses foetal<br />
growth. It has often been difficult,<br />
nevertheless, to show real benefits to<br />
infants from improvements to a<br />
mother’s diet during pregnancy. The<br />
study in the Gambia provides such<br />
evidence.<br />
In this part of West Africa, previous<br />
studies had indicated that pregnant<br />
women — challenged as many<br />
women are by the high energy demands<br />
of water and fuel collection,<br />
agricultural work and child-care activities<br />
but also by the energy and<br />
other nutrient needs of pregnancy —<br />
did not eat enough or well enough to<br />
meet all these needs. The growth of<br />
their babies was thus threatened.<br />
The five-year, prenatal supplementation<br />
trial covered 28 villages in<br />
one region of the Gambia. In the intervention<br />
villages, pregnant mothers<br />
received daily high-energy<br />
groundnut-based biscuits, providing<br />
1,000 kcal/day on average after 20<br />
weeks of pregnancy. The biscuits<br />
were made from local ingredients<br />
and were baked by two village bakers<br />
in traditional clay ovens. Women<br />
in control villages received antimalarials,<br />
iron/folate supplements<br />
and antenatal care as did women in<br />
the intervention villages, but they did<br />
not receive the biscuits during pregnancy.<br />
Field workers weighed all the<br />
women in the study at regular intervals,<br />
and weighed and measured all<br />
infants at delivery.<br />
The biscuit supplement caused a<br />
highly significant increase in birthweight,<br />
reducing the numbers of infants<br />
classified as low birthweight by<br />
39 per cent. Particularly noteworthy<br />
32
was the reduction in low birthweight<br />
occurring in births during<br />
the annual ‘hungry season’, when<br />
birthweights normally are lower<br />
than in the harvest season, as a<br />
result of poor maternal nutrition<br />
combined with hard seasonal<br />
agricultural work. (It is unlikely<br />
that food supplements would<br />
have the same impact on pregnant<br />
women who are not chronically<br />
energy-deficient.)<br />
In addition to these remarkable<br />
benefits, this study refutes the<br />
idea prevailing in some circles<br />
that improving the diet of pregnant<br />
women will cause them to<br />
suffer higher rates of obstetrical<br />
complications because of the<br />
larger size of their newborns.<br />
Birthweight was indeed higher in<br />
the children of women who received<br />
the biscuits, but head circumference,<br />
which is the factor<br />
more closely related to pelvic disproportion<br />
in birth, was only<br />
slightly greater. The rate of obstetric<br />
complications of this kind was<br />
not higher in the supplemented<br />
women.<br />
Photo: A healthy newborn sleeps<br />
peacefully in the Gambia.<br />
Basic causes<br />
It is often said that poverty at the family<br />
level is the principal cause of child<br />
malnutrition. While it is true that a<br />
lack of resources and malnutrition<br />
often go hand in hand, this statement<br />
tells only part of the story.<br />
Many poor families do in fact receive<br />
adequate nutrition, and malnutrition<br />
is found in many better-off families.<br />
The broader explanation lies within<br />
a fuller understanding of the different<br />
types of resources necessary for<br />
good nutrition, and of the factors that<br />
affect families’ ability to access and<br />
control these resources.<br />
The three components of nutrition<br />
— food, health and care — interact<br />
closely in their influence on<br />
family life. Often efforts to fulfil one<br />
precondition for good nutrition compete<br />
for the same resources required<br />
to fulfil another condition.<br />
For example, if a woman has to<br />
spend excessive time in producing<br />
food to achieve household food security,<br />
her ability to provide adequate<br />
child care can be compromised. The result<br />
may be malnutrition in her young<br />
child.<br />
Political, legal and cultural factors at<br />
the national and regional levels may<br />
defeat the best efforts of households<br />
to attain good nutrition for all members.<br />
These include the degree to which<br />
the rights of women and girls are<br />
protected by law and custom; the political<br />
and economic system that<br />
determines how income and assets are<br />
distributed; and the ideologies and policies<br />
that govern the social sectors.<br />
For example, where it is known and<br />
appreciated by everyone in society —<br />
men and boys, women and girls,<br />
teachers and religious leaders, doctors<br />
and nurses — that women in the late<br />
stages of pregnancy need rest and protection<br />
from overwork, families are<br />
more apt to receive the social support<br />
they need to ensure this protection.<br />
How women are valued and treated in society,<br />
including their level of education, affects their<br />
ability to feed and care for their children.<br />
A first-grader in Colombia takes lunch<br />
before class begins.<br />
UNICEF/90-0017/Tolmie<br />
33
Fig. 7 Intergenerational cycle of growth failure<br />
The cycle of poor nutrition perpetuates itself across generations. Young girls who grow poorly become<br />
stunted women and are more likely to give birth to low-birthweight infants. If those infants are girls, they are<br />
likely to continue the cycle by being stunted in adulthood, and so on, if something isn't done to break the<br />
cycle. Adolescent pregnancy heightens the risk of low birthweight and the difficulty of breaking the cycle.<br />
Support is needed for good nutrition at all these stages — infancy, childhood, adolescence and adulthood —<br />
especially for girls and women.<br />
Child growth<br />
failure<br />
Low-birthweight<br />
baby<br />
Early pregnancy<br />
Low weight and<br />
height in teenagers<br />
Small adult woman<br />
Source: ACC/SCN, Second Report on the World Nutrition Situation: Vol. I: Global and Regional Results, ACC/SCN, Geneva, 1992.<br />
In places where there is a tradition<br />
of non-discrimination against women<br />
in law and custom, women are more<br />
likely to have good access to resources,<br />
including credit, and to the<br />
decision-making power that can enable<br />
them to make the best use of services<br />
for themselves and their children.<br />
****<br />
There is no doubt that while<br />
economic poverty is not the<br />
only kind of poverty that<br />
eventually affects nutrition, it is still<br />
an important factor.<br />
Overcoming entrenched poverty<br />
and underdevelopment requires resources<br />
and inputs that few developing<br />
countries, particularly the poorest,<br />
can muster, either on their own, through<br />
existing levels of private external investment<br />
and loans, or through current<br />
patterns of official assistance and<br />
loans.<br />
In 1996, for example, aggregate resource<br />
flows to the developing world<br />
from all sources totalled $232 billion,<br />
$59 billion of which was official development<br />
loans and grants and the<br />
rest, $156 billion, was private. Middleincome<br />
countries were the biggest recipients<br />
of the private investments and<br />
loans: Two thirds went to them and<br />
one third to low-income countries.<br />
34
The two regions of the world with the<br />
highest rates of childhood malnutrition<br />
— sub-Saharan Africa and South<br />
Asia — received only $1.6 billion and<br />
$5.2 billion respectively.<br />
And although bright spots exist in<br />
terms of investment and trade in sub-<br />
Saharan Africa, the problems of the<br />
continent’s economies remain stark,<br />
including relatively low levels of internal<br />
demand and the import quotas<br />
industrialized countries impose on<br />
African manufactured goods.<br />
At the same time, developing<br />
countries overall owed more than<br />
$2 trillion in external debt in 1995.<br />
Sub-Saharan Africa, for example,<br />
paid $13.6 billion in debt servicing in<br />
1995 — nearly double what it spent<br />
on health services. And developing<br />
countries bear by far the greatest proportion<br />
of the global burden of disease,<br />
which drains their human and<br />
economic resources.<br />
One potentially optimistic note in<br />
this dismal picture of declining aid<br />
flows and increasing debt is the new<br />
‘Heavily Indebted Poor Countries<br />
(HIPC) Debt Initiative’ launched by<br />
the World Bank and the International<br />
Monetary Fund in 1996. This initiative<br />
is designed to assist poor countries<br />
to achieve sustainable levels of<br />
debt based on an established track<br />
record of implementing social and<br />
economic reform and on the condition<br />
additional resources are channelled to<br />
basic social services. Bolivia, Burkina<br />
Faso and Uganda will benefit from<br />
the initiative only in April <strong>1998</strong> or<br />
later. More generous and timely<br />
debt-relief would enable these counties<br />
and others that will hopefully<br />
soon qualify to release resources to<br />
reduce malnutrition.<br />
If the basic causes of malnutrition<br />
are to be addressed, greater and better<br />
targeted resources and improved collaboration,<br />
participation and dialogue<br />
are needed. Awareness and information<br />
must be generated: between sections<br />
of national governments; between<br />
governments; with all development<br />
partners, donors, UN agencies, nongovernmental<br />
organizations (NGOs)<br />
and investors; and above all with those<br />
whose circumstances are rarely understood<br />
or noticed, the poor themselves.<br />
Action against malnutrition is both<br />
imperative and possible. The world,<br />
as the next part of this report explains,<br />
has already accumulated a wealth of<br />
experience and insights on which<br />
progress can be built.<br />
Increased awareness and education about the<br />
causes of malnutrition are essential if the<br />
problem is to be successfully addressed.<br />
A health card in her hand, a woman holds<br />
her baby at a UNICEF-assisted health<br />
centre in Syria.<br />
UNICEF/96-0572/Toutounji<br />
35
Approaches that work<br />
UNICEF/5603/Thomas<br />
To succeed, the fight against<br />
malnutrition must be waged<br />
on many fronts.<br />
Actions as diverse as improving<br />
women’s access to education, fortifying<br />
staple foods with essential nutrients,<br />
enhancing the spread of practical<br />
information and increasing government<br />
social-sector spending have all<br />
led to improved nutrition in a number<br />
of countries. The challenge is in devising<br />
overall strategies that address<br />
specific nutrition problems.<br />
The range of factors necessary for<br />
nutrition improvement was explored<br />
in a recent study by the United Nations, 1<br />
which confirmed that there is no one<br />
formula to follow but that certain elements<br />
are essential.<br />
For example, the empowerment of<br />
women is of central importance to improving<br />
nutrition of both women<br />
themselves and their children. This includes<br />
legislative and political efforts<br />
to combat discrimination against and<br />
exploitation of women and measures<br />
to ensure that women have adequate<br />
access to resources and care at all levels<br />
of society. Improving education<br />
for girls and women is also vital.<br />
Photo: Growth monitoring is a powerful tool<br />
to protect children’s nutrition and to empower<br />
communities. A child is weighed at a health<br />
centre in Ethiopia.<br />
The United Nations report had<br />
this is to say about the following<br />
specific factors involved in improving<br />
nutrition.<br />
t Nutrition and economic growth:<br />
Most countries in which nutrition has<br />
improved over the last two decades<br />
also enjoyed relatively high rates of<br />
economic growth over a sustained<br />
period. Nonetheless, the relationship<br />
is not completely straightforward.<br />
In countries where economic<br />
growth has resulted in increased<br />
household income and resource access<br />
for the poor, the nutritional payoff<br />
has been large. In Indonesia, for<br />
example, economic growth from 1976<br />
to 1986 was accompanied by a 50 per<br />
cent rise in the income of the poorest<br />
40 per cent of the people. Improvements<br />
in nutrition have been relatively<br />
constant throughout the economic<br />
boom, although they could have been<br />
even better.<br />
Household food insecurity — one<br />
of the key underlying causes of malnutrition<br />
— is often the pivotal point<br />
in the relationship between economic<br />
growth and nutritional status. Poor<br />
households spend a large proportion<br />
of their income on food. While poor<br />
households do not always use income<br />
increases to raise their calorie consumption<br />
significantly, in many countries<br />
greater income has led to in-<br />
The empowerment of women<br />
is of central importance to<br />
improving nutrition<br />
of both women themselves<br />
and their children.<br />
37
Panel 8<br />
UNICEF and the World Food Programme<br />
The World Food Programme<br />
(WFP), the food aid organization<br />
of the United Nations system,<br />
began operations in 1963 and is<br />
now the largest such organization in<br />
the world. WFP responds to food<br />
needs associated with emergencies<br />
and development, often working with<br />
the other two Rome-based agencies,<br />
the Food and Agriculture Organization<br />
of the United Nations (FAO) and<br />
the International Fund for Agricultural<br />
Development (IFAD).<br />
WFP provides three broad categories<br />
of food aid: emergency rations<br />
for victims of natural and man-made<br />
disasters (Food-For-Life); food aid<br />
distributed through health clinics,<br />
schools and other community centres<br />
to particularly vulnerable groups<br />
(Food-For-Growth); and food rations<br />
provided in exchange for work on development<br />
projects (Food-For-Work).<br />
In all three categories, much of WFP’s<br />
work is linked to the priorities and<br />
efforts of UNICEF.<br />
The link between the two sister<br />
agencies goes beyond organizational<br />
coordination. Their work is complementary,<br />
and they share common<br />
goals. Both recognize that children<br />
are at once the most vulnerable<br />
group in society — and yet the future<br />
of every community. Together, the<br />
two agencies have the tools to attack<br />
malnutrition, helping to ensure access<br />
to adequate nutrition, with food,<br />
health and care, and to fight with a<br />
unified voice for the elimination of<br />
hunger.<br />
In crisis situations requiring Food-<br />
For-Life assistance, UNICEF and WFP<br />
collaborate to provide therapeutic<br />
and supplementary feeding to save<br />
the lives of young children during<br />
emergencies, as occurred in the recent<br />
past in the countries of former<br />
Yugoslavia. They also share logistics<br />
capacity, for example in Uganda,<br />
where WFP stored UNICEF’s health<br />
kits and supplementary feeding supplies,<br />
subsequently transporting them<br />
to Rwanda during the sudden return<br />
of refugees in late 1996. And they cooperate<br />
in making joint assessments<br />
of the problem of inadequate nutrition<br />
and priority needs for addressing<br />
it, as in the case of the Democratic<br />
People’s Republic of Korea, where a<br />
nutrition assessment was completed<br />
in September 1997. In southern Sudan,<br />
the two agencies, together with NGOs<br />
and counterparts, lead an annual<br />
needs assessment mission, which not<br />
only examines food security but also<br />
‘health security’, based on nutritional<br />
status and access to health services.<br />
UNICEF and WFP also work together<br />
on post-conflict projects, such<br />
as the demobilization of child soldiers.<br />
In Bukavu, in eastern Democratic<br />
Republic of the Congo, WFP<br />
provides food to a centre set up<br />
by UNICEF to help children who<br />
fought in the civil conflict reintegrate<br />
in society.<br />
Food-For-Growth, the cornerstone<br />
of one of WFP’s major priorities, is<br />
particularly close to the concerns of<br />
UNICEF. This type of food aid is<br />
designed to provide assistance to<br />
mothers and children and other vulnerable<br />
groups at critical times in<br />
their lives. In Zambia, UNICEF worked<br />
closely with WFP in 1994 to ensure<br />
that a food supplement, aimed at preventing<br />
malnutrition in young children<br />
during prolonged drought, was<br />
appropriately formulated and fortified.<br />
The high-energy protein supplement<br />
was used as part of a coordinated<br />
programme to provide both food and<br />
health care to children judged to be<br />
at particularly high risk of malnutrition.<br />
In Madagascar, UNICEF and WFP<br />
work together to rehabilitate schools<br />
in the poorer regions of the south.<br />
UNICEF provides school kits and<br />
equipment, and WFP contributes<br />
school meals.<br />
The two agencies also work together<br />
on Food-For-Work projects<br />
when such aid dovetails with UNICEF<br />
mandates. In Malawi, for example,<br />
following the introduction of free primary<br />
education in 1994, WFP and<br />
UNICEF later designed a school feeding<br />
programme with the aim of<br />
‘Keeping kids in school’. Mothers of<br />
schoolchildren are ‘paid’ a food allocation<br />
in exchange for the preparation<br />
of school meals.<br />
38
Spotlight<br />
creased consumption of higher-quality<br />
foods that tend to be rich in protein<br />
and micronutrients — the vitamins<br />
and minerals needed in very small but<br />
regular amounts to assure nutrition.<br />
But while economic growth must<br />
be understood as a frequent contributor<br />
to nutrition improvement, it is not<br />
a necessary condition for it. A number<br />
of countries, such as the United<br />
Republic of Tanzania in the case described<br />
below, have achieved widespread<br />
nutrition improvement without<br />
significant overall economic growth.<br />
t Nutrition and the status of<br />
women: A major conclusion of the<br />
United Nations report is that in countries<br />
where nutrition improvement has<br />
lagged behind economic growth, social<br />
discrimination against women is<br />
common. In Pakistan, for example,<br />
widespread discrimination against<br />
girls and women is behind high levels<br />
of illiteracy among women and girls,<br />
a very high fertility rate and lower female<br />
life expectancy. Child malnutrition<br />
rates in Pakistan are among the<br />
highest in the world, as is the proportion<br />
of low-birthweight infants, at 25<br />
per cent.<br />
Some experts place the major<br />
blame for the very high child malnutrition<br />
and low birthweight throughout<br />
much of South Asia on such<br />
factors as women’s poor access to education<br />
and low levels of employment,<br />
compared with other regions.<br />
On the other hand, women in<br />
Thailand, where nutrition has improved<br />
remarkably in the last two<br />
decades, have very high literacy, high<br />
participation in the labour force, and a<br />
strong place in social and householdlevel<br />
decision-making.<br />
t Nutrition and social-sector spending:<br />
Investment in health, education,<br />
sanitation and other social sectors —<br />
especially with emphasis on access of<br />
women and girls to these services —<br />
is among the most important policy<br />
tools for improving nutrition.<br />
As a child survival and development<br />
measure, UNICEF has championed<br />
the 20-20 Initiative — the<br />
allocation of at least 20 per cent of<br />
government spending to basic social<br />
services to be matched by 20 per cent<br />
of donor funding in these areas. The<br />
value of such investment is becoming<br />
increasingly apparent. For example,<br />
there is evidence from Sri Lanka and<br />
a number of other countries that increases<br />
in spending on public health<br />
services are more strongly associated<br />
with reduced infant mortality and better<br />
nutrition than are overall increases<br />
in income.<br />
After Zimbabwe achieved independence<br />
in 1980, explicit policies<br />
were followed to redress the lack of<br />
access of many communities to basic<br />
services. As a result, there were vast<br />
improvements in health services and<br />
immunization, family planning and a<br />
range of educational services for the<br />
poor — all of them important determinants<br />
of the improvements in nutrition<br />
that the country has enjoyed.<br />
The approaches described above<br />
are all essential — and driven by the<br />
right of children and women to adequate<br />
services and resources.<br />
Actions that are more directed to<br />
nutrition improvement as a principal<br />
outcome — improving the quality of<br />
staple foods through fortification, improving<br />
local-level nutritional surveillance<br />
capacity, protecting women’s<br />
right to breastfeed, sharing information<br />
on better complementary foods —<br />
may have a more rapid and focused<br />
effect on nutrition.<br />
A number of these more direct approaches<br />
that have worked are described<br />
below.<br />
WORLD FOOD<br />
SUMMIT<br />
The World Food Summit, in which 186<br />
countries participated, was organized by<br />
the Food and Agricultural Organization of<br />
the United Nations (FAO) in Rome in<br />
November 1996. The Summit was an<br />
important contribution in the effort to<br />
refocus international attention on the<br />
need to tackle the problems of both food<br />
insecurity and malnutrition. The Summit’s<br />
Plan of Action focused on ways of achieving<br />
sustainable food security for all, one<br />
of the necessary conditions for good<br />
nutrition.<br />
The Plan of Action called for an enabling<br />
social and economic environment to<br />
achieve food security and drew attention<br />
to the special contribution that women<br />
can make to ensuring family and child<br />
nutrition, the importance of breastfeeding<br />
and the particular importance of giving<br />
priority to children, especially girls. Other<br />
objectives related to the need to reduce<br />
inequality and poverty and the need for<br />
participatory and sustainable rural development<br />
policies and for trade policies<br />
conducive to the achievement of food<br />
security for all. A commitment was made<br />
to realize the rights of all to adequate<br />
food and to freedom from hunger.<br />
39
Panel 9<br />
Triple A takes hold in Oman<br />
Over the last 27 years, Oman<br />
has made great strides in<br />
child survival and development.<br />
Child mortality dropped from<br />
215 per 1,000 live births in 1970 to 25<br />
in 1995. School enrolment, particularly<br />
among girls, has increased dramatically.<br />
Revenues from oil have<br />
provided an economic foundation—<br />
Oman’s GNP per capita in 1995 was<br />
$4,820 — but these gains would not<br />
have been possible without the<br />
Government’s commitment to improving<br />
people’s lives.<br />
Progress has been slower, however,<br />
in terms of child nutrition. The<br />
Ministry of Health, with support from<br />
UNICEF, has been working to address<br />
this challenge since 1993. To<br />
improve children’s nutritional status,<br />
a community-based programme of<br />
growth monitoring, counselling and<br />
nutrition education was devised. A<br />
particular focus is 105 villages of Al<br />
Dakhiliya, an arid, rocky region in<br />
upper-central Oman where a 1995<br />
survey found that nearly one third of<br />
the children under the age of five<br />
were underweight.<br />
The results to date are impressive.<br />
Since the project’s inception, there<br />
has been a significant drop in the<br />
number of underweight children, according<br />
to an appraisal in 1996. Later<br />
UNICEF/Oman<br />
the same year another appraisal described<br />
the project as well focused,<br />
effectively managed and clearly building<br />
a momentum towards nationwide<br />
nutritional improvement. Motivation,<br />
commitment and participation were<br />
high among mothers and community<br />
volunteers. And women enjoy the<br />
opportunity the programme offers to<br />
meet together and find common ground<br />
in helping their children grow better.<br />
The driving force of the programme<br />
is called ‘triple A’: three consecutive<br />
steps in a problem-solving<br />
cycle of Assessing the problem,<br />
Analysing its causes and initiating<br />
Actions to improve children’s nutrition.<br />
Triple A is an iterative process<br />
that repeats the cycle of reassessment,<br />
re-analysis and re-action, leading<br />
to regular modifications and improvements<br />
in the approaches taken.<br />
True to this model, the people of<br />
the small villages and nomadic or<br />
semi-nomadic settlements of Al<br />
Dakhiliya were involved from the<br />
very start, attending meetings to<br />
identify the problems, discuss solutions<br />
and select from among themselves<br />
the volunteers who would be<br />
central to the effort.<br />
Every month throughout the region,<br />
at public meetings or during<br />
visits to homes, these volunteers<br />
weigh children and chart their growth,<br />
referring severely underweight children<br />
to health care centres. They advise<br />
families on how to feed children<br />
and to improve caring practices, on<br />
how to keep children healthy and<br />
manage illness when it occurs and<br />
on how to space births. They also reinforce<br />
other public health activities,<br />
encouraging pregnant women to<br />
register early for antenatal care, for<br />
example, and helping in community<br />
immunization campaigns and national<br />
health days.<br />
Regional trainers were brought in<br />
to teach the volunteers about the incidence<br />
and causes of malnutrition,<br />
and how to improve and support appropriate<br />
feeding and caring practices,<br />
using the triple A methodology<br />
to solve problems. A programme coordinator<br />
at the regional level links<br />
the communities with programme<br />
support structures at the national<br />
level and supervises, monitors and<br />
trains trainers. There are programme<br />
coordinators at the district level as<br />
well. Finally, back-up support for the<br />
volunteers is provided by teams of<br />
health staff from nearby health centres.<br />
A nutritional monitoring system<br />
has also been created: At the monthly<br />
weighing sessions, the volunteers fill<br />
out forms for all children, recording<br />
their age and weight. The information<br />
on the nutritional status of all the<br />
children in a village goes on the form<br />
volunteers send every month to the<br />
district health supervisor, who then reports<br />
the status of the district’s children<br />
to the regional coordinator.<br />
The tangible change for families<br />
and children in Al Dakhiliya has been<br />
so positive that the programme is<br />
being expanded to additional villages<br />
in the region and has been introduced<br />
in another five regions of<br />
the country.<br />
Photo: A woman reviews her child’s growth<br />
chart with a volunteer nutrition adviser, part<br />
of a community-based effort to promote<br />
better child nutrition in Oman.<br />
40
Dramatic results from<br />
small beginnings<br />
In villages across Tanzania, a seemingly<br />
modest process began in the<br />
early 1980s when villagers, many of<br />
them in poor and remote areas, began<br />
to track the weight of their children.<br />
With financial support from the<br />
Government of Italy and day-to-day<br />
technical support from UNICEF, the<br />
Child Survival and Development<br />
(CSD) Programme began in five districts<br />
in the Iringa region, eventually<br />
reaching more than half the population<br />
of the country.<br />
The result was the virtual disappearance<br />
of severe malnutrition —<br />
and striking reductions in mild and<br />
moderate malnutrition. The lives of<br />
thousands of children were saved.<br />
These improvements were accomplished<br />
against the backdrop of previously<br />
high mortality and malnutrition<br />
rates among young children that<br />
began to climb in Tanzania following<br />
the economic decline in the 1970s and<br />
1980s. Of crucial importance was the<br />
Government’s continued commitment,<br />
even during this difficult period,<br />
to policies worked out with the full<br />
participation of communities and<br />
families. This approach that was to<br />
prove one of the greatest strengths of<br />
the CSD Programme.<br />
A community-wide picture<br />
A major feature was community-based<br />
growth monitoring, which allowed the<br />
parents and other community members<br />
to assess the nutritional wellbeing<br />
of their own and other children<br />
in the village. The results could then<br />
be compared with figures for neighbouring<br />
villages and those throughout<br />
the country.<br />
These assessments provided a<br />
baseline at the start of the programme<br />
and were repeated every three months<br />
thereafter to follow the progress of in-<br />
dividual children. When the results<br />
for all the children in the village were<br />
added together, they provided a concrete<br />
measure of nutritional well-being<br />
and development for the whole community.<br />
These quarterly weighing sessions<br />
sparked the participation not<br />
only of fathers and mothers, but also<br />
of the whole community in analysing<br />
why children were malnourished and<br />
why some seemed to thrive while others<br />
did not.<br />
An improved understanding of the<br />
factors involved in the nutritional<br />
well-being of their children in turn<br />
helped the villagers to plan and initiate<br />
actions that would contribute to<br />
better growth and overall child health.<br />
Subsequent weighing sessions<br />
helped parents and villagers evaluate<br />
the results and effectiveness of the actions<br />
taken and consider new or modified<br />
actions. In this way, continuous<br />
cycles that combined assessment,<br />
analysis and action — the ‘triple A’<br />
approach — were established, helping<br />
spark successive nutrition improvements<br />
in the programme villages<br />
(Fig. 8; Panels 9 and 10).<br />
The steps the villagers took were<br />
aimed at increasing feeding frequency;<br />
encouraging better use of<br />
basic health services; training health<br />
workers, including skilled birth attendants<br />
and healers; improving the<br />
home treatment of diarrhoea and<br />
other illnesses; strengthening household<br />
technology to improve the porridge<br />
made for young children;<br />
reducing vitamin and mineral deficiencies;<br />
supporting activities such as<br />
small animal husbandry and home<br />
gardening; and improving sanitation.<br />
From bystanders<br />
to participants<br />
The simple tool of growth monitoring<br />
allowed the villagers to make better<br />
use of their own creativity and resources,<br />
to express their requests for<br />
Fig. 8 Better nutrition through<br />
triple A<br />
The ‘triple A’ cycle of Assessing a problem,<br />
Analysing its causes and taking Action based on<br />
this analysis can be used at all levels of society to<br />
create processes whereby people's right to good<br />
nutrition is fulfilled.<br />
Action<br />
Source: UNICEF, 1997.<br />
Assessment<br />
Analysis<br />
41
Panel 10<br />
Celebrating gains in children’s health in Brazil<br />
Residents of the Morro de Céu<br />
slum in Rio de Janeiro normally<br />
have little time for celebrations.<br />
But on a recent Saturday<br />
afternoon, 40 mothers, their children<br />
and community leaders affiliated with<br />
the Brazilian Child Pastorate gathered<br />
under the trees outside a parish<br />
hall. The community leaders set the<br />
children one by one on a scale, recording<br />
their weight in notebooks<br />
and consulting with the mothers on<br />
any nutrition or health problems. The<br />
weighing over, the occasion turned<br />
festive. Community leaders brought<br />
out trays of home-baked cakes and<br />
cookies; the yard filled with conversation<br />
and laughter and the happy<br />
shrieks of children at play.<br />
The Child Pastorate’s success in<br />
protecting the health and development<br />
of poor children in Brazil is definitely<br />
cause for celebration. The<br />
Pastorate estimates that in the communities<br />
where the programme is in<br />
place, the malnutrition rate among<br />
children under five does not exceed<br />
E. Mack<br />
8 per cent, compared to 16.3 per cent<br />
nationally as found in a 1996 Demographic<br />
and Health Survey applying<br />
the same criteria*. Additionally, the<br />
Child Pastorate estimates that the incidence<br />
of low birthweight babies is<br />
6 per cent in communities it assists,<br />
while the incidence is 9.2 per cent<br />
nationally.<br />
The Child Pastorate is one of the<br />
largest NGOs in the world devoted to<br />
child health, nutrition and development.<br />
Its aim is to empower the poor<br />
both to improve their children’s lives<br />
and to participate in transforming<br />
their communities and their country.<br />
The National Conference of Brazilian<br />
Bishops founded the NGO in<br />
1983, with efforts beginning in one<br />
community in Paraná state. Now the<br />
Child Pastorate operates in 22,000<br />
communities, in cities large and small,<br />
as well as in rural areas, and serves<br />
2.1 million families, including over 3.1<br />
million children under the age of six<br />
and nearly 144,000 pregnant women.<br />
The Pastorate’s nearly 83,000 community<br />
volunteers, mainly women,<br />
are the backbone of the programme,<br />
working directly with 10 to 20 families<br />
in their neighbourhoods. “They<br />
are like shepherds, looking after their<br />
communities,” says Dr. Zilda Arns<br />
Neumann, a paediatrician and the<br />
national coordinator of the NGO since<br />
its inception. Community leaders are<br />
trained in basic child and maternal<br />
nutrition and health skills, including<br />
monitoring growth, tracking immunizations,<br />
supporting breastfeeding,<br />
treating diarrhoea with oral rehydration<br />
therapy (ORT) and preventing<br />
and detecting pneumonia.<br />
The Pastorate makes nutrition a<br />
community issue: Families get help,<br />
* Percentage of children below the 10th percentile<br />
of the National Center for Health Statistics<br />
(US) reference weight-for-age standard.<br />
encouragement and support from<br />
neighbours in improving their children’s<br />
well-being. Community leaders<br />
visit the homes of children who<br />
are malnourished, monitoring their<br />
weight frequently and referring families<br />
to local health facilities if necessary.<br />
They screen pregnant women<br />
for indications of malnutrition and<br />
refer them to medical facilities for<br />
prenatal care and delivery, and after<br />
birth, support for breastfeeding is a<br />
main priority. Families also learn<br />
how to prepare nutritious meals with<br />
low-cost ingredients that are available<br />
locally. The Pastorate promotes<br />
child development through play and<br />
activities to improve speech and<br />
motor skills; its basic education programme<br />
serves 46,000 teenagers<br />
and adults.<br />
The Child Pastorate’s work is<br />
guided by a four-part methodology.<br />
The first three — ‘see’ (observe the<br />
situation), ‘judge’ (define the causes)<br />
and ‘act’ (take action based on the<br />
causes) — are similar to UNICEF’s<br />
triple A approach. The fourth is ‘celebrate’<br />
(rejoice in the gains made in<br />
children’s nutrition and health).<br />
The Child Pastorate uses its partnerships<br />
— with the Government at<br />
all levels, with other NGOs and with<br />
the media — to maximum effect,<br />
planning budget and activities to<br />
complement those of the Ministry of<br />
Health. It works through municipal<br />
councils to help maintain public services<br />
in communities, from the quality<br />
of tap water to health services to<br />
education.<br />
The broadcast media are strong<br />
allies. Nutrition and health messages<br />
developed by the Child Pastorate are<br />
aired on a 15-minute radio programme,<br />
Viva a Vida (Enjoy Life),<br />
once or twice a week by 910 radio<br />
stations. Since 1995, the Child Pas-<br />
42
torate has received about one quarter<br />
of the proceeds of the annual<br />
fund-raising television campaign<br />
‘Criança Esperança’ (Child Hope),<br />
sponsored by UNICEF and Globo<br />
TV, to assist municipalities with<br />
high infant mortality rates throughout<br />
the country. The Pastorate estimates<br />
that in the campaign’s<br />
first year, malnutrition declined<br />
by 14 per cent in the municipalities<br />
featured on the programme.<br />
The Child Pastorate is able to<br />
operate at low cost, in part because<br />
of the considerable efforts<br />
of its volunteers and the logistical<br />
net provided by the Catholic<br />
Church. Training, transportation<br />
and other support for the programme’s<br />
community leaders are<br />
among the main expenses. The<br />
Child Pastorate received assistance<br />
from UNICEF in its early<br />
years. Since 1987, the Brazilian<br />
Ministry of Health has provided<br />
support, with additional funds<br />
raised from the private sector.<br />
external support more clearly and to<br />
become less dependent on such support.<br />
One thing the Tanzanian CSD<br />
Programme did not do was increase<br />
the production or availability of basic<br />
food. While food is obviously essential<br />
for good nutrition, the success of<br />
the Tanzanian approach suggested<br />
that an overall lack of food at the<br />
household level was not the major<br />
cause of malnutrition in young children<br />
and pregnant women in the villages.<br />
Less tangible, but singularly<br />
important, was the transformation that<br />
many communities underwent. From<br />
passively enduring economic decline<br />
and marginalization, villagers became<br />
active participants for change, formulating<br />
and carrying out policies that<br />
led to better lives for their children<br />
and themselves. A major feature of<br />
this transformation was the emergence<br />
of women as central players,<br />
making decisions at both the community<br />
and household levels, with local<br />
support in the form of start-up financing<br />
for their income-generating activities.<br />
Two other factors underpinned<br />
the success of the programme: universal<br />
education, including adult education,<br />
and a high level of political<br />
mobilization in Tanzanian villages<br />
that provided an organized system of<br />
communication.<br />
When women are respected and manage<br />
resources in a community, their own and<br />
their children’s nutritional status improves.<br />
Women in Bangladesh gain experience<br />
through their own small businesses.<br />
UNICEF/97-0277/Noorani<br />
Photo: In Brazil, Child Pastorate<br />
volunteers weigh a young girl during<br />
a growth monitoring session.<br />
Despite setbacks,<br />
durable progress<br />
The Tanzanian experience was hardly<br />
perfect. When decisions are made<br />
through a repetitive, collective process,<br />
false starts and mistakes are inevitable.<br />
Gains also have been difficult<br />
to sustain in some areas. But durable<br />
progress has been made: Communities<br />
have actively taken up the fight<br />
against malnutrition, and they have<br />
collected and analysed information<br />
themselves. The sense of power and<br />
commitment gained through such a<br />
process is not quickly relinquished.<br />
43
Panel 11<br />
Rewriting Elias’s story in Mbeya<br />
My name is Elias. I am two-and-a-half years old and I live on the outskirts of<br />
Mbeya with my mother, father, two older brothers and an older sister.<br />
We are poor and our house has no toilet. My mother gets up early to fetch<br />
water from the river since our house has no tap. Then she goes to her farm<br />
plot, leaving me with my sister, Sophia, who is seven. Sophia collects firewood<br />
and does other chores for my mother, so she doesn’t have much time<br />
to spend with me.<br />
When my mother returns from her plot, she cooks a meal, usually maize<br />
porridge. Last year my mother grew enough maize, but this year she had to<br />
sell some to get money to buy other things. Now she says she doesn’t know<br />
what we will eat when our maize stock runs out.<br />
When I was younger, my mother breastfed me. Since she stopped, I have<br />
often been ill with fevers and diarrhoea. When I last had a fever, the nurse at<br />
the dispensary said it was probably malaria. My mother bought medicine but<br />
I didn’t get better. Now I feel very ill and I don’t have much energy.<br />
Elias’s story is a cautionary tale<br />
of how poor sanitation, the cessation<br />
of breastfeeding, disease<br />
and poverty converge all too often in<br />
malnutrition or even death for young<br />
children. The Health and Nutrition<br />
District Support (HANDS) project is<br />
helping people in Mbeya, a large<br />
urban centre in south-west Tanzania,<br />
rewrite this tale with a healthier,<br />
— From a drama staged by HANDS’ community organizers<br />
happier ending for their children.<br />
Launched by the Tanzanian Government<br />
in 1992 with support from the<br />
United Kingdom Overseas Development<br />
Administration, HANDS’ success<br />
has been impressive.<br />
Moderate malnutrition in children<br />
fell to 22 per cent in 1995 from<br />
33 per cent in 1992, and severe malnutrition<br />
dropped to 0.4 per cent<br />
Gilles Vauclair<br />
from 3.3 per cent in areas where<br />
HANDS operates. In contrast, malnutrition<br />
increased by 7 percentage<br />
points among children under five in<br />
Mbeya as a whole.<br />
In the same period, in HANDS’<br />
areas, the percentage of pregnant<br />
women with anaemia declined from<br />
37 per cent to 33 per cent, and the incidence<br />
of low birthweight was also<br />
reduced. Ninety-nine per cent of children<br />
between the ages of one and<br />
five were fully vaccinated, up from 86<br />
per cent. The proportion of households<br />
with access to safe water increased<br />
from 60 to 96 per cent, and<br />
those with pit latrines from 75 to 92<br />
per cent. In all, about 125,000 people<br />
benefited directly and indirectly.<br />
An important strategy of HANDS<br />
lies in careful targeting: The project<br />
focuses on areas with the highest<br />
levels of child malnutrition and infectious<br />
diseases, lowest levels of domestic<br />
sanitation and most limited<br />
access to health facilities. Equally important,<br />
the community has been intimately<br />
involved, from planning<br />
through implementation and management,<br />
with evaluation. The poor<br />
identified their priorities and became<br />
partners with government staff in<br />
implementing a range of healthenhancing<br />
development activities.<br />
Donor support has been critical in<br />
providing training, essential equipment<br />
and transport. An investment<br />
was also made in council and community<br />
development funds, enabling<br />
the council to improve health services<br />
and access to safe water, upgrade<br />
sanitation and promote household<br />
hygiene in targeted areas.<br />
Revitalized maternal and child<br />
health services in the community<br />
now are responsible for child vaccination,<br />
antenatal and post-natal care,<br />
family planning, diarrhoeal disease<br />
44
control, treatments for common<br />
childhood illnesses and growth<br />
promotion activities. Health and<br />
nutrition education activities are<br />
stronger and focus on children’s<br />
vulnerability during the period<br />
when complementary foods are<br />
being introduced, on the nutritional<br />
needs of pregnant women<br />
and on home-based oral rehydration<br />
therapy. Outreach services<br />
now support households with<br />
malnourished children, and community-based<br />
day-care centres<br />
have improved the well-being of<br />
young children.<br />
Four new water schemes serve<br />
over 50,000 people, and three<br />
health centres were upgraded,<br />
now reaching 80,000 people. Affordable<br />
latrines and basic hygiene<br />
are promoted, and innovative work<br />
is being done on low-cost public<br />
toilets.<br />
Thanks to seminars, formal<br />
training and drama sessions run<br />
by Tanzanian women lawyers, the<br />
rights of women and children are<br />
higher on the public agenda. A<br />
subsequent survey found that fathers<br />
are making greater contributions<br />
to child welfare.<br />
The HANDS project is now in a<br />
second phase: Tanzanians have<br />
replaced international staff, and<br />
project management lies with<br />
local council committees. The<br />
commitment and participation of<br />
local government staff and community<br />
members indicate that the<br />
project is sustainable.<br />
Photo: As one way to improve child<br />
nutrition and maternal health, the<br />
HANDS project has brought safe water<br />
and sanitation to thousands of people.<br />
Women and their children in Tanzania.<br />
About 10 years after the first successes<br />
in Iringa were reported, a comparable<br />
approach is now achieving<br />
very similar results in Mbeya, another<br />
part of Tanzania (Panel 11). Virtually<br />
the same community-based approach<br />
that had proven successful in Iringa<br />
and elsewhere in Tanzania was introduced<br />
in Mbeya. The improvement in<br />
the nutritional status of children there,<br />
again carefully monitored and documented,<br />
independently confirms the<br />
validity of this approach.<br />
Nor is the community learning approach<br />
used in Tanzania by any<br />
means unique. In the heart of the<br />
Sahel, villagers in the Maradi region<br />
of Niger, with support from UNICEF<br />
and bilateral donors, have also begun<br />
to record their children’s weight on a<br />
regular basis. These villagers face<br />
many obstacles that communities in<br />
Tanzania did not have — little rainfall<br />
and a very short growing season,<br />
much less experience with participatory<br />
development, less support from<br />
the central level and a history of<br />
village-level decision-making that explicitly<br />
excluded women. But malnutrition<br />
has been significantly reduced,<br />
and the scale of their activities seems<br />
on track to rival that of Tanzania<br />
(Panel 12).<br />
In Thailand,<br />
another success story<br />
On the other side of the globe, Thailand<br />
has achieved stunning improvements<br />
in the nutrition of millions of<br />
its children through a combination of<br />
approaches, aided by a booming economy.<br />
The Thai Government estimates<br />
that malnutrition of under-five children<br />
fell from about 51 per cent in<br />
1982 (measured as a proportion of<br />
underweight children) to about 19 per<br />
cent in 1990, and that severe malnutrition<br />
virtually disappeared during<br />
that period. At the local level, growth<br />
Thailand has achieved<br />
stunning improvements in<br />
the nutrition of millions of<br />
its children through a<br />
combination of approaches,<br />
aided by a booming economy.<br />
45
Panel 12<br />
Women in Niger take the lead against malnutrition<br />
Better seeds and fertilizer, a<br />
diesel-powered mill and two<br />
donkey carts: With these modest<br />
improvements, women in Kwaren<br />
Tsabre, a village in central Niger, are<br />
lessening their workloads and beginning<br />
to overcome the widespread<br />
malnutrition threatening their children.<br />
The problems seemed intractable<br />
just a few years ago. Over half the<br />
young children in the village of 680<br />
inhabitants were underweight, and<br />
many showed signs of serious vitamin<br />
A deficiency—which can lead to<br />
blindness and death.<br />
Progress is being made thanks to<br />
a close partnership between the<br />
community and district-based government<br />
agents, founded on the people’s<br />
own assessment and analysis of<br />
their situation. The problems were<br />
acute: As in many villages in the<br />
heart of the Sahel region in West<br />
Africa, Kwaren Tsabre experienced<br />
chronic shortages of staple foods;<br />
diets lacked richness and diversity;<br />
UNICEF/93-1973/Pirozzi<br />
women were grossly overworked<br />
and had little access to education and<br />
information; and health services were<br />
remote and often of poor quality.<br />
Because women were most seriously<br />
and directly affected, it was<br />
necessary to put them at the centre<br />
of decision-making and have them<br />
benefit from the new initiatives. A<br />
women’s group — the Village Women’s<br />
Committee — was formed,<br />
with members trained by government<br />
agents in the district. The first<br />
step, as Zouera, the first President of<br />
the Committee, explained, was to<br />
identify actions that could bring<br />
about measurable improvements in<br />
nutrition.<br />
“We realized that because our<br />
workdays were so long — between<br />
14 and 17 hours — we couldn’t care<br />
for our children as well as we wanted<br />
to,” she said. Getting a loan for a<br />
diesel mill to relieve the women of<br />
the arduous task of hand-pounding<br />
sorghum and millet was one response.<br />
Another was to purchase<br />
two donkey carts to reduce the hours<br />
spent carrying wood and water. Both<br />
mill and carts save time and generate<br />
income: The villagers of Kwaren<br />
Tsabre and their neighbours from<br />
miles around agreed to pay modest<br />
fees to grind grain and use the carts.<br />
With technical help, better irrigation<br />
and improved seeds and fertilizer,<br />
staple crop yields have nearly<br />
tripled and new vitamin A-rich foods<br />
are also being produced, including<br />
amaranth and baobab leaves. The<br />
women incorporated these vitamin A<br />
sources and small amounts of oil<br />
into their usual meals and soon<br />
began noticing a decrease in nightblindness<br />
(a symptom of vitamin A<br />
deficiency) among their children.<br />
Women in neighbouring villages<br />
have reported that night-blindness<br />
has also been reduced among pregnant<br />
women.<br />
Zouera and her colleagues in the<br />
Committee also decided, in consultation<br />
with government technical staff,<br />
to set up a cooperative cereal bank.<br />
This bank purchases and stores grain<br />
safely after the harvest and gives<br />
poor families a place to buy grain at<br />
reasonable prices during pre-harvest<br />
seasons, when they cannot afford<br />
the market price.<br />
In a short time, the cereal bank<br />
paid for itself and even turned a<br />
profit. “With this money we’re subsidizing<br />
other activities, such as the<br />
distribution of peanut butter as a<br />
complementary food for very young<br />
children who are still breastfeeding,”<br />
Zouera said. The Committee also<br />
gives a small cash bonus to the<br />
women who supervise the regular<br />
growth monitoring of children. The<br />
monitoring enables women to see<br />
for themselves what is happening<br />
with their children, and they can use<br />
46
the information to analyse and act<br />
on problems in their own homes<br />
and community.<br />
Children’s malnutrition rates in<br />
Kwaren Tsabre have fallen by<br />
10 percentage points in a short<br />
time between 1995 and 1996. And<br />
this is only the beginning. Poorquality<br />
and inaccessible health<br />
services are still a problem and an<br />
impediment to further gains against<br />
malnutrition.<br />
But the women of Kwaren<br />
Tsabre now know that they have<br />
the tools and a process for addressing<br />
even that difficult problem<br />
with the help of their partners.<br />
Multiply the achievements of<br />
Kwaren Tsabre by the 326 villages<br />
across the Maradi Province of<br />
Niger into which this programme<br />
has spread, and one begins to see<br />
victory emerging in the age-old<br />
battle against child malnutrition.<br />
Photo: Long hours spent carrying water<br />
and fuel and other arduous work<br />
drastically reduce women’s time to care<br />
for their children. Cooperative efforts<br />
help reduce the burden. Members of an<br />
agricultural cooperative in Niger build<br />
a terrace to prevent soil erosion.<br />
monitoring and promotion (GMP)<br />
coverage increased nationwide from<br />
about 1 million children to about 2.6<br />
million.<br />
GMP was combined with supplementary<br />
feeding activities in some locations.<br />
In addition to this increased<br />
attention to nutrition, a number of<br />
policy and programme measures contributed<br />
to reducing malnutrition and<br />
poverty. Targeted to poorer regions,<br />
these included: school lunch programmes;<br />
surveillance of ‘basic minimum<br />
needs’ indicators; village-level<br />
planning to ensure that priority needs<br />
were met; rural job creation; and<br />
support for small-scale food producers.<br />
Community participation, in varying<br />
degrees, was part of all Thai<br />
programmes.<br />
There is general recognition that<br />
more needs to be done in Thailand,<br />
but these remarkable gains are a solid<br />
foundation for the future.<br />
Protecting, promoting<br />
and supporting<br />
breastfeeding<br />
Virtually all of the community-based<br />
programmes that have resulted in reductions<br />
in malnutrition have focused<br />
on improvements in infant feeding,<br />
especially the protection, promotion<br />
and support of breastfeeding.<br />
While community-based support<br />
for breastfeeding is a major achievement,<br />
even the efforts of communities<br />
well aware of the central importance<br />
of breastfeeding can be foiled by<br />
larger economic and institutional<br />
pressures.<br />
The blitz of inappropriate advertising<br />
and promotion by manufacturers<br />
of breastmilk substitutes — mostly<br />
infant formula — has been a central<br />
challenge in the fight to protect and<br />
promote breastfeeding. While infant<br />
formula is an important product for<br />
the minority of children who for some<br />
47
Keeping babies close to their mothers is<br />
fundamental in a baby-friendly hospital.<br />
A mother and child in Brazil ‘room in’.<br />
UNICEF/5770/Sprague<br />
reason are not, or cannot be, breastfed,<br />
sales and promotional activities<br />
around it have sometimes been based<br />
on untrue claims of its value compared<br />
with that of breastmilk.<br />
Promotional activities, such as<br />
providing free or subsidized supplies<br />
of infant formula, bottles and teats in<br />
maternity wards, have also undermined<br />
the best intentions and the confidence<br />
of new mothers to breastfeed.<br />
In 1981, the World Health Assembly,<br />
which consists of the health<br />
ministers of almost all countries, responded<br />
vigorously to inappropriate<br />
promotional efforts of the infant-food<br />
industry by adopting the International<br />
Code of Marketing of Breastmilk<br />
Substitutes, drafted by WHO, UNICEF,<br />
NGOs and representatives of the infant<br />
food industry. 2<br />
The Code establishes minimum<br />
standards to regulate marketing practices<br />
by setting out the responsibilities<br />
of companies, health workers, governments<br />
and others and provides<br />
standards for the labelling of breastmilk<br />
substitutes. Among its provisions<br />
are that health facilities must<br />
never be involved in the promotion of<br />
breastmilk substitutes and that free<br />
samples should not be provided to<br />
pregnant women or new mothers.<br />
Progress has been relatively slow<br />
in translating the Code’s minimum<br />
provisions into national laws. As of<br />
September 1997, only 17 countries<br />
had approved laws that put them into<br />
full compliance with the Code. Training<br />
and development of model legislation<br />
are now accelerating action in<br />
this area. Support from the Government<br />
of Sweden has enabled UNICEF<br />
to provide greater technical assistance<br />
on Code implementation and other<br />
legal aspects of breastfeeding support.<br />
A recent report, Cracking the<br />
Code, by the Interagency Group on<br />
Breastfeeding Monitoring, based in<br />
the United Kingdom, highlights the<br />
work that remains to be done. It documents<br />
widespread violations of the<br />
Code by multinational companies in<br />
four countries: Bangladesh, Poland,<br />
South Africa and Thailand.<br />
The Baby-Friendly<br />
Hospital Initiative<br />
As a complement to communitybased<br />
efforts to protect, promote and<br />
support breastfeeding and to promulgate<br />
the Code, UNICEF and WHO in<br />
1991 began an intensive effort to transform<br />
practices in maternity hospitals.<br />
The Baby-Friendly Hospital Initiative<br />
(BFHI), as the effort is called,<br />
brought a structured programme to<br />
breastfeeding support and, in just six<br />
years, has helped transform over 12,700<br />
hospitals in 114 countries into centres<br />
of support for good infant feeding.<br />
These baby-friendly hospitals are<br />
havens of protection for breastfeeding,<br />
where women and children are<br />
not subject to advertising and promotional<br />
activities for infant formula or<br />
feeding bottles, and where they can<br />
receive effective and well-informed<br />
help for a sound start to breastfeeding.<br />
BFHI has a simple but thorough<br />
approach. Through a WHO-UNICEF<br />
training programme that has been<br />
translated into the official languages<br />
of the United Nations and into many<br />
others, the professional staffs of maternity<br />
hospitals are trained in lactation<br />
management and support. Staff<br />
members, along with the directors or<br />
managers of their health facility, make<br />
a commitment to fulfil the initiative’s<br />
‘Ten steps to successful breastfeeding’(see<br />
sidebar). These include pledging<br />
to ensure that women and newborns<br />
can remain together all the time<br />
and that women must be free to begin<br />
breastfeeding promptly after birth and<br />
to continue exclusive breastfeeding<br />
on demand during their hospital stay.<br />
Step 10 calls for setting up breastfeeding<br />
support groups that new mothers<br />
48
Spotlight<br />
can rely on. Hospitals can be awarded<br />
‘baby-friendly’ status only when specially<br />
trained independent evaluators<br />
have ensured that all 10 steps are met.<br />
It is hard to overestimate the success<br />
of BFHI. More than a million<br />
people are working to implement its<br />
programme, and the overall pace of<br />
hospital certifications has not slowed.<br />
Patterns of declining breastfeeding,<br />
particularly in urban areas, have been<br />
reversed in country after country<br />
following BFHI implementation<br />
(Panel 13).<br />
The success of the initiative can<br />
also be measured in the health of<br />
young children. In Panama, the Ministry<br />
of Health reported a 58 per cent<br />
reduction in respiratory infections and<br />
a 15 per cent decline in diarrhoea in<br />
infants in just one year in a single<br />
baby-friendly facility, the Amador<br />
Guerrero Hospital. In north-eastern<br />
Brazil, Acari Hospital credits BFHI<br />
with dramatic cost savings from decreased<br />
hospitalization of infants and<br />
reduced case fatality among them. In<br />
the first two years of BFHI implementation<br />
at the Central Hospital of<br />
Libreville in Gabon, it was estimated<br />
that there was a 15 per cent reduction<br />
in cases of neonatal diarrhoea, a 14<br />
per cent reduction in dehydration and<br />
an 8 per cent reduction in mortality.<br />
❑<br />
Successes outside the<br />
developing world<br />
BFHI is not just for non-industrialized<br />
countries.<br />
An evaluation in the Republic of<br />
Moldova, once part of the former<br />
Soviet Union near the Romanian border,<br />
showed an average reduction in<br />
all neonatal infections in four babyfriendly<br />
hospitals from about 18 per<br />
cent to 7.5 per cent in two years of the<br />
programme. The neonatal infection<br />
rate in the hospital that had been certified<br />
as baby-friendly the longest<br />
dropped from 23 per cent to 3.4 per<br />
cent. Rates of breastfeeding initiation<br />
in the country rose appreciably, and<br />
rates of continued breastfeeding at 6<br />
and 12 months were significantly<br />
higher over the period of implementation<br />
of the programme.<br />
Similar results are being reported<br />
from Asia and Latin America, and<br />
some countries are in the process of<br />
conducting extensive evaluations of<br />
BFHI’s impact. In the United States,<br />
there is an active BFHI programme,<br />
and 11 hospitals have been declared<br />
baby-friendly.<br />
BFHI was conceived by a small<br />
group of experts with vision and leadership<br />
and was tested, modified and<br />
then introduced globally. But it could<br />
not have succeeded without the engagement<br />
of local institutions and<br />
communities. Local NGOs have played<br />
a significant role in the promotion and<br />
sustenance of BFHI in many countries.<br />
And an international NGO, the<br />
World Alliance for Breastfeeding Action<br />
(WABA), founded in 1991, has<br />
helped solidify actions in support of<br />
the initiative and breastfeeding beyond<br />
the hospital through its work in networking,<br />
information sharing and advocacy.<br />
National breastfeeding committees,<br />
though often established prior to<br />
BFHI, were energized by the initiative’s<br />
concrete achievements. Paediatric<br />
and obstetric professional associations<br />
have endorsed the programme<br />
and have been educated by it.<br />
BFHI has also helped establish<br />
breastfeeding firmly on the political<br />
agenda. The challenge for the future<br />
is to use the political energy behind<br />
BFHI to ensure that breastfeeding<br />
promotion and support extend beyond<br />
hospital walls and that breastfeeding<br />
support groups become a constant priority<br />
for communities and governments.<br />
❑ Complementing breastfeeding<br />
Good infant feeding includes not only<br />
support for breastfeeding but also en-<br />
TEN STEPS TO<br />
SUCCESSFUL<br />
BREASTFEEDING<br />
Every facility providing maternity services<br />
and care for newborn infants should:<br />
1. Have a written breastfeeding policy<br />
that is routinely communicated to all<br />
health care staff.<br />
2. Train all health care staff in skills<br />
necessary to implement this policy.<br />
3. Inform all pregnant women about the<br />
benefits and management of breastfeeding.<br />
4. Help mothers initiate breastfeeding<br />
within a half-hour of birth.<br />
5. Show mothers how to breastfeed<br />
and how to maintain lactation even<br />
if they should be separated from<br />
their infants.<br />
6. Give newborn infants no food or<br />
drink other than breastmilk, unless<br />
medically indicated.<br />
7. Practise rooming-in — allow mothers<br />
and infants to remain together<br />
— 24 hours a day.<br />
8. Encourage breastfeeding on demand.<br />
9. Give no artificial teats or pacifiers<br />
(also called dummies or soothers) to<br />
breastfeeding infants.<br />
10. Foster the establishment of breastfeeding<br />
support groups and refer<br />
mothers to them on discharge from<br />
the hospital or clinic.<br />
In addition, facilities should refuse to accept<br />
free and low-cost supplies of breastmilk<br />
substitutes, feeding bottles and<br />
teats.<br />
— From Protecting, Promoting and Supporting<br />
Breastfeeding: The special role of maternity services;<br />
A Joint WHO/UNICEF Statement (WHO, 1989) and<br />
‘The Global Criteria for the WHO/UNICEF Baby-<br />
Friendly Hospital Initiative’ (UNICEF, 1992)<br />
49
Panel 13<br />
BFHI: Breastfeeding breakthroughs<br />
Smiling at her infant in her arms,<br />
Elba Diaz awaits Juanito’s<br />
six-month check-up at a primary<br />
health care centre in southern<br />
Santiago. Her third child draws nothing<br />
but compliments from health<br />
workers, unlike Ms. Diaz’s first two<br />
children, who were not so healthy.<br />
The difference is that Juanito — born<br />
at the Barros Luco Hospital, one of 19<br />
baby-friendly hospitals in Chile — is<br />
the only child she has been able to<br />
breastfeed exclusively.<br />
“Immediately after Juanito was<br />
born,” recalls Ms. Diaz, “he was laid<br />
on my body. Words can’t describe<br />
how blissful I was, feeling his<br />
warmth and looking at his flushed<br />
face so close to me. I began nursing<br />
him at the breast while we were still<br />
in the delivery room, and he was beside<br />
me always, receiving only my<br />
breastmilk.”<br />
In Chile, breastfeeding support<br />
and counselling for mothers have led<br />
to enormous health benefits for tens<br />
of thousands of children like Juanito<br />
in little more than a decade. In 1985,<br />
only 4 per cent of infants were exclusively<br />
breastfed for the first six<br />
months of their lives. Remarkably,<br />
only a year after the Baby-Friendly<br />
Hospital Initiative (BFHI) was launched<br />
in 1991, a study of 9,200 infants nationwide<br />
showed that the rate had<br />
risen to 25 per cent. And preliminary<br />
results of a national survey in 1996<br />
suggest that the exclusive breastfeeding<br />
rate for the first six months is<br />
now about 40 per cent.<br />
What lies behind this transformation?<br />
Training is an important part of<br />
the answer. With support from the<br />
NGO Wellstart International and<br />
UNICEF, training materials were<br />
adapted, and in just four years over<br />
7,500 health workers learned to help<br />
women breastfeed effectively. Strong<br />
support from the Ministry of Health<br />
was another factor, and UNICEF provided<br />
sustained advocacy. The National<br />
Breastfeeding Commission,<br />
UNICEF/93-1718/Lemoyne<br />
organized in 1992, has also kept<br />
breastfeeding high on Chile’s child<br />
health agenda.<br />
Another effective measure was<br />
expanding ‘baby-friendly’ practices<br />
into primary health care centres,<br />
where trained staff offer breastfeeding<br />
education and support. “The staff<br />
acquainted me with breastfeeding<br />
during my pregnancy,” said one<br />
mother. “The first week after delivery,<br />
I joined a group session at the<br />
clinic to share my concerns with<br />
other breastfeeding mothers. I feel<br />
very secure, having easy access to<br />
professional advice on any breastfeeding<br />
questions.”<br />
These achievements in Chile have<br />
been replicated across the world<br />
through BFHI and related efforts. In<br />
Cuba, only about 63 per cent of newborns<br />
were breastfed exclusively at<br />
the time they left the hospital in 1990.<br />
Now, six years after BFHI was introduced,<br />
an estimated 98 per cent of<br />
newborns are exclusively breastfed<br />
when they leave the maternity ward.<br />
And more strikingly, about 72<br />
per cent of those infants are exclusively<br />
breastfed through four months<br />
of age, up from 25 per cent in 1990.<br />
All 44 hospitals handling over 1,000<br />
deliveries a year and 42 per cent of<br />
smaller hospitals in the country are<br />
baby-friendly. In 1996, Cuba extended<br />
the baby-friendly programme<br />
to the community level by putting it<br />
into practice at small community<br />
health centres attended by family<br />
doctors.<br />
On the other side of the globe,<br />
China had over 6,300 baby-friendly<br />
hospitals at the end of 1996. Thanks<br />
to BFHI and some regulation of the<br />
marketing of breastmilk substitutes,<br />
48 per cent of infants in urban areas<br />
and 68 per cent in rural areas are<br />
now exclusively breastfed for four<br />
50
months, a 1994 survey found. Just<br />
two years earlier, the rates were<br />
10 and 29 per cent respectively.<br />
Considering that about 20 million<br />
infants are born each year in<br />
China, this represents a remarkable<br />
accomplishment.<br />
Iran, which began promoting<br />
breastfeeding in the 1980s, has<br />
held training workshops for over<br />
30,000 health professionals each<br />
year between 1991 and 1996 after<br />
BFHI was introduced. The national<br />
support has led to a leap in the exclusive<br />
breastfeeding rate from 10<br />
to 53 per cent in that period. An<br />
added windfall is the more than<br />
$50 million that the country saves<br />
annually, as infant formula imports<br />
dropped by 75 per cent from<br />
48 million tins in 1991 to 12 million<br />
in 1996.<br />
Because of the many benefits<br />
of breastfeeding since BFHI<br />
started, it is impossible to calculate<br />
the lives saved and those<br />
made better — though they certainly<br />
number in the millions. It is<br />
difficult to imagine any other way<br />
in which these results could have<br />
been achieved so effectively and<br />
in such a short time. Baby-friendly<br />
hospitals have surely made the<br />
world a friendlier place for babies<br />
and their families.<br />
Photo: A woman breastfeeds her newborn<br />
at a hospital in China. BFHI has increased<br />
breastfeeding rates significantly in the<br />
country.<br />
suring good complementary feeding<br />
practices for children more than six<br />
months old whose nutritional needs<br />
can no longer be fully met by breastfeeding,<br />
though sustained breastfeeding<br />
well into the second year of life<br />
remains important (Panel 14).<br />
The CSD Programme in Tanzania<br />
brought about a number of significant<br />
improvements in household-level preparation<br />
of good-quality complementary<br />
foods, including porridges with<br />
reduced viscosity designed to increase<br />
consumption by young children.<br />
Until recently, however, there has<br />
not been good scientific consensus on<br />
a number of questions related to the<br />
additional food needs of older breastfed<br />
children. WHO and UNICEF recently<br />
brought together a group of<br />
internationally renowned scientists<br />
and programme practitioners familiar<br />
with these problems, and a consensus<br />
report will soon be published that will<br />
offer technical guidance for improving<br />
complementary feeding.<br />
Tackling specific<br />
nutritional deficiencies<br />
In assessing nutrition problems and<br />
implementing programmes to attack<br />
them, it is not possible to separate<br />
protein-energy malnutrition from vitamin<br />
and mineral deficiencies. Integrated<br />
community-based programmes<br />
that have achieved reductions in overall<br />
malnutrition have usually done so<br />
by addressing both micronutrient and<br />
protein-energy deficiencies. But among<br />
the kinds of malnutrition identified at<br />
the 1990 World Summit for Children,<br />
progress has been more rapid in reducing<br />
some deficiencies than others.<br />
Grains of salt: Reducing<br />
iodine deficiency disorders<br />
The reduction in iodine deficiency,<br />
the world’s leading cause of preventable<br />
mental retardation, is a global<br />
The reduction in iodine<br />
deficiency, the world’s<br />
leading cause of preventable<br />
mental retardation, is a<br />
global success story by<br />
any standard.<br />
51
Panel 14<br />
Tackling malnutrition in Bangladesh<br />
Anew project in Bangladesh<br />
is helping to reduce malnutrition<br />
among children and<br />
mothers by improving caring practices,<br />
supporting breastfeeding<br />
and empowering women and their<br />
communities.<br />
Some 56 per cent of Bangladeshi<br />
children under five suffer from moderate<br />
and severe malnutrition, 21<br />
per cent of whom are severely underweight,<br />
and studies show that more<br />
than 70 per cent of pregnant and<br />
breastfeeding women are also malnourished.<br />
Protein-energy malnutrition<br />
is the main problem but, as often<br />
happens, it occurs together with such<br />
conditions as iron deficiency anaemia<br />
and vitamin A deficiency. In Bangladesh,<br />
lack of food is not the main<br />
cause of malnutrition; the lack of<br />
proper caring practices for children<br />
and pregnant women is an important<br />
contributing factor.<br />
Recognizing that malnutrition is<br />
hindering national development, the<br />
Government has formulated a National<br />
Nutrition Policy and launched<br />
a nationwide nutrition intervention<br />
programme, the Bangladesh Integrated<br />
Nutrition Project. The initiative<br />
aims to address malnutrition<br />
directly and help promote faster<br />
socio-economic development.<br />
Community nutrition promoters<br />
are the backbone of the project.<br />
Earning about $12 a month, they are<br />
trained for two months, including<br />
one month on the job. They learn<br />
how to understand the causes and<br />
signs of malnutrition and techniques<br />
for its treatment and prevention.<br />
They canvass their communities,<br />
persuading mothers to bring their<br />
children to the Community Nutrition<br />
Centres for monthly weighing and<br />
growth monitoring, and explaining<br />
the importance of child care, including<br />
children’s needs for exclusive<br />
breastfeeding in the first six months;<br />
the need for smaller, more frequent<br />
and nutritious meals up to age three;<br />
UNICEF/97-0284/Noorani<br />
and for extra feeding during and after<br />
illnesses to prevent malnutrition.<br />
Marium Begum, one of the nutrition<br />
promoters, has already started<br />
to achieve results in her village.<br />
During growth monitoring sessions<br />
at her Community Nutrition Centre,<br />
situated in one of the homes in her<br />
village, Ms. Begum could see that<br />
Shewli, a one-year-old girl, was suffering<br />
from severe malnutrition. Ms.<br />
Begum explained to Shewli’s mother,<br />
Shamsun, how to give her daughter<br />
a special locally made diet supplement.<br />
She also helped Shamsun to<br />
understand that she had been unable<br />
to breastfeed because she had not<br />
been eating enough herself. Following<br />
local tradition, Shamsun was<br />
accustomed to eating last, after serving<br />
food to her family, and there was<br />
often little food left. Ms. Begum<br />
explained how to re-lactate — that is,<br />
to resume lactation after it has<br />
stopped for some time — and arranged<br />
for intensive counselling at<br />
the Community Nutrition Centre.<br />
Improving the nutrition of adolescent<br />
girls and pregnant and lactating<br />
women is another priority of the project.<br />
The nutrition promoters urge<br />
women to use iodized salt in their<br />
households to prevent iodine deficiency<br />
disorders, and to use oral rehydration<br />
therapy when a child has<br />
diarrhoea to prevent dehydration.<br />
They discuss the use of vitamin A<br />
and iron supplementation.<br />
Special diet supplements are provided<br />
to malnourished women and<br />
children. Village Women’s Groups,<br />
comprising up to 11 volunteers in<br />
each community, buy ingredients for<br />
the supplement — a carefully weighed<br />
mixture of rice, lentils, molasses and<br />
oil — at local markets to prepare and<br />
package them. Each member of the<br />
group earns about $10 per month<br />
52
through the sale of packets to the<br />
nutrition centres.<br />
The Ministry of Health and<br />
Family Welfare, with the assistance<br />
of the Bangladesh Rural<br />
Advancement Committee (BRAC),<br />
has established nearly 1,000 Community<br />
Nutrition Centres in people’s<br />
homes, each operating six<br />
days a week. The centres cover<br />
65,000 children and 16,000 pregnant<br />
and lactating women. By the<br />
year 2001, the goal is to have<br />
8,000 community nutrition promoters<br />
reaching 100,000 pregnant<br />
or lactating women and 500,000<br />
children under the age of two.<br />
In the case of Shamsun, her<br />
diet has improved with the guidance<br />
and encouragement of<br />
Marium Begum. She was able to<br />
breastfeed her daughter, complementing<br />
the breastmilk with normal<br />
family food and the special<br />
dietary supplement. And instead<br />
of selling the eggs her six hens<br />
lay, she feeds them to her family.<br />
Shewli, although still small and<br />
thin, has resumed healthy growth.<br />
Photo: Better caring practices, including<br />
improved personal hygiene, are essential<br />
to reducing malnutrition. In Bangladesh,<br />
a nutrition promoter helps women who<br />
are about to feed their children to wash<br />
their hands.<br />
success story by any standard. This<br />
achievement, which began to show<br />
significant results beginning in 1992,<br />
involved a coordinated international<br />
effort to change diets in a subtle but<br />
important way — an approach that<br />
has had an impact on probably more<br />
people worldwide than any previous<br />
nutrition initiative.<br />
A diet deficient in iodine exerts its<br />
saddest and most significant effect on<br />
the developing embryo, starting at<br />
around 12 weeks after conception. Inadequate<br />
iodine results in insufficient<br />
thyroid hormone, which in turn leads<br />
to a failure of normal growth of the<br />
brain and nervous system. The result<br />
is all too often a child born with a lifetime<br />
disability.<br />
The practice of using iodized salt<br />
as a safe, cheap and effective way to<br />
combat iodine deficiency disorders<br />
(IDD) had a long track record by<br />
1992. It was introduced in Switzerland<br />
in 1922, in the United States in<br />
1924, and in the Andean countries of<br />
South America in the 1950s and 1960s.<br />
Among the goals adopted at the<br />
World Summit for Children, the virtual<br />
elimination of IDD was regarded<br />
by UNICEF as one of the most achievable.<br />
Universal salt iodization —<br />
all salt destined for both human and<br />
animal consumption — was the obvious<br />
strategy to advance the attack<br />
on IDD.<br />
Getting the job done, a continuing<br />
effort, is a process that uses the ‘triple<br />
A’ approach — assessment, analysis<br />
and action — on a global scale.<br />
In some countries, the problem of<br />
iodine deficiency was known, but rigorous<br />
assessments — using such indicators<br />
as goitre prevalence and urinary<br />
iodine excretion — were needed to<br />
convince policy makers and salt producers<br />
of the need for action. The next<br />
step was to analyse these results,<br />
along with the workings of commercial<br />
salt networks and the organi-<br />
Rapid gains in salt iodization worldwide<br />
demonstrate the effectiveness of public- and<br />
private-sector cooperation in combating<br />
nutritional deficiencies. In Bolivia, a man<br />
seals a packet of iodized salt.<br />
UNICEF/93-0479/O’Connor<br />
53
UNICEF estimates that<br />
nearly 60 per cent of all<br />
edible salt in the world is<br />
now iodized, and among<br />
countries in the world with<br />
recognized IDD problems,<br />
all but seven have passed<br />
appropriate legislation to<br />
ensure universal iodization.<br />
zation of the salt industry. Using advocacy<br />
and attention to legal detail, it<br />
was also necessary to pass appropriate<br />
legislation to ensure correct levels<br />
of salt iodization, and to protect iodized<br />
salt producers by eliminating<br />
non-iodized salt from the market.<br />
Actually getting iodine into salt<br />
supplies was another matter. The task<br />
was addressed in ways that ranged<br />
from relatively easy adaptations by<br />
resource-rich major industrial salt<br />
producers that supply whole countries,<br />
to providing support for small producers<br />
to enable them to iodize salt without loss<br />
of income. Quality control and evaluation<br />
of the impact of salt iodization<br />
remain continuing challenges. Thanks<br />
to support from many quarters, all of<br />
these steps have been realized in a<br />
short time in an extraordinary number<br />
of countries. UNICEF estimates that<br />
nearly 60 per cent of all edible salt in<br />
the world is now iodized, and among<br />
countries in the world with recognized<br />
IDD problems, all but seven<br />
have passed appropriate legislation to<br />
ensure universal iodization.<br />
Of the countries that had IDD<br />
problems in 1990, 26 now iodize over<br />
90 per cent of their edible salt or import<br />
that proportion if they are not salt<br />
producers. Another 14 countries<br />
iodize between 75 per cent and 90 per<br />
cent of their salt. As late as 1994, 48<br />
countries with established IDD problems<br />
had no programmes at all. Of<br />
these, 14 now iodize more than half<br />
their salt(Fig. 9).<br />
At the level of children and their<br />
families, these results, though still incomplete,<br />
are improving lives by the<br />
thousands. It is estimated that up until<br />
1990, about 40 million children were<br />
born each year at some risk of mental<br />
impairment due to iodine deficiency<br />
in their mothers’ diets. By 1997, that<br />
figure was probably closer to 28 million<br />
3 — still too many, but representing<br />
a clear and rapid decrease.<br />
The number of children born each<br />
year with cretinism is difficult to estimate,<br />
but in 1990 it was on the order<br />
of 120,000. It is probably about half<br />
that now.<br />
It is impossible to measure the impact<br />
of IDD on miscarriages, which<br />
are rarely well reported in health statistics,<br />
but the improvements are surely<br />
noticeable by affected women and their<br />
families. In highly iodine-deficient<br />
areas, infant mortality was long known<br />
to be elevated, but recent research now<br />
indicates that increasing the iodine intake<br />
of young infants to adequate levels<br />
may improve their survival to a far<br />
greater degree than previously expected,<br />
probably through improvements<br />
in their immune systems.<br />
The gains in salt iodization came<br />
about largely because of the work of<br />
an alliance of responsive and knowledgeable<br />
partners. WHO, in collaboration<br />
with UNICEF and the International<br />
Council for the Control of<br />
Iodine Deficiency Disorders (ICCIDD),<br />
not only helped raise awareness of the<br />
importance of IDD but also worked to<br />
ensure scientific consensus and information<br />
on standards for: levels of salt<br />
iodization, the safety of iodized salt in<br />
pregnancy, and indicators for monitoring<br />
and evaluation. UNICEF, WHO<br />
and ICCIDD also provided technical<br />
and financial support for many steps<br />
of the process.<br />
Kiwanis International, a global service<br />
organization, provides funding<br />
support and continues to educate its<br />
grass-roots membership about IDD<br />
(Panel 15).<br />
The Government of Canada was a<br />
major player in all stages of this work,<br />
supporting UNICEF programmes in<br />
many countries and supporting the<br />
Ottawa-based Micronutrient Initiative,<br />
which in turn has extended technical<br />
support and funding to field<br />
programmes, including the development<br />
of monitoring guidelines. In<br />
54
Fig. 9 Iodine deficiency disorders and salt iodization<br />
Iodine deficiency disorders (IDD) were still a major public health problem in many parts of the world in 1990. Today, programmes to produce or import iodized salt are in<br />
place in most developing countries.<br />
Global prevalence of IDD (circa 1990)<br />
IDD is a public health problem IDD is not a public health problem No data<br />
Countries not assisted by UNICEF<br />
Percentage of households consuming iodized salt (1992–1996)<br />
Less than 50% 50% to 89% 90% or more No data Countries not assisted by UNICEF<br />
Source: IDD data from UNICEF, ‘Report on Progress Towards Universal Salt Iodization’, 1994. Salt iodization data compiled by UNICEF, 1997.<br />
Note: The boundaries shown on this map do not imply official endorsement or acceptance by UNICEF. Dotted line represents approximately the Line of Control in Jammu and Kashmir agreed upon by India and Pakistan.<br />
55
Panel 15<br />
Kiwanis mobilize to end<br />
iodine deficiency’s deadly toll<br />
Hundreds of times during the<br />
past several years, the Reverend<br />
Bob Wildman, a retired<br />
Protestant pastor, has ambled into<br />
Kiwanis International Club meetings<br />
all over Illinois and eastern Iowa<br />
in the Midwestern United States.<br />
Usually, he is granted only a few<br />
minutes to win over some very tough<br />
audiences.<br />
Many of the men and women<br />
who make up these Kiwanis clubs<br />
are business executives and professionals<br />
who have supported the organization’s<br />
service projects helping<br />
children and others in need in their<br />
own communities. The 73-year-old<br />
Rev. Wildman, a veteran Kiwanis<br />
leader, is determined to expand their<br />
notion of neighbourhood to include<br />
the global village.<br />
He has added his preacher’s voice<br />
to the Kiwanians’ first international<br />
service project: the campaign to wipe<br />
out one of the world’s most devastating<br />
nutritional problems — iodine<br />
deficiency disorders (IDD). Kiwanis<br />
leaders have brought to this global<br />
effort the fund-raising muscle of their<br />
600,000 members in 83 countries.<br />
An estimated 28 million babies<br />
are born each year at risk of mental<br />
impairment due to insufficient iodine<br />
in their mothers’ diets. Hundreds of<br />
thousands of children and adults suffer<br />
the most debilitating effect of<br />
iodine deficiency: a condition known<br />
as cretinism.<br />
Rev. Wildman’s challenge has been<br />
to make club members in his area<br />
care about villagers in remote regions<br />
of Africa, Asia and Latin America. In<br />
many developing countries, lack of<br />
iodine has taken a horrendous toll on<br />
children — from physical deformities<br />
to mental retardation. Iodization of<br />
table salt — a method of fortification<br />
now taken for granted in industrialized<br />
nations and costing less than 5<br />
cents per person per year — can rid<br />
the world of this tragedy.<br />
Before he speaks, Rev. Wildman<br />
places on the podium a poster-sized<br />
copy of a cherished photo of a tiny<br />
UNICEF/95-0134/Charton<br />
boy named Abdul Alim — whom he<br />
met in a 1994 visit to a village in<br />
Bangladesh. Abdul is an eight-yearold<br />
in a four-year-old’s deformed and<br />
malfunctioning body. He is profoundly<br />
mentally retarded and deaf<br />
and is held by a young man from the<br />
village because he cannot walk.<br />
Rev. Wildman describes Abdul’s<br />
disabilities and the severe hardships<br />
his care places on a village economy.<br />
The picture of this small child bridges<br />
geographical and cultural divides, and<br />
soon his audiences are ready to climb<br />
on the IDD campaign bandwagon.<br />
When Kiwanis International joined<br />
the campaign against IDD in 1994,<br />
they pledged to raise $75 million by<br />
July <strong>1998</strong>. Since then, they have become<br />
a key part of the campaign,<br />
with over $20 million raised or<br />
pledged so far for programmes in<br />
over 50 countries through Kiwanians’<br />
efforts. UNICEF estimates that this<br />
contribution has saved around 3 million<br />
children from irreversible mental<br />
retardation.<br />
Kiwanis leaders like Rev. Wildman<br />
have been shrinking the distance between<br />
their home towns and places<br />
like Abdul Alim’s tiny village in Bangladesh,<br />
and the concept of thinking<br />
globally while acting locally is taking<br />
hold in creative ways around the<br />
world.<br />
The Kiwanis Club of Ried im<br />
Innkreis in Austria staged a performance<br />
of the Chinese Dance and<br />
Acrobats Ensemble, for example,<br />
raising $9,000 for the IDD campaign.<br />
Kiwanians in Atikokan in Ontario<br />
(Canada) brought in the Jolly Ukranians,<br />
a folk group, netting the campaign<br />
$2,000. Kiwanis Clubs in the<br />
Philippines are supporting the campaign<br />
in their own country, where<br />
iodine deficiency is still a threat,<br />
through community education pro-<br />
56
jects and the distribution of<br />
iodized salt.<br />
Kiwanians in the Netherlands<br />
have pledged to raise $600,000<br />
through the sale of salt pots and a<br />
photo essay book. Hong Kong<br />
Kiwanians took in $10,000 for the<br />
campaign by obtaining sponsorships<br />
for completing a rugged 60-<br />
mile hike. The Kiwanis Club of<br />
Bergerac (France) donated proceeds<br />
from a masked ball, while<br />
Kiwanians in Christchurch (New<br />
Zealand) raised $1,300 with a<br />
bowling tournament. The Kiwanis<br />
Club of Spanish Town (Jamaica)<br />
convinced a local salt factory to<br />
iodize salt, sponsored IDD education<br />
events and set up an IDD<br />
prevention billboard on a major<br />
highway.<br />
The 95-member Kiwanis chapter<br />
in Rockford, Illinois, Rev.<br />
Wildman’s home town, has managed<br />
to more than double its original<br />
goal of $30,000 through fundraising<br />
efforts large and small.<br />
When Kathleen Sullivan was recently<br />
installed as the chapter’s<br />
new president at a dinner banquet,<br />
instead of buying expensive<br />
flower arrangements for each<br />
table, Ms. Sullivan decided on<br />
home-made centrepieces anchored<br />
with boxes of salt. “The<br />
money saved went to the IDD<br />
campaign,” says Ms. Sullivan,<br />
“and when I was making these<br />
centrepieces with my daughters, I<br />
explained what IDD was doing to<br />
children just like them. I like to believe<br />
they have a better view of the<br />
world because of the campaign.”<br />
Photo: Checking for signs of iodine<br />
deficiency, a nurse examines the thyroid<br />
gland of a woman at a UNICEF-assisted<br />
health centre in Myanmar.<br />
1995, UNICEF estimated that over 7<br />
million children were born free of the<br />
mental impairments of IDD largely<br />
because of the Canadian contribution.<br />
Partly because of Canada’s early<br />
and unambiguous support to combating<br />
IDD, other donors and governments<br />
in affected countries were drawn<br />
into the battle. The approximately $20<br />
million invested by the Government<br />
of Canada catalysed other investors.<br />
Total investment by public- and privatesector<br />
partners in this effort since<br />
1986 is now estimated to exceed<br />
$1 billion. 4<br />
In country after country, advocacy<br />
for salt iodization legislation has brought<br />
together teachers, consumer groups,<br />
women’s groups and health professionals.<br />
Primary schoolchildren by<br />
the millions are armed with test kits<br />
that enable them to check whether the<br />
salt in their homes is iodized — and<br />
to get a valuable chemistry lesson in<br />
the process. In Indonesia, for example,<br />
the enormous challenge of salt<br />
iodization in a country of almost 14<br />
thousand islands, with highly decentralized<br />
salt production, is being overcome<br />
by a coalition that includes<br />
millions of the country’s schoolchildren<br />
and teachers.<br />
The elimination of IDD as a public<br />
health problem is, of course, not complete,<br />
and momentum must not be<br />
lost. But the effort has already had results<br />
beyond these tangible benefits in<br />
the lives of individuals.<br />
The fight against IDD has brought<br />
to the attention of policy makers and<br />
communities the importance of good<br />
nutrition in ensuring the physical and<br />
mental development of children and<br />
populations. It has opened the door to<br />
accelerated work on other nutrient deficiencies<br />
with public health significance.<br />
It has demonstrated the value<br />
of public- and private-sector partnerships<br />
in pursuit of a well-defined goal<br />
in favour of children.<br />
A drop of testing solution added to a pinch<br />
of salt indicates whether iodine is present.<br />
UNICEF/96-0895/Clausen<br />
57
At a day-care centre in Viet Nam, babies eat<br />
vitamin A-rich vegetables grown in community<br />
gardens.<br />
UNICEF/94-0730/Booker<br />
The success of the drive for universal<br />
iodization of salt shows that the<br />
diets of children, women and families<br />
worldwide can be changed in small<br />
but very beneficial ways in just a few<br />
years as a result of concerted global,<br />
national and local action. It is imperative<br />
that this experience be built upon<br />
in attacking some of the other nutritional<br />
deficiencies that can begin impairing<br />
the development of a child<br />
even before birth.<br />
Capitalizing on<br />
vitamin A’s benefits<br />
Although the value of vitamin A for<br />
protecting children against blindness<br />
has been known for decades, vitamin<br />
A’s amazing ability to strengthen resistance<br />
to infection and reduce the<br />
chances of children dying has only recently<br />
won general acceptance by the<br />
scientific and medical establishment.<br />
Following a dramatic report from<br />
Indonesia in 1986 of a 34 per cent reduction<br />
in pre-school child mortality<br />
with vitamin A, 5 seven additional<br />
large studies were carried out over the<br />
next seven years. Most of these studies,<br />
involving more than 160,000 African<br />
and Asian children, reported large and<br />
significant reductions in mortality<br />
when children were given additional<br />
vitamin A through supplements or<br />
fortified food products. When these<br />
results were combined statistically in<br />
1993, it was firmly established that<br />
vitamin A supplementation could<br />
reduce child mortality by about 23<br />
per cent where there is a risk of deficiency.<br />
6 These conclusions, strengthened<br />
further by evidence that the<br />
vitamin has an even greater lifesaving<br />
effect on children with measles,<br />
brought widespread acceptance that<br />
measures to prevent vitamin A deficiency<br />
could have an enormous impact<br />
on child survival.<br />
Adequate vitamin A status does<br />
little to prevent children from being<br />
infected but has a major effect on reducing<br />
the severity of illness, especially<br />
persistent diarrhoea, dysentery,<br />
measles and malaria (Panel 18). Vitamin<br />
A’s power to reduce the severity<br />
of illness was clearly evident in<br />
Ghana, where periodic distribution of<br />
the vitamin led to a reduction in local<br />
clinic attendance by 12 per cent and<br />
hospital admissions by 38 per cent. 7<br />
Vitamin A can thus have a doublebarrelled<br />
effect: It not only reduces<br />
the severity of illness and saves lives<br />
but also may ease the demand on<br />
often overworked health workers and<br />
facilities.<br />
The effect of the discovery of vitamin<br />
A as a child survival tool led to<br />
renewed global interest in updating<br />
knowledge about the extent and public<br />
health significance of vitamin A<br />
and other micronutrient deficiencies.<br />
Numerous surveys of clinical and subclinical<br />
vitamin A deficiency have led<br />
to an estimate that in 1990 there were<br />
over 100 million young children in<br />
the world at risk from the deficiency<br />
because of inadequate diets, although<br />
today the immediate risk for many of<br />
these children has been diminished by<br />
effective interventions, including regular<br />
vitamin A supplements.<br />
Some countries still lack good assessments,<br />
but vitamin A deficiency,<br />
its underlying causes and its consequences<br />
for health and survival are much<br />
better understood now than ever before.<br />
The age-old condition of maternal<br />
night-blindness has finally come to be<br />
recognized as a major public health<br />
problem. Long ignored by both afflicted<br />
women and the medical establishment,<br />
maternal night-blindness is<br />
now recognized to be widespread,<br />
with an estimated 1 million to 2 million<br />
pregnant women affected at any<br />
given time in South Asia alone.<br />
Women describe how they are able to<br />
see adequately during the day but<br />
after sunset are unable to move about<br />
58
and carry out their household chores.<br />
They consider it a common problem<br />
of pregnancy that goes away once the<br />
child is born. But recent work in<br />
Nepal shows that women with nightblindness<br />
during pregnancy are six<br />
times more likely to have been night<br />
blind in a previous pregnancy 8 and<br />
that the condition is a marker for a<br />
constellation of risk factors, including<br />
dietary vitamin A inadequacy and deficiency;<br />
iron deficiency anaemia;<br />
protein-energy malnutrition; increased<br />
morbidity during pregnancy; and<br />
mortality up to two years after diagnosis<br />
(Panel 1).<br />
Combining a variety<br />
of approaches<br />
Several approaches exist to prevent<br />
vitamin A deficiency, each with its<br />
own strengths and limitations, but<br />
which can be highly effective if applied<br />
in complementary ways. These<br />
include vitamin A supplements (commonly<br />
administered in capsule form),<br />
fortification of food and gardening or<br />
other methods to improve diets.<br />
Vitamin A can be boosted through<br />
homestead gardening or adapting food<br />
preservation or preparation methods<br />
that can enhance retention. And fortifying<br />
food with vitamin A has become<br />
increasingly feasible as fortifiable foods<br />
penetrate the markets of the poor in a<br />
number of countries. These food-based<br />
approaches combine increased vitamin<br />
A supply with nutrition education<br />
that promotes the consumption of<br />
vitamin A-rich foods by young children<br />
and women.<br />
Periodic supplementation that provides<br />
high-dose vitamin A capsules —<br />
both to children from 6 months to<br />
5 years and beyond, and to mothers as<br />
soon after childbirth as possible —<br />
has proved to be a very valuable intervention,<br />
offering immediate help to<br />
children who are at risk of vitamin A<br />
deficiency in situations where foodbased<br />
options are limited. Experts<br />
estimate that periodic high-dose<br />
supplements for young children have<br />
the potential of eliminating 90 per<br />
cent of blindness and other ocular<br />
consequences of vitamin A deficiency<br />
and about 23 per cent of mortality<br />
in early childhood wherever the<br />
deficiency is common.<br />
Successes in<br />
supplementation<br />
It is a major global achievement that<br />
by mid-1997, some 30 years after the<br />
first vitamin A supplementation programmes<br />
began in India, the policy of<br />
providing children with periodic highdose<br />
supplements has been adopted in<br />
all but 3 of the 38 countries where<br />
clinical vitamin A deficiency still existed,<br />
and in all but 13 of the additional<br />
40 countries with documented<br />
subclinical deficiency.<br />
At least 35 countries also routinely<br />
provide vitamin A supplements with<br />
immunizations during ‘national immunization<br />
days’. And many countries<br />
link vitamin A supplementation<br />
to regular immunization activities or<br />
to periodic deworming of children, as<br />
in India and Mauritania.<br />
Overall, UNICEF estimates that<br />
more than half of all young children<br />
in countries where vitamin A deficiency<br />
is known to be common received<br />
high-dose vitamin A capsules<br />
in 1996, compared to about one third<br />
in 1994 (Fig. 10). This includes such<br />
large countries as Bangladesh, India,<br />
Nigeria and Viet Nam. Between 1993<br />
and 1996, UNICEF purchased nearly<br />
a half-billion high-dose vitamin A<br />
capsules that were distributed in 136<br />
countries, helping to bring or keep<br />
vitamin A deficiency under control.<br />
At roughly 2 cents per capsule and<br />
perhaps 20 to 25 cents per delivered<br />
dose, few other child health or nutrition<br />
interventions are as cost-<br />
Fig. 10 Progress in vitamin A<br />
supplementation programmes<br />
In the 78 countries where vitamin A deficiency is a<br />
recognized public health problem, supplementation<br />
programmes are on the rise.<br />
1994<br />
1996<br />
0 10 20 30 40 50 60 70 78<br />
Number of countries<br />
Countries where policies to supplement<br />
post-partum mothers are in place<br />
1994<br />
1996<br />
0 10 20 30 40 50 60 70 78<br />
Number of countries<br />
Countries where young children routinely<br />
receive vitamin A supplements<br />
1994<br />
1996<br />
0 10 20 30 40 50 60 70 78<br />
Number of countries<br />
Countries where more than 50% of young<br />
children routinely receive vitamin A<br />
supplements<br />
Source: UNICEF/MI/Tulane University, 'Progress in controlling<br />
vitamin A deficiency 1997' (draft).<br />
59
Iron deficiency anaemia is<br />
probably the most prevalent<br />
nutritional problem in the<br />
world…and progress in<br />
reducing its prevalence and<br />
impact has been slower than<br />
might be hoped.<br />
effective in reducing mortality and<br />
disability throughout life as vitamin A<br />
supplements.<br />
Breastmilk nearly always provides<br />
enough vitamin A to protect a child<br />
from severe deficiency, even if this<br />
means that the child’s mother becomes<br />
deficient. However, both mothers and<br />
infants can be protected against deficiency<br />
if mothers receive a high dose<br />
of vitamin A soon after they give birth.<br />
Some 50 countries have adopted a<br />
policy of routine high-dose supplements<br />
for women soon after childbirth,<br />
which protects their children for<br />
about six months. New information<br />
on the impact of vitamin A deficiency<br />
on women’s health makes post-partum<br />
supplementation an even greater priority<br />
(Panel 1).<br />
❑<br />
Sugar fortification:<br />
A sweet success<br />
Several countries have chosen another<br />
route to improved vitamin A status of<br />
their populations: fortifying the sugar<br />
supply.<br />
Guatemala has led the developing<br />
world in fortifying sugar with vitamin<br />
A since the mid-1970s. Despite nearly<br />
a decade of civil disturbance and a<br />
lapse in fortification for several years<br />
in the early 1980s, an evaluation of 82<br />
villages in 1990 concluded that sugar<br />
fortification had brought vitamin A<br />
deficiency under control among Guatemalan<br />
children.<br />
Sugar is also being fortified in<br />
parts of Bolivia, Brazil, El Salvador,<br />
Honduras and the Philippines, and<br />
Zambia is planning to begin fortification<br />
in <strong>1998</strong>, with other countries<br />
likely to follow or to find other staple<br />
foods to fortify with vitamin A. The<br />
Philippines, for example, has successfully<br />
tested and fortified a local, nonrefrigerated<br />
margarine with vitamin A<br />
and is testing the impact of fortifying<br />
the wheat flour used in its national<br />
bread, pan de sal.<br />
The success of fortification depends<br />
on a number of factors: Those<br />
at risk of the deficiency must consume<br />
the fortified food regularly and<br />
in great enough quantities to make a<br />
difference, the fortification must not<br />
alter the palatability of the product for<br />
consumers and it must not put the product<br />
out of their financial reach. If these<br />
conditions are met, this can be a very<br />
effective approach, as the Guatemalan<br />
experience has shown. Supplementation<br />
may be an important complementary<br />
strategy for fortification if fortified foods<br />
do not reach all affected individuals.<br />
Countries also need to ensure that<br />
sugar fortification programmes do not<br />
promote increased consumption of<br />
sugar but are aimed at informing consumers<br />
that whatever sugar they do<br />
consume should be fortified.<br />
❑<br />
Improving diets to<br />
boost vitamin A<br />
In many countries, vegetable gardening<br />
around the home and food preservation<br />
and preparation methods that<br />
enhance the vitamin content of the<br />
diet have been promoted as a means<br />
of improving vitamin A intake. In<br />
West Africa and Haiti, for instance,<br />
drying of mangoes has extended<br />
access to this important vitamin A<br />
source beyond the months of the<br />
mango season.<br />
In Bangladesh, home gardens of<br />
fruits and vegetables have been adopted<br />
by families of low socio-economic<br />
status in one fifth of the country in recent<br />
years, the result of systematic introduction<br />
of village nurseries, the<br />
availability of low-cost seeds, and reliable<br />
extension services. This work<br />
has been supported by the NGO<br />
Helen Keller International. Initial<br />
evaluations suggest that this programme<br />
has curbed the incidence of<br />
night-blindness, especially in families<br />
that grow and consume a variety of<br />
vegetables. This is one of relatively<br />
60
few such projects where careful evaluations<br />
have made it possible to<br />
assess the impact of activities on<br />
vitamin A status.<br />
There is evidence that eating a variety<br />
of foods rich in carotene — the<br />
precursor form of vitamin A found in<br />
fruits and vegetables — coupled with<br />
some vitamin A from animal sources —<br />
can alleviate moderate to severe vitamin<br />
A deficiency in children and women.<br />
The absence of more evidence that<br />
gardening projects improve vitamin A<br />
status may be because of the low availability<br />
of some carotenoids in plant<br />
foods for the body, the lack of complementary<br />
fats and animal foods in<br />
the diet, or inadequate evaluation<br />
methods. In addition, it is not clear<br />
which vegetables or fruits are most effective<br />
in improving vitamin A status.<br />
This question is an important research<br />
challenge.<br />
Promoting increased consumption<br />
of vitamin A through animal foods<br />
may be possible in some countries. A<br />
recent project in Central Java (Indonesia),<br />
supported by Helen Keller<br />
International, the Micronutrient Initiative<br />
and UNICEF, promoted the<br />
consumption of eggs, which are affordable,<br />
to reduce vitamin A deficiency.<br />
As a result, egg consumption<br />
increased and vitamin A status improved<br />
significantly among young<br />
children in this project (Panel 16).<br />
Helen Keller International also successfully<br />
promoted increased consumption<br />
of vitamin A-rich liver by<br />
children in Niger, where animal products<br />
are relatively accessible in some<br />
regions.<br />
❑ Responding to anaemia<br />
Iron deficiency anaemia is probably<br />
the most prevalent nutritional problem<br />
in the world. Over half the women in<br />
developing countries and a large percentage<br />
of young children suffer from<br />
it, 9 and progress in reducing its preva-<br />
lence and impact has been slower than<br />
might be hoped. As with vitamin A,<br />
several approaches have been pursued.<br />
The consequences of anaemia for<br />
pregnant women and their newborn<br />
children are often disastrous. The condition<br />
puts women at higher risk of<br />
death because of the greater likelihood<br />
of haemorrhage in childbirth<br />
and other factors, and their newborns<br />
face a high risk of poor growth and<br />
development. Many countries have<br />
adopted policies to ensure that women<br />
who seek prenatal care have access to<br />
daily iron supplements to help them<br />
meet the very high needs of pregnancy<br />
and childbirth. UNICEF is a<br />
major supplier of iron/folate tablets.<br />
A total of 2.7 billion were provided to<br />
122 countries from 1993 to 1996.<br />
However, since many pregnant<br />
women enter pregnancy already<br />
anaemic — and it is difficult to resolve<br />
pre-existing anaemia during<br />
pregnancy — more attention is being<br />
paid in some countries to improving<br />
the iron and folate status of girls and<br />
young women before their first pregnancy.<br />
There is evidence from smallscale<br />
trials that in cases where it is<br />
difficult to reach young women with<br />
daily iron/folate supplements, ensuring<br />
weekly or twice-weekly supplementation<br />
may still be effective in<br />
building iron stores. 10 In Malaysia,<br />
weekly supplementation over several<br />
months resolved the anaemia in over<br />
80 per cent of adolescent girls in a<br />
community where anaemia was highly<br />
prevalent. Similar results have been<br />
reported from other countries.<br />
Fortification of foods with iron<br />
is also an effective means of addressing<br />
anaemia. Wheat flour and flour<br />
products are the most common vehicles<br />
for iron fortification in places<br />
where they are widely consumed and<br />
centrally processed, particularly in<br />
Latin America and the Middle East<br />
(Panel 17).<br />
Vitamin A supplementation reduces the<br />
severity of illness and the risk of death in<br />
children in areas where the vitamin is<br />
deficient, resulting in dramatic increases in<br />
child survival. In Mali, a girl holds a mango,<br />
a good source of vitamin A.<br />
UNICEF/WCARO/Pirozzi<br />
61
Panel 16<br />
Indonesia makes strides against<br />
vitamin A deficiency<br />
One of the great — and still<br />
evolving — nutritional success<br />
stories is the progress<br />
made by Indonesia towards eliminating<br />
vitamin A deficiency. Two decades<br />
ago, in this nation of islands with a<br />
population of 200 million — the fourth<br />
highest in the world — the problem<br />
was serious. High levels of vitamin A<br />
deficiency, which can cause blindness<br />
and damage the immune system,<br />
greatly increasing the risk of<br />
illness and death, affected more than<br />
2 million Indonesians.<br />
The Government, in cooperation<br />
with UNICEF and other international<br />
partners, tackled the problem through<br />
the distribution of high-dose vitamin<br />
A capsules to children ages one to<br />
five, reducing deficiency levels dramatically.<br />
The rate of severe vitamin<br />
A deficiency has declined by more<br />
than 75 per cent, according to a national<br />
survey in 1993, sparing the<br />
eyes, health and lives of millions of<br />
children. Blindness among children<br />
due to vitamin A deficiency was eliminated<br />
in 1994.<br />
Indonesia has not fully solved the<br />
vitamin A problem, however. Severe<br />
deficiency remains a problem in three<br />
provinces, and the survey also found<br />
that approximately half of all children<br />
under five had inadequate levels of<br />
vitamin A. Studies among schoolchildren<br />
and breastfeeding women<br />
in West Java have shown mild and<br />
moderate deficiency to be prevalent.<br />
In response, the Indonesian Government<br />
has set the goal of eliminating<br />
vitamin A deficiency by the year<br />
2000, using four strategies. The first<br />
is continued distribution of vitamin A<br />
capsules to children ages one to five<br />
through posyandu (community health<br />
posts), an effort which reached 60-70<br />
per cent of children in this age group<br />
in 1993-1994. The second strategy is<br />
distribution of high-potency vitamin<br />
A capsules to mothers after they give<br />
birth, which will require special efforts,<br />
as only 35 per cent of births<br />
UNICEF/91-4645/Watson<br />
occur under medical supervision.<br />
The other strategies are food fortification<br />
with vitamins and minerals,<br />
including vitamin A (which is already<br />
under way by noodle manufacturers),<br />
and promotion of increased consumption<br />
of foods rich in the vitamin.<br />
In support of this effort, the Government,<br />
with assistance from Helen<br />
Keller International, the Micronutrient<br />
Initiative and UNICEF, has<br />
launched the Central Java Project to<br />
improve vitamin A intake among<br />
children in this region in the first two<br />
years of life.<br />
The project undertook three major<br />
efforts beginning in 1996, with the<br />
Indonesian system of posyandu and<br />
its cadre of midwives and birth attendants<br />
at the centre. First, a supplementation<br />
programme was launched<br />
to give one high-potency vitamin A<br />
capsule to all new mothers during<br />
the first month after delivery, along<br />
with two doses of deworming pills,<br />
to improve their health and nutrition.<br />
Ensuring mothers’ adequate intake<br />
of vitamin A also ensures that babies<br />
receive the amount they need through<br />
breastfeeding.<br />
In the first six months of the project,<br />
nearly 20 per cent of new mothers<br />
in Central Java received vitamin A<br />
capsules, almost double the rate in<br />
the previous two years. The goal of<br />
the project is to reach at least 80 per<br />
cent coverage.<br />
A second element of the project is<br />
a large-scale social marketing campaign<br />
to promote consumption of<br />
foods rich in vitamin A, focusing on<br />
eggs and dark green leafy vegetables.<br />
Research found, for example,<br />
that while a number of vitamin A-rich<br />
foods — such as eggs, liver, spinach,<br />
cassava leaves and papaya — are<br />
available year-round, few mothers or<br />
community leaders recognized these<br />
62
as good sources of vitamin A.<br />
Therefore a series of radio and<br />
television spots, posters, banners,<br />
advertising and one-on-one counselling<br />
methods were developed<br />
to publicize the benefits — for<br />
pregnant and breastfeeding women<br />
and for children between the ages<br />
of 6 and 24 months in particular —<br />
of eating eggs and vitamin A-rich<br />
foods.<br />
Third, a nutritional surveillance<br />
system was instituted to provide<br />
information on nutritional status,<br />
food consumption patterns and<br />
updates on the effectiveness of<br />
the project.<br />
Thus far, the project clearly has<br />
improved the understanding of<br />
nutrition and diet patterns in Central<br />
Java. Within three months of<br />
the start of the social marketing<br />
campaign, egg consumption by<br />
both children and mothers had<br />
increased, correlated with higher<br />
vitamin A levels.<br />
Vitamin A capsules will continue<br />
to be an important measure<br />
because people’s diets are still not<br />
sufficiently high in the vitamin.<br />
But the project has demonstrated<br />
that enriching diets through eggs,<br />
an available and rich source of vitamin<br />
A, is an important and sustainable<br />
step towards ensuring<br />
that mothers and children receive<br />
the vitamin A that they need to<br />
help them live and grow.<br />
Photo: A health and nutrition worker in<br />
Indonesia explains the benefits of eggs,<br />
a good source of vitamin A.<br />
In 1993, Venezuela began fortifying<br />
all wheat and maize flour with<br />
iron and B vitamins. A 1996 evaluation<br />
showed large reductions in the<br />
prevalence of anaemia in children and<br />
adolescents following the fortification,<br />
even though during this period<br />
the country was suffering from a general<br />
economic decline. 11<br />
At a meeting in 1996, countries of<br />
the Middle East and North Africa<br />
made a joint commitment to fortifying<br />
wheat flour with iron as a principal<br />
strategy for anaemia reduction in<br />
the region, where wheat is a staple.<br />
Anaemia is made worse by some<br />
illnesses, particularly hookworm infection.<br />
Malaria is also a major cause<br />
of anaemia, although this is not directly<br />
related to iron losses. In several<br />
countries, deworming of schoolchildren<br />
has been shown to reduce the<br />
prevalence and severity of anaemia. 12<br />
Preventing malaria and improving its<br />
curative treatment, which are priorities<br />
of UNICEF and WHO for <strong>1998</strong><br />
and beyond, will undoubtedly go a<br />
long way to reducing anaemia in children<br />
and adults alike.<br />
Improving basic health<br />
services<br />
The nutritional well-being of children<br />
around the world has benefited greatly<br />
from the enormous achievements<br />
since 1990 in improving children’s<br />
access to basic health services, both<br />
curative and preventive.<br />
The success of child immunization<br />
programmes has been a major boost<br />
to child health. Immunization also<br />
protects vitamin A levels, which plummet<br />
during acute measles infections.<br />
So, the spectacular achievement of<br />
over 90 per cent immunization coverage<br />
in 89 countries and over 80 per cent<br />
in another 40 countries by 1996 —<br />
including a 79 per cent global measles<br />
immunization rate 13 — means that for<br />
millions of children, vitamin A levels<br />
The nutritional well-being<br />
of children around the world<br />
has benefited greatly from<br />
the enormous achievements<br />
since 1990 in improving<br />
children’s access to basic<br />
health services, both<br />
curative and preventive.<br />
63
Panel 17<br />
Making food enrichment programmes sustainable<br />
Fortification of food staples with<br />
iron, vitamin A, iodine and other<br />
micronutrients is the most costeffective,<br />
sustainable option for eliminating<br />
micronutrient deficiencies.<br />
Salt iodization, reaching an additional<br />
1.5 billion consumers worldwide<br />
since 1990 and sparing millions of<br />
babies from mental retardation each<br />
year, is testimony to how successful<br />
fortification programmes can be.<br />
But as positive as the end results<br />
are, fortification is a complex undertaking<br />
that requires government and<br />
industry to commit to working together<br />
as partners. Recent experience<br />
shows that fortification succeeds when<br />
producers are involved from the start<br />
in formulating regulations and in<br />
resolving the marketing and technical<br />
issues that can make or break a<br />
programme.<br />
It’s the law: Effective legislation is<br />
a basic requirement, helping to set<br />
goals and define roles of food producers,<br />
the health and nutrition authorities<br />
and scientific institutions.<br />
Without such a framework, a programme<br />
is more vulnerable to weak<br />
implementation, uneven results and<br />
possible failure. That was the experience<br />
of South Africa, where a maizeenrichment<br />
programme launched in<br />
1983 without compulsory legislation<br />
was pronounced a failure after 10<br />
years. Efforts are now being made to<br />
review the programme, with a focus<br />
on legislation and the role of the food<br />
industry.<br />
Even then, legislation must be enforced<br />
and supported by policies.<br />
Guatemala passed a law in 1975<br />
mandating that sugar be fortified<br />
with vitamin A. Not only was the law<br />
unenforced but the programme also<br />
quickly fell apart for lack of the foreign<br />
exchange needed to purchase<br />
the vitamin and because producers<br />
were not convinced of the programme’s<br />
effectiveness. A decade<br />
passed before fortification was resumed,<br />
after the Institute of Nutrition<br />
of Central America and Panama<br />
(INCAP) and UNICEF worked with<br />
producers to explain the importance<br />
of fortification, provided technical<br />
assistance and helped them obtain<br />
vitamin A at below-market prices or<br />
through donation. Guatemala’s Ministry<br />
of Health now enforces the law:<br />
UNICEF/96-0896/Clausen<br />
Producers whose sugar shows low<br />
levels of vitamin A in random tests<br />
are first warned and then are either<br />
fined or shut down.<br />
Pricing and marketing: Start-up<br />
costs of equipment and training can<br />
be high, but these are primarily oneoff.<br />
Costs of the fortificant, labour<br />
and equipment maintenance are recurrent.<br />
Fortifiers’ competitive position<br />
in the market place can be<br />
further eroded by price controls or<br />
taxation, and governments can play<br />
a helpful role in these areas. When<br />
Brazil’s Government removed price<br />
controls and reduced a value-added<br />
tax on milk, for example, dairy production<br />
received a boost and fortification<br />
of milk became more attractive<br />
to producers.<br />
Laws can eliminate the price advantage<br />
enjoyed by non-fortified<br />
products. In 1997, Oman banned<br />
local production and importation of<br />
white wheat flour not fortified with<br />
iron and folate, and Bolivia mandated<br />
that all wheat — local, imported or<br />
donated — be fortified with iron, folic<br />
acid and vitamin B complex.<br />
Yet government intervention does<br />
not always succeed in lowering costs<br />
to workable levels. In Indonesia, efforts<br />
to fortify monosodium glutamate<br />
(MSG) with vitamin A were<br />
unsuccessful because technical problems<br />
of maintaining vitamin stability<br />
and colour consistency were too<br />
costly to solve. In the Philippines, it<br />
was so expensive to develop fortified<br />
margarine that only one multinational<br />
corporation carried through<br />
with it.<br />
Questions of quality: Fortification<br />
can have commercial consequences,<br />
since any change in the way a product<br />
tastes, looks or smells can hurt<br />
sales and market share. For example,<br />
when Venezuela in the late 1980s de-<br />
64
cided to fortify maize flour with<br />
ferrous fumarate (iron), in product<br />
tests the flour turned from its familiar<br />
white to grey. Sensing that<br />
consumers would not buy the<br />
product, producers baulked. The<br />
situation was resolved in 1992,<br />
when the National Institute of<br />
Nutrition allowed producers to<br />
fortify with a blend of iron components<br />
that did not change the<br />
colour of the flour.<br />
Follow-up: It is vital to keep<br />
tabs on the process to ensure that<br />
fortified products maintain potency<br />
standards and reach consumers.<br />
Chile began fortifying<br />
wheat flour with iron in the early<br />
1950s, but it was not until 1967<br />
that a system for monitoring and<br />
quality control was established,<br />
and only in 1975, when a national<br />
survey revealed the iron status of<br />
the population, that the programme’s<br />
efficacy from that point<br />
on could begin to be evaluated.<br />
Commitment and coordination:<br />
“Authorities must be convinced<br />
of the need to make<br />
fortification compulsory. And to<br />
eliminate any possible resistance,<br />
producers must be convinced of<br />
fortification’s benefits,” says Jorge<br />
David, head of the Latin American<br />
Millers Association (ALIM).<br />
In 1996, Bolivia became the<br />
first country certified to have virtually<br />
eliminated iodine deficiency<br />
as a public health problem.<br />
The phenomenal success stems<br />
from legislation that expressed a<br />
public policy decision to iodize<br />
and 13 years of coordinated work<br />
by salt producers, the Government<br />
and international cooperation<br />
agencies.<br />
Photo: In Ghana, workers gather salt to<br />
be taken to a processing plant for iodization.<br />
undisturbed by measles episodes will<br />
continue to help protect them from<br />
illness.<br />
Programmes to improve hygiene<br />
and sanitation are also likely to be of<br />
crucial importance almost everywhere<br />
there is malnutrition in impoverished<br />
communities. Improved water supplies<br />
or support to food production<br />
may also be very critical, depending<br />
on local circumstances. Analyses in<br />
several countries have found that the<br />
strongest predicting factors for malnutrition<br />
are lack of safe water, inadequate<br />
sanitation and high fertility rates.<br />
Each year over 1 million more<br />
children are saved from death through<br />
the use of oral rehydration therapy<br />
(ORT). 14 ORT promotion includes support<br />
for continued feeding during and<br />
after diarrhoea as well as the use of<br />
oral rehydration salts (ORS) to prevent<br />
and treat dehydration. Continued<br />
progress is needed in diarrhoea prevention,<br />
treatment, nutritional management<br />
and cure to ensure that growth<br />
lost during diarrhoea episodes is rapidly<br />
caught up, but the achievements so far<br />
have been of great nutritional benefit<br />
to millions of children. Similarly, the<br />
gains already achieved in access to<br />
safe water and sanitation facilities<br />
have translated into nutritional benefits<br />
around the world. Millions more<br />
children than before have been able to<br />
avoid plunging deeper into the spiral<br />
of infection and poor dietary intake<br />
because so many illness episodes are<br />
prevented or readily cured.<br />
An especially important advance<br />
in the health world has been the revitalization<br />
of basic health services<br />
through such measures as the Bamako<br />
Initiative, the set of policy measures<br />
launched by African governments in<br />
1987 in response to the rapid deterioration<br />
of public health systems in<br />
Africa in the 1970s and 1980s. Now<br />
operating in other regions, the Bamako<br />
Initiative measures have meant that<br />
Diarrhoea, often in conjunction with<br />
malnutrition, claims the lives of 2.2 million<br />
children each year. Increased use of ORT<br />
as well as improvements in hygiene and<br />
sanitation are helping stem the toll.<br />
In Syria, a woman gives her baby oral<br />
rehydration solution.<br />
UNICEF/96-1079/Toutounji<br />
65
There is no single, globally<br />
applicable solution to the<br />
overall problem, and there is<br />
no substitute for assessment<br />
and analysis done with the<br />
full and active participation<br />
of the families most<br />
threatened by nutritional<br />
problems and most familiar<br />
with their impact and causes.<br />
health centres in remote areas — virtually<br />
abandoned in the 1980s for lack<br />
of basic drugs and supplies — are<br />
again thriving and serving the communities<br />
whose active involvement in<br />
their management has helped resuscitate<br />
them. The results have been striking.<br />
In addition to ensuring access to<br />
basic curative services, the initiative<br />
has sustained increased coverage of<br />
immunization and other preventive<br />
activities. In Guinea, for example, prenatal<br />
care coverage went from less<br />
than 5 per cent before the initiative to<br />
almost 80 per cent in the mid-1990s.<br />
With WHO and other partners,<br />
UNICEF is committed to accelerated<br />
action in malaria control, including<br />
the promotion of insecticide-treated<br />
bednets and support for improved<br />
drug use in malaria treatment. A combined<br />
programme for prevention of both<br />
iron deficiency anaemia — through<br />
iron supplementation, fortification and<br />
dietary improvement — and parasiteinduced<br />
anaemia — through malaria<br />
control and deworming — is one<br />
emerging approach for effectively addressing<br />
these age-old problems.<br />
Programmes featuring<br />
improved education<br />
and information<br />
The programmes described above in<br />
Niger and Tanzania included important<br />
education, information and communication<br />
components. In some cases, this<br />
included reinforcing classroom education,<br />
as in Niger, where literacy and<br />
other non-formal instruction to women<br />
in participating villages only served to<br />
highlight the need to improve formal<br />
education for their children, especially<br />
their daughters. One donor agency<br />
involved in supporting communitybased<br />
programmes in Niger, in fact,<br />
encouraged the inclusion of formal<br />
education for girls as part of the activities<br />
meant to improve nutrition.<br />
School-based programmes in cases<br />
such as this, as well as non-formal<br />
programmes for youth and adults,<br />
such as literacy and parent education<br />
courses, are a useful complement and<br />
sometimes a principal vehicle for<br />
other activities promoting better nutrition.<br />
It is easy and usually very appropriate<br />
to ensure that curricula used<br />
in these programmes include strong<br />
nutrition components.<br />
Schools, teachers and education<br />
programmes can serve as mobilizers<br />
of community participation in many<br />
ways, such as through village education<br />
committees and parent-teacher<br />
associations. These can also serve as a<br />
resource for nutrition and help organize<br />
relevant community-based assessment,<br />
analysis and action as well<br />
as promote good practices and share<br />
information concerning nutrition.<br />
In the Lao People’s Democratic<br />
Republic, for example, early childhood<br />
development volunteers in the<br />
community and parents are mobilized<br />
through participatory processes to<br />
develop, among other skills, better<br />
nutrition practices, both traditional<br />
and modern. The essential role of<br />
teachers and schoolchildren in promoting<br />
the use of iodized salt and even<br />
testing its quality in Indonesia was<br />
mentioned earlier. In this case, messages<br />
about salt iodization and its<br />
importance have even been formally<br />
incorporated into teacher training<br />
courses across the country.<br />
Eight useful lessons<br />
What have these success stories shown?<br />
While there is no single prescription,<br />
these eight points bear noting.<br />
1. Solutions must involve<br />
those most directly affected.<br />
Malnutrition has many causes and<br />
manifests itself in several ways. There<br />
is no single, globally applicable solu-<br />
66
tion to the overall problem, and there<br />
is no substitute for assessment and<br />
analysis done with the full and active<br />
participation of the families most<br />
threatened by nutritional problems<br />
and most familiar with their impact<br />
and causes. People who suffer or<br />
whose children suffer from malnutrition<br />
cannot be passive recipients of<br />
programmes. If they are not the main<br />
players in problem assessment and<br />
analysis, then actions to reduce malnutrition<br />
are likely to be inappropriate<br />
or unsustainable.<br />
2. A balance of approaches<br />
is necessary.<br />
A central challenge for nutrition programmes,<br />
as well as other development<br />
efforts, is finding a balance of<br />
approaches that work. Processes involving<br />
assessment, analysis and action<br />
— the triple A approach — are<br />
essential for formulating appropriate<br />
‘bottom-up’ solutions, particularly<br />
with respect to the ways in which programmes<br />
are organized, managed and<br />
monitored. But there are some aspects<br />
of resolving malnutrition that can be<br />
appropriately formulated at higher<br />
levels, using wide and more ‘topdown’<br />
application of appropriate<br />
strategies and technologies, based on<br />
the best scientific knowledge and the<br />
most effective technologies available.<br />
UNICEF experience indicates that<br />
for many problems, a combination of<br />
top-down and bottom-up actions may<br />
be best. BFHI was formulated as a<br />
global strategy, but its success has<br />
taken many forms, depending on the<br />
engagement of national and local institutions<br />
and groups.<br />
Vitamin A supplementation was<br />
suggested by the mortality reduction<br />
it enabled in many places and endorsed<br />
globally as a strategy, but its application<br />
has depended greatly on existing<br />
health measures and the involvement<br />
of community-based institutions.<br />
Salt iodization has been enhanced<br />
by consumer advocacy and legislative<br />
change at the local and national levels<br />
and by the fact that communities previously<br />
affected by IDD can see and<br />
feel a difference.<br />
The essence of a triple A approach<br />
is not necessarily to establish new<br />
cycles but, as much as possible, to<br />
build upon existing ones. Assessmentanalysis-action<br />
cycles are the logical<br />
steps everyone tries to follow in order<br />
to cope with their problems better. By<br />
understanding how nutritionally useful<br />
mechanisms work and where the<br />
weaknesses are, a nutrition programme<br />
can build upon and improve existing<br />
good practices, rather than establishing<br />
new systems and procedures<br />
that may be difficult to accept and<br />
adopt, and are therefore difficult to<br />
sustain.<br />
In the case of the Tanzanian CSD<br />
Programme, there were many components<br />
but the main focus was to improve<br />
people’s capacity to assess the<br />
problem — through growth monitoring<br />
— and thereby help them make<br />
better use of their resources.<br />
3. Nutrition components work<br />
better in combination.<br />
Because malnutrition is the result of so<br />
many factors, it is not surprising that<br />
it has been attacked most effectively<br />
in situations in which several sectors<br />
and strategies have been brought to bear.<br />
Combining improved infant feeding,<br />
better household access to food<br />
overall and improved and more accessible<br />
health services and sanitation is<br />
clearly more effective in reducing<br />
malnutrition where food, health and<br />
care are a problem than any of these<br />
measures taken alone. In support of<br />
these various approaches that work,<br />
relevant social services — health,<br />
education, communication and social<br />
mobilization — must be more clearly<br />
focused on nutrition. This is not done<br />
Community-based growth monitoring is a<br />
central component of the triple A approach.<br />
A child’s growth chart is updated during a<br />
growth monitoring session in Mauritania.<br />
UNICEF/5749/Goodsmith<br />
67
Governments, communities and families need<br />
to work together to fulfil their children’s<br />
rights to good nutrition. In Cambodia,<br />
a girl carries her baby sibling.<br />
UNICEF/93-0627/Isaac<br />
by creating new ‘nutrition projects’ in<br />
these areas, but rather by incorporating<br />
nutrition components in ongoing<br />
community-based activities. Experience<br />
shows the usefulness of building<br />
such nutrition components into all<br />
programmes, wherever possible.<br />
The impact on nutrition of health,<br />
education and other social services<br />
should also be monitored, with the results<br />
used both for a better understanding<br />
of nutrition problems and as<br />
a means to motivate policy makers,<br />
programme staff and communities<br />
themselves to increase their efforts to<br />
reduce malnutrition. Based on the monitoring<br />
of nutrition impact, viable and<br />
successful programmes should be redesigned<br />
so as to have the best effect.<br />
Communication plays a special role<br />
in nutrition programmes in arming<br />
parents, educators and other caregivers<br />
not only with basic nutrition information<br />
but also with the ability to<br />
make informed decisions and the<br />
skills and knowledge needed to take<br />
action to support improved nutrition<br />
in their communities.<br />
Communication should be carried<br />
out simultaneously at various levels to<br />
include parents, other family members,<br />
teachers, volunteers and community<br />
leaders who can in turn teach<br />
and support good practices. In addition,<br />
personnel of provincial and district<br />
health offices, staff in agriculture,<br />
rural development and education itself,<br />
media representatives, researchers<br />
and persons in positions of power of<br />
any kind must be reached and their<br />
help enlisted.<br />
4. Progress hinges on<br />
continuing research.<br />
All of these gains against malnutrition<br />
have depended upon programmatically<br />
relevant research, but more is<br />
needed. Both motivated researchers<br />
and processes to support such research<br />
are needed. For example, it took the<br />
urging of United Nations agencies and<br />
financing from the Government of<br />
Canada to ensure an analysis of the mortality<br />
impact of vitamin A deficiency.<br />
There is a need for more research<br />
to improve programmes that affect the<br />
hardest-to-reach people, and for determining<br />
the effectiveness of feasible<br />
interventions — for example, how to<br />
encourage increased consumption of<br />
green leafy vegetables. Research institutions,<br />
both industry-based and<br />
academic, need to include the poor<br />
and their day-to-day nutrition problems<br />
on the research agenda.<br />
5. Food production is<br />
important but not enough.<br />
As was demonstrated in the Tanzanian<br />
programmes of Iringa and<br />
Mbeya, nutrition can be improved<br />
even in rather poor communities without<br />
increasing overall food availability.<br />
Increasing food production is<br />
often necessary, but it is never enough<br />
to ensure improvement in nutrition.<br />
Programmes that aim to increase<br />
food production countrywide or in parts<br />
of countries should not claim that nutrition<br />
will be improved in young children<br />
and women unless other specific<br />
and focused measures are implemented<br />
to better their situation.<br />
6. Everyone has an obligation<br />
to child rights.<br />
Children have a valid claim to good<br />
nutrition. The government has an<br />
obligation and many other members<br />
of society and the community, including<br />
parents, have duties to realize<br />
the child’s right to good nutrition.<br />
All of these groups need to become<br />
aware of the nutrition problem, its<br />
causes and consequences, the possibilities<br />
of solutions, and their obligation<br />
to respect, protect, facilitate and<br />
fulfil child rights. They need to know<br />
what to do and how to do it. Advocacy,<br />
information, education and<br />
68
training are all important strategies<br />
to create or increase this necessary<br />
awareness.<br />
7. Community and familybased<br />
involvement is vital.<br />
Children’s rights give them valid<br />
claims on society. In order for poor<br />
people to carry out their duties towards<br />
children, the poor must be recognized<br />
as key actors rather than as<br />
passive beneficiaries.<br />
All available resources, even those<br />
controlled outside the community,<br />
should be used to support processes<br />
within households and the community<br />
that contribute to improved nutrition.<br />
Such processes involve decisions about<br />
the use of resources and the monitoring<br />
of the impact of these decisions.<br />
As described above, households<br />
and communities learn how to search<br />
for better solutions through the process<br />
of assessing the existing situation,<br />
analysing the causes and acting as<br />
available resources permit. Communitybased<br />
monitoring is important in the<br />
repeated assessment of the evolving<br />
situation. Analyses by the community<br />
and by all supporters outside the community<br />
are facilitated by an improved<br />
understanding of the causes of the nutrition<br />
problem.<br />
Outside support includes advocacy,<br />
information, education, training<br />
and direct service delivery. Government<br />
and NGO staff may work outside<br />
the community, but should be in<br />
frequent contact with the community,<br />
functioning as facilitators. They should<br />
focus their support and dialogue on<br />
community mobilizers: people who<br />
are a part of the community and enjoy<br />
its trust and respect.<br />
There is no pre-defined package of<br />
inputs or services that can work.<br />
Instead, the community is constantly<br />
learning about the best mix of interventions,<br />
a mix that can change<br />
significantly over time. Community<br />
development means that desirable<br />
outcomes, such as good nutrition, are<br />
achieved through participatory and<br />
sustainable processes. A combination<br />
of top-down advocacy and mobilization<br />
and a bottom-up demand for support<br />
will ensure that both community<br />
and government feel ownership of<br />
successful changes.<br />
8. Government policies must<br />
reflect the right to nutrition.<br />
Some national policies affect nutrition<br />
directly, such as salt iodization or immunization<br />
programmes, for example.<br />
Others, like income and price<br />
policies, affect nutrition indirectly.<br />
With the ratification of the Convention<br />
on the Rights of the Child,<br />
governments have the obligation to<br />
respect, protect, facilitate and fulfil<br />
the rights enshrined in the Convention.<br />
All policies should therefore be<br />
analysed in terms of their real and<br />
potential impact on the right to good<br />
nutrition.<br />
The most important strategies for<br />
nutrition include those for food, health,<br />
breastfeeding, education, and water<br />
and sanitation, and national nutrition<br />
information systems should be established<br />
to provide valid data about their<br />
impact. Policies should be based on<br />
knowledge from relevant research and<br />
be constantly evaluated for their real<br />
impact on nutrition in communities.<br />
Nutrition information systems should<br />
be as decentralized as the existing<br />
administrative systems, starting with<br />
community-based monitoring.<br />
69
Bringing science to bear<br />
UNICEF/2064/Zaman<br />
Science and technology will<br />
never solve all of the problems<br />
associated with the inadequate<br />
food and care and the lack of health<br />
services and sanitation that lead to<br />
childhood malnutrition. But the successes<br />
stemming from breakthroughs<br />
being made and insights reached have<br />
stirred new hope for healthier, more<br />
productive lives for both children and<br />
adults. This section describes some of<br />
the crucial scientific advances that are<br />
helping to shape specific interventions<br />
to reduce malnutrition or that<br />
may do so in the future.<br />
Some of this knowledge, such as<br />
the strengthening effect of vitamin A<br />
on the immune system, is well established;<br />
other knowledge is just emerging<br />
and is worth watching. Some of<br />
the new science is likely to accelerate<br />
efforts to reduce malnutrition, and at<br />
the same time generate new understanding<br />
of how reducing malnutrition<br />
in childhood or during the prenatal<br />
period may lessen chronic disease in<br />
adulthood and the onerous public health<br />
burden it causes. There are also new<br />
Photo: Over a million pre-school-age<br />
children suffer from vitamin A deficiency,<br />
which affects immune-system functioning.<br />
Vitamin A supplementation is estimated to<br />
lower a child’s risk of dying by 23 per cent.<br />
In Bangladesh, a boy receives a vitamin A<br />
capsule.<br />
tools to tackle the essential task of nutritional<br />
assessment and new ways<br />
that agricultural science can be<br />
brought to bear on the problem.<br />
Nutritionally acquired<br />
immune deficiency<br />
It is estimated that the immune systems<br />
of some 23 million people<br />
worldwide have been damaged by<br />
HIV. 1 It is less well known that malnutrition<br />
impairs the immune systems<br />
of at least 100 million young children<br />
and several million pregnant women,<br />
none of them infected by HIV. But unlike<br />
the situation with AIDS, the<br />
‘cure’ for immune deficiency due to<br />
malnutrition has been known for centuries:<br />
It is achieved by ensuring an<br />
adequate dietary intake containing all<br />
essential nutrients. Today, more is<br />
being learned about the specific role<br />
of individual nutrients in the functioning<br />
of the immune system, knowledge<br />
that will help in the design of interventions<br />
that can improve the situation<br />
in the near future. This knowledge<br />
also reinforces the importance of striving<br />
to ensure that everyone in the<br />
world has access to a diet that is adequate<br />
in both quality as well as quantity.<br />
Scientists have known for some<br />
time that malnutrition and infection<br />
are connected. A 1968 monograph by<br />
WHO, entitled ‘Interactions of Nutri-<br />
The ‘cure’ for immune<br />
deficiency due to<br />
malnutrition has been<br />
known for centuries:<br />
It is achieved by ensuring<br />
an adequate dietary intake<br />
containing all essential<br />
nutrients.<br />
71
Fig. 11 Measles deaths and vitamin<br />
A supplementation<br />
In three separate trials of children hospitalized with<br />
measles — one as early as 1932 — deaths among<br />
children given high-dose vitamin A supplements<br />
were significantly lower than among children not<br />
supplemented. The consistent results suggest that<br />
a change in vitamin A status can rapidly alter basic<br />
physiological functions concerned with cellular<br />
repair and resistance to infection, thereby saving<br />
lives.<br />
Case fatality rate (%)<br />
16<br />
14<br />
12<br />
10<br />
8<br />
6<br />
4<br />
2<br />
0<br />
Non-supplemented<br />
Supplemented<br />
1932 1987 1990<br />
United Kingdom Tanzania South Africa<br />
Source: Alfred Sommer and Keith P. West Jr., Vitamin A<br />
Deficiency: Health, survival and vision, Oxford University<br />
Press, New York, 1996.<br />
tion and Infection’, was one of the first<br />
comprehensive statements of some of<br />
these links.<br />
The threat that vitamin A deficiency<br />
poses to the lives of young<br />
children has already been described.<br />
Within a few years, the scientific community<br />
went from calling the fact that<br />
vitamin A supplements could reduce<br />
child mortality “too good to be true”<br />
to calling it “too good not to be true.”<br />
But the many ways vitamin A deficiency<br />
increases child deaths were not<br />
well understood until recently. Now<br />
the results of a dozen field studies,<br />
conducted in Brazil, Ghana, India,<br />
Indonesia, Nepal and elsewhere, indicate<br />
that supplementing the diets of<br />
children who are at risk of vitamin A<br />
deficiency can reduce deaths from<br />
diarrhoea. Four of the studies that focused<br />
on diarrhoea showed that deaths<br />
were reduced by 35-50 per cent. The<br />
vitamin can also halve the number of<br />
deaths due to measles 2 (Fig. 11).<br />
In Bangladesh, breastfed infants<br />
whose mothers were given a single oral<br />
high-dose supplement of vitamin A<br />
shortly after giving birth had significantly<br />
fewer days of sickness because<br />
of respiratory infections and febrile<br />
illnesses during the first six months of<br />
life than did infants born to unsupplemented<br />
mothers from the same socioeconomic<br />
group in the same area. 3<br />
Zinc is another micronutrient that<br />
has long been known to be essential<br />
for the growth and development of<br />
cells and for the functioning of the<br />
immune system. However, because<br />
zinc deficiency is extremely difficult<br />
to measure, little attention was paid<br />
until recently to the possibility that it<br />
might impair child health and development<br />
(Fig. 12).<br />
Trials in Bangladesh, India and<br />
Indonesia have already shown reductions<br />
of about one third in the duration<br />
and severity of diarrhoea in children<br />
receiving zinc supplements and a<br />
median 12 per cent decline in the incidence<br />
of pneumonia. 4 In these investigations,<br />
zinc supplements did the<br />
most good for those children who<br />
started out the most malnourished.<br />
A study recently completed in<br />
Lima (Peru) found that the benefits of<br />
zinc supplementation on immunity<br />
can begin even before birth. Researchers<br />
from the Johns Hopkins<br />
School of Public Health in Baltimore<br />
(US) and the Instituto de Investigación<br />
Nutricional in Lima have been<br />
adding zinc to the iron and folate<br />
supplements of pregnant women and<br />
testing its impact on the health of their<br />
newborn children, including its effects<br />
on immune system activity. Initial<br />
analysis shows that antibody levels<br />
just after birth are higher in the children<br />
of zinc-supplemented mothers<br />
than in those receiving a placebo.<br />
Zinc supplementation appears so<br />
effective in reducing the incidence of<br />
diarrhoea and pneumonia in poor<br />
countries that one scientist, Robert<br />
Black of Johns Hopkins University,<br />
has suggested that zinc supplements<br />
are as significant a public health intervention<br />
for diarrhoea reduction as improvements<br />
in water and sanitation.<br />
And major new research indicates that<br />
even the effects of malaria, a deadly<br />
enemy of both children and adults, may<br />
be lessened by zinc and vitamin A<br />
(Panel 18).<br />
Iron deficiency can also damage<br />
the immunity of a growing child,<br />
impairing the body’s ability to kill<br />
invading pathogens and leading to<br />
increased illness in iron-deficient<br />
populations. 5 In studies in Egypt,<br />
anaemic children had longer and<br />
more severe episodes of diarrhoea<br />
than did their iron-fortified peers.<br />
Basic science is now able to explain<br />
why these astonishing results<br />
occur. Thus far, zinc and vitamin A<br />
are the two micronutrients that have<br />
proved to be the most closely linked<br />
72
with the proper functioning of the<br />
body’s front-line defences. These two<br />
micronutrients help maintain the<br />
physical barriers of skin and mucosa<br />
that prevent micro-organisms from<br />
invading the body, as well as enhancing<br />
the activity of leukocytes such as<br />
NK (natural killer) cells and macrophages<br />
— scavenger cells that engulf,<br />
then destroy, foreign pathogens such<br />
as bacteria throughout the body.<br />
Equally important, low dietary<br />
consumption of zinc and vitamin A<br />
reduces the number and impairs the<br />
development and function of two<br />
types of B-cells — key players in<br />
‘acquired immunity’. These produce<br />
antibodies and T-cells that, in turn,<br />
are responsible for eliminating virusinfected<br />
host cells. They also produce<br />
biochemicals known as cytokines,<br />
which further promote B-cell and<br />
macrophage activity. At the same<br />
time, an adequate intake of zinc is<br />
now understood to be necessary in<br />
order for both vitamin A and iodine to<br />
do many of their vital jobs.<br />
Nutrition and AIDS<br />
The role of nutrition in preventing infection<br />
is now being investigated as<br />
one possible way to help reduce the<br />
transmission of AIDS. Vitamin A may<br />
form part of the arsenal needed to<br />
combat HIV, which is expected to infect<br />
between 4 million and 5 million<br />
children by early in the next century,<br />
most of them in sub-Saharan Africa.<br />
These children will mainly be infected<br />
by their mothers.<br />
The routes of mother-to-child<br />
transmission of HIV, also known as<br />
vertical transmission, are threefold:<br />
during pregnancy, during labour and<br />
delivery, and through breastfeeding.<br />
Scientists have been exploring the<br />
possibility of reducing vertical transmission<br />
in all three routes since 1994.<br />
They have tried to block intrauterine<br />
transmission by giving women doses<br />
of the antiretroviral drug Zidovudine<br />
during pregnancy. The drug has been<br />
shown to reduce mother-to-child transmission<br />
of HIV — but at hundreds of<br />
dollars per course, it is prohibitively<br />
expensive for most people in the developing<br />
world. Less expensive methods<br />
of antiretroviral therapy during pregnancy,<br />
such as administering Zidovudine<br />
for shorter periods or using<br />
cheaper drugs, are now being tested in<br />
Haiti, sub-Saharan Africa and South-<br />
East Asia.<br />
Two other treatments during pregnancy<br />
are also under investigation.<br />
These involve either intravenous therapy<br />
with purified anti-HIV antibodies, or<br />
supplementation with vitamin A. In a<br />
1994 study of HIV-infected women in<br />
Malawi, it was found that 32 per cent<br />
of those who were vitamin A deficient<br />
during pregnancy had passed HIV on<br />
to their infants. In contrast, only 7 per<br />
cent of HIV-infected women with sufficient<br />
levels of vitamin A did so. The<br />
study concluded that vitamin A-<br />
deficient women were thus four and a<br />
half times more likely to infect their<br />
children. 6<br />
Also, a 1995 study from Kenya<br />
reported that the concentration of HIV<br />
in breastmilk is higher in vitamin A-<br />
deficient mothers than in those with<br />
good vitamin A status. Another study,<br />
also from Kenya, has shown that HIVpositive<br />
women who are also vitamin<br />
A deficient were five times more<br />
likely than non-vitamin A-deficient<br />
women to shed HIV-infected cells in<br />
their reproductive tracts, a factor that<br />
may be an important determinant of<br />
both sexual and vertical transmission<br />
of AIDS. However, some experts have<br />
suggested that these results may have<br />
come about not because of the influence<br />
of vitamin A on HIV transmission,<br />
but because poor vitamin A<br />
status and high rates of infection<br />
occur together for other reasons.<br />
Fig. 12 Zinc supplementation and<br />
child growth (Ecuador, 1986)<br />
Zinc’s importance in ensuring normal growth and<br />
development is underlined in a 1986 study of<br />
Ecuadorian pre-schoolers with low zinc intake. The<br />
children were paired by sex, age and height; one in<br />
each pair was given a zinc supplement, the other a<br />
placebo. The results over 15 months showed a<br />
slow, steady gain in the supplemented children's<br />
height as compared with the non-supplemented<br />
group.<br />
Change in height-for-age Z-score<br />
0.3<br />
0.2<br />
0.1<br />
0<br />
Zinc<br />
Placebo<br />
(0.1)<br />
0 2 4 6 8 10 12 14 16<br />
Months of study<br />
Note: The height-for-age Z-scores in the chart refer to the<br />
number of standard deviations below or above the median<br />
height for healthy children in the same age group.<br />
Source: H. Dirren et al., ‘Zinc supplementation and child<br />
growth in Ecuador’, in Nutrient Regulation during Pregnancy,<br />
Lactation and Infant Growth, Plenum Press, New York, 1994.<br />
73
Panel 18<br />
Zinc and vitamin A: Taking the sting out of malaria<br />
Early evidence from a study in<br />
Papua New Guinea suggests<br />
that zinc and vitamin A supplements<br />
may boost children’s resistance<br />
to one of the world’s most<br />
insidious infectious diseases: malaria.<br />
Two fifths of the world’s population,<br />
in 90 countries across sub-<br />
Saharan Africa, Asia and Central and<br />
South America, is at risk of contracting<br />
malaria. At least 300 million people<br />
worldwide endure its recurrent<br />
fevers, malaise, anaemia and risk of<br />
seizures or coma. Malaria kills from<br />
1.5 million to 2.7 million people annually.<br />
It is the sixth leading cause of<br />
disability among children under four<br />
years of age in the developing world.<br />
Some 600,000 young children die of<br />
malaria alone each year; over 1 million<br />
die of malaria in conjunction<br />
with other illnesses — a rate of one<br />
child every 30 seconds.<br />
Many approaches have already<br />
been tried to combat the disease.<br />
However, the parasite that causes<br />
malaria is no longer vulnerable to<br />
some of the most powerful antimalarial<br />
compounds available. For a<br />
time, the widespread use of pesticides<br />
in the 1950s managed to suppress<br />
the Anopheles mosquito that<br />
transmits the parasite, but it, too, has<br />
developed resistance.<br />
Arming the body to defend itself<br />
through immunization is one approach<br />
to preventing the disease.<br />
But vaccines are difficult to develop<br />
since the parasite moves between<br />
organs, changing its appearance<br />
from stage to stage and hiding from<br />
the immune system in a place that<br />
the immune system doesn’t check:<br />
inside red blood cells. Consequently,<br />
the best vaccines to date have managed<br />
to protect only around 30 per<br />
cent of test populations from infection.<br />
However, naturally acquired resistance<br />
does develop over time as people<br />
are repeatedly exposed to the<br />
parasite. A recent study by the Johns<br />
Hopkins School of Public Health and<br />
the Papua New Guinea Institute of<br />
Medical Research investigated the<br />
UNICEF/97-0558/Clausen<br />
ability of vitamin A and zinc to help<br />
boost such natural resistance.<br />
Nearly 800 children under the age<br />
of five were enrolled in the study. All<br />
of the children lived in an area of<br />
north-western Papua New Guinea<br />
where malarial infection is common.<br />
The parasite that is responsible for<br />
the disease can be found in the blood<br />
of over 40 per cent of under-fives in<br />
the region, and it is the major cause<br />
of death among children from the<br />
age of six months to four years.<br />
In controlled trials, regular vitamin<br />
A and zinc supplementation appeared<br />
to be complementary in<br />
decreasing the burden of malaria in<br />
children. According to Dr. Anuraj<br />
Shankar of Johns Hopkins University,<br />
chief researcher of the study,<br />
vitamin A reduced by more than a<br />
third the febrile illnesses due to mild<br />
to moderately high levels of malaria<br />
parasites in children and significantly<br />
reduced spleen swelling, an indicator<br />
of chronic malaria. However, it had<br />
little influence on the worst cases,<br />
where children had a very high number<br />
of parasites in their blood.<br />
Zinc, on the other hand, helped<br />
blunt the severity of the worst cases.<br />
As a result, there were over a third<br />
fewer malaria cases seen at health<br />
centres among those given zinc than<br />
among those given a placebo. In addition,<br />
overall clinic visits by those children<br />
who had received zinc decreased<br />
by a third, and signs of other infections<br />
(cough and diarrhoea, for example)<br />
were reduced by 20–50 per cent.<br />
The Papua New Guinea experience<br />
shows that vitamin A and zinc<br />
status in children may be as important<br />
in reducing malaria as other<br />
commonly used malaria-control techniques,<br />
such as insecticide spraying<br />
and the use of insecticide-treated<br />
bed nets. And the cost is minimal:<br />
74
A year’s supply of zinc supplements<br />
costs $1 per child, with an<br />
additional 10 cents for vitamin A<br />
capsules.<br />
A second study is under way in<br />
the Peruvian Amazon to measure<br />
the effectiveness of vitamin A and<br />
zinc in boosting the efficacy of<br />
antimalarial drugs. Peruvian scientists<br />
at the Loreto Department<br />
of Health and colleagues from<br />
Johns Hopkins are studying more<br />
than 1,000 children who are suffering<br />
from malaria to see if a short,<br />
five-day course of zinc or vitamin<br />
A in conjunction with antimalarial<br />
drugs improves their health. Some<br />
children are receiving both the<br />
micronutrients, in the hope that<br />
the zinc-vitamin A combination<br />
will be more effective, as zinc is<br />
known to promote vitamin A metabolism<br />
in the body.<br />
Despite the surge of international<br />
interest in malaria from<br />
both the public sector and private<br />
industry and the promise that vitamin<br />
A and zinc may hold, funding<br />
for research into disease<br />
prevention and treatment unfortunately<br />
remains meagre. Currently,<br />
funding levels run at roughly $42<br />
per malaria death, compared with<br />
$3,274 for each AIDS fatality.<br />
Photo: Women and their children wait<br />
outside a UNICEF-assisted health centre<br />
in the Peruvian Amazon, where malaria is<br />
a major health concern.<br />
Based on the findings of the first<br />
studies — and to demonstrate whether<br />
the connection between vitamin A and<br />
HIV transmission is causal — four<br />
clinical trials were begun recently to<br />
examine HIV transmission rates in<br />
women who have received vitamin A<br />
supplements during the second or third<br />
trimester of pregnancy. Results from<br />
these studies, conducted in Malawi,<br />
South Africa, Tanzania and Zimbabwe<br />
on a total of nearly 3,000 HIV-infected<br />
women, are expected soon.<br />
Using nutrition to<br />
reduce maternal<br />
deaths<br />
Maternal mortality is a tragedy in<br />
social, economic and public health<br />
terms. WHO and UNICEF have noted<br />
that of the 585,000 yearly maternal<br />
deaths around the world, the vast majority<br />
are preventable. About 80 per cent<br />
of these deaths are the result of five<br />
direct obstetric causes: haemorrhage,<br />
infection, obstructed labour, unsafe<br />
abortion and a convulsive disorder in<br />
late pregnancy called eclampsia. 7<br />
As already noted, obstructed<br />
labour is more likely to occur among<br />
women who were stunted in childhood<br />
(Fig. 13). It is estimated that<br />
anaemia may be responsible for as<br />
much as 20 per cent of maternal mortality,<br />
particularly those deaths from<br />
haemorrhage and possibly infection.<br />
Anaemia also increases the risk of<br />
morbidity and mortality associated<br />
with any major surgical intervention,<br />
including Caesarean section.<br />
Programmes already exist to<br />
reduce anaemia in pregnant women.<br />
More work is needed, however, not<br />
only to make iron/folate supplementation<br />
programmes more effective, but<br />
also to improve the treatment and prevention<br />
of malaria and hookworm.<br />
Both of these are conditions that also<br />
contribute to maternal anaemia.<br />
Fig. 13 Maternal height and<br />
Caesarean delivery (Guatemala,<br />
1984-1986)<br />
The importance of good nutrition for girls and<br />
women is affirmed in a mid-1980s' study of<br />
pregnant Guatemalan women, which found that<br />
the risk of having an intrapartum Caesarean<br />
delivery was 2.5 times higher in short mothers<br />
than in tall mothers. Short stature in women is<br />
often a consequence of poor growth in early<br />
childhood.<br />
Incidence of intrapartum Caesarean delivery (%)<br />
100<br />
80<br />
60<br />
40<br />
20<br />
With foetal distress<br />
Without foetal distress<br />
0<br />
125 135 145 155 165 175 185<br />
Maternal height (cm)<br />
Source: Kathleen M. Merchant and José Villar, ‘How do<br />
maternal and newborn size affect risk of foetal distress<br />
and intrapartum Caesarean delivery?’ (draft).<br />
75
Spotlight: Vitamin A<br />
Impact of deficiency<br />
Vitamin A deficiency makes children especially<br />
vulnerable to infection and worsens<br />
the course of many infections.<br />
Supplementation with vitamin A is estimated<br />
to lower a child’s risk of dying by<br />
approximately 23 per cent. The deficiency<br />
is also the single most important cause of<br />
blindness among children in developing<br />
countries.<br />
Who is affected<br />
Over 100 million pre-school-age children<br />
suffer from vitamin A deficiency. Vitamin<br />
A deficiency is also likely to be widespread<br />
among women in their reproductive<br />
years in many countries.<br />
What vitamin A does<br />
Vitamin A, stored normally in the liver, is<br />
crucial for effective immune-system functioning,<br />
protecting the integrity of epithelial<br />
cells lining the skin, the surface of the<br />
eyes, the inside of the mouth and the<br />
alimentary and respiratory tracts. When<br />
this defence breaks down in a vitamin A-<br />
deficient child, the child is more likely to<br />
develop infections, and the severity of an<br />
infection is likely to be greater.<br />
Depending on the degree of the deficiency,<br />
a range of abnormalities also appears<br />
in the eyes of vitamin A-deficient<br />
children. In the mildest form, nightblindness<br />
occurs because the rods in the<br />
eye no longer produce rhodopsin, a pigment<br />
essential for seeing in the dark. In<br />
more severe forms, lesions occur on the<br />
conjunctiva and the cornea that if left<br />
untreated can cause irreversible damage,<br />
including partial or total blindness.<br />
Sources<br />
Vitamin A is found as retinol in breastmilk,<br />
liver, eggs, butter and whole cow’s milk.<br />
Carotene, a precursor of vitamin A that is<br />
converted to retinol in the abdominal<br />
walls, is found in green leafy vegetables,<br />
orange and yellow fruits, and red palm oil.<br />
Even if an adequate nutritional status<br />
were achieved in adolescent girls<br />
and women before their first pregnancy,<br />
this would never eliminate the<br />
need for good medical care in pregnancy<br />
and childbirth. But some day it<br />
may help reduce the tragic burden of<br />
maternal mortality and the need for<br />
certain medical interventions. Some<br />
of the connections between nutrition<br />
and maternal mortality suggested<br />
below are not yet definitively demonstrated<br />
or part of programme activities,<br />
but they hold great promise for<br />
the future. A few are especially worth<br />
mentioning:<br />
t Even given the many known benefits<br />
of good vitamin A status, it is<br />
nonetheless remarkable to find that<br />
improving the vitamin A status of<br />
pregnant women whose intake of the<br />
vitamin is low also dramatically reduces<br />
maternal mortality (Panel 1).<br />
Deadly infections in pregnancy, as in<br />
childhood, find a formidable adversary<br />
in vitamin A. The use of lowcost,<br />
low-dose vitamin A capsules as<br />
well as improvements in diet make it<br />
highly probable that this new research<br />
will be easily incorporated into<br />
programmes.<br />
t Zinc deficiency, increasingly recognized<br />
as widespread among women<br />
in developing countries, is associated<br />
with long labour, which increases the<br />
risk of death. Severe zinc deficiency<br />
is also believed to impair foetal development<br />
in a number of ways. Zinc is<br />
important for the synthesis of hormones<br />
and enzymes essential to<br />
childbirth — especially estrogendependent<br />
functions such as expulsion<br />
of the placenta and proper contraction<br />
of uterine muscles during birth — as<br />
well as for immune-system development.<br />
A number of studies around the<br />
world have found that zinc supplementation<br />
has reduced complications<br />
of pregnancy. Several studies are<br />
under way that will soon help define<br />
the impact of improved zinc status on<br />
pregnant women.<br />
t It has long been known that iodine<br />
deficiency in women increases the<br />
risk of stillbirths and miscarriages.<br />
And there is evidence that, in highly<br />
iodine-deficient areas, another result<br />
of this deficiency may be increased<br />
maternal mortality through severe<br />
hypothyroidism.<br />
t A recent study in the United States<br />
showed that calcium supplementation<br />
did not reduce the risk of hypertension<br />
in pregnancy that could result in<br />
death, but a number of experts have<br />
suggested that supplementation might<br />
reduce this risk in areas where women<br />
are especially calcium deficient.<br />
t Folate deficiency, now well known<br />
to induce neural-tube birth defects if<br />
it is present during the first month of<br />
pregnancy, may also represent a risk<br />
for maternal morbidity and mortality,<br />
as well as increase the risk of low<br />
birthweight.<br />
The clear message emerging from<br />
these connections is that improving<br />
women’s nutritional status — by increasing<br />
their intake of micronutrients<br />
as well as their overall food consumption,<br />
and by taking steps to reduce<br />
their workload and improve their<br />
access to health care — may offer<br />
considerable, low-cost benefits in reducing<br />
maternal deaths. But there is<br />
still no international consensus on the<br />
benefits to be gained by supplementation<br />
during pregnancy with nutrients<br />
other than iron and folate.<br />
The real challenge is to reach<br />
women well before they become<br />
pregnant — indeed, to help adolescent<br />
girls achieve the best nutritional<br />
status possible before they enter their<br />
reproductive years. This would not<br />
only help reduce maternal mortality<br />
but would also reduce the prevalence<br />
of low birthweight, the risk of birth<br />
defects and the rates of stillbirths and<br />
early infant mortality. All of these re-<br />
76
Spotlight: Zinc<br />
main scientific and programmatic<br />
challenges, along with the imperative<br />
of ensuring that women’s health is<br />
positioned high on the health and<br />
development agendas of all countries.<br />
Breastfeeding:<br />
Good for mothers’<br />
health too<br />
In addition to the nutritional status of<br />
adolescent girls and women, there is<br />
another important connection between<br />
nutrition and maternal mortality. A<br />
number of studies have shown a strong<br />
link between the early initiation of<br />
breastfeeding and reduced risk of<br />
postpartum haemorrhage.<br />
Initiating breastfeeding immediately<br />
following birth, as most women<br />
do in baby-friendly hospitals, stimulates<br />
the contraction of the uterus and<br />
reduces blood loss. For this reason,<br />
the continuing spread of the Baby-<br />
Friendly Hospital Initiative should<br />
also contribute to the reduction of<br />
maternal mortality.<br />
In recent years, research has also<br />
demonstrated that this immediate<br />
post-partum benefit is by no means<br />
the only way in which breastfeeding<br />
can improve women’s health. A recent<br />
large-sample study in the United<br />
States demonstrated that women who<br />
breastfed their children had a lower<br />
risk of breast cancer in the premenopausal<br />
period, and the longer<br />
they breastfed, the lower the risk. 8<br />
These results show that protecting,<br />
promoting and supporting breastfeeding<br />
has benefits for women that go beyond<br />
the remarkable effects, already<br />
well understood, that protect their<br />
children from illness and death.<br />
Prevention of chronic<br />
diseases<br />
Chronic degenerative diseases are<br />
largely regarded as diseases of affluence.<br />
In industrialized countries, improvements<br />
in living standards and<br />
health care have led to increased life<br />
expectancy, allowing people to live<br />
long enough to develop such chronic<br />
illnesses. Chronic diseases are also<br />
associated with the sedentary lifestyle<br />
and over-abundant diet prevalent in<br />
many industrialized nations.<br />
Arguments are being made, however,<br />
that these chronic diseases in<br />
large measure may also be diseases of<br />
poverty — particularly poverty early<br />
in life and during foetal development.<br />
The hypothesis is particularly intriguing<br />
in light of the fact that ischaemic<br />
heart disease is projected to be the<br />
world’s leading cause of death and<br />
disability in the year 2020. 9<br />
Professor David Barker and his<br />
colleagues at the Medical Research<br />
Council (MRC) Environmental Epidemiology<br />
Unit in Southampton (UK),<br />
first raised the “foetal origins of adult<br />
disease” hypothesis over a decade ago,<br />
noting a link between low birthweight<br />
and the incidence of cardiovascular<br />
disease among middle-aged men and<br />
women born in the United Kingdom. 10<br />
Since then, over 30 studies around<br />
the world have indicated that lowbirthweight<br />
babies who were not born<br />
prematurely have a higher incidence<br />
of hypertension later in life than those<br />
with a normal birthweight, 11 independent<br />
of their social class and such<br />
adult risk factors as smoking, drinking<br />
and overeating.<br />
Low birthweight, as well as thinness<br />
at birth, has also been correlated<br />
with glucose intolerance in childhood 12<br />
and non-insulin dependent diabetes in<br />
later life. 13<br />
Professor Barker and his colleagues<br />
speculate that maternal dietary imbalances<br />
at critical periods of development<br />
in the womb can trigger a<br />
redistribution of foetal resources, affecting<br />
a foetus’s structure and metabolism<br />
in ways that predispose the<br />
Impact of deficiency<br />
Zinc deficiency in malnourished children<br />
contributes to growth failure and susceptibility<br />
to infections. Zinc deficiency is<br />
also thought to be associated with<br />
complications of childbirth.<br />
Who is affected<br />
Data on the prevalence of zinc deficiency<br />
are unavailable, as there is no reliable<br />
method of determining zinc status at the<br />
population level. Zinc deficiency is likely<br />
to be a public health problem, however,<br />
in areas where overall malnutrition is<br />
prevalent; it is now recognized as such<br />
in many countries.<br />
What zinc does<br />
Zinc promotes normal growth and<br />
development. It forms part of the<br />
molecular structure of 80 or more known<br />
enzymes that work with red blood cells<br />
to move carbon dioxide from tissues to<br />
lungs. Zinc also helps maintain an effective<br />
immune system. Severe zinc deficiency<br />
causes growth retardation,<br />
diarrhoea, skin lesions, loss of appetite,<br />
hair loss and, in boys, slow sexual<br />
development. Zinc has now been<br />
shown to have a therapeutic effect<br />
on diarrhoea cases.<br />
Sources<br />
Breastmilk has small amounts of zinc<br />
that are readily absorbed. Other sources<br />
include whole-grain cereals, legumes,<br />
meat, chicken and fish. Vegetables and<br />
fruits contain little zinc but when eaten<br />
with cereals may increase the bioavailability<br />
of zinc in cereals.<br />
77
Spotlight: Iron<br />
Impact of deficiency<br />
Iron deficiency anaemia, the most common<br />
nutritional disorder in the world, impairs<br />
immunity and reduces the physical and<br />
mental capacities of populations. In infants<br />
and young children, even mild anaemia<br />
can impair intellectual development.<br />
Anaemia in pregnancy is an important<br />
cause of maternal mortality, increasing<br />
the risk of haemorrhage and sepsis<br />
during childbirth. Infants born to anaemic<br />
mothers often suffer from low birthweight<br />
and anaemia themselves. Causes include<br />
blood loss associated with menstruation<br />
and parasitic infections such as hookworm,<br />
but an inadequate intake of iron is the<br />
main cause.<br />
Who is affected<br />
Nearly 2 billion people are estimated to<br />
be anaemic and even more are iron<br />
deficient, the vast majority of them women.<br />
Between 40 and 50 per cent of children<br />
under five in developing countries —<br />
and over 50 per cent of pregnant<br />
women — are iron deficient.<br />
What iron does<br />
The body needs iron to produce haemoglobin,<br />
the protein in red blood cells responsible<br />
for carrying oxygen. Iron is also<br />
a component of the many enzymes essential<br />
for the adequate functioning of brain,<br />
muscle and the immune-system cells.<br />
A certain amount of iron is stored in<br />
the liver, spleen and bone marrow. Iron<br />
deficiency develops as these stores are<br />
depleted and there is insufficient iron<br />
absorption. In anaemia, the iron deficiency<br />
is so severe that the production of<br />
haemoglobin is significantly reduced.<br />
The main symptoms and signs are paleness<br />
of the tongue and inside the lips,<br />
tiredness and breathlessness. Deficiencies<br />
of folic acid, vitamin A, ascorbic acid,<br />
riboflavin and various minerals can also<br />
contribute to anaemia.<br />
Sources<br />
Iron is found in liver, lean meats, eggs,<br />
whole-grain breads and molasses.<br />
individual to later cardiovascular and<br />
endocrine diseases. The correlation<br />
between low birthweight and later<br />
cardiovascular disease and diabetes<br />
may arise from the fact that nutritional<br />
deprivation in utero ‘programmes’<br />
a newborn for a life of<br />
scarcity. The problems arise when the<br />
child’s system is later confronted by a<br />
world of plenty. 14<br />
In central India, an ambitious study<br />
has been funded by UK Welhome Trust<br />
and coordinated by Dr. Ranjan Yajnik<br />
at the King Edward Memorial Hospital<br />
Research Centre in Pune (India)<br />
and Dr. Caroline Fall at the MRC<br />
Environmental Epidemiology Unit. It<br />
is exploring the impact that a mother’s<br />
nutrition may have on the development<br />
of diabetes, high blood pressure<br />
and coronary heart disease in her offspring<br />
when they reach adulthood.<br />
The results could resolve some of the<br />
uncertainties about causation of chronic<br />
illness, offering nutritional information<br />
relevant to both developing and<br />
industrialized countries.<br />
The study has followed over 800<br />
women through pregnancy, monitoring<br />
foetal growth, maternal weight<br />
gain and biochemical indicators of nutritional<br />
status. 15 The nutritional value<br />
of the women’s daily food intake —<br />
including calorie, protein and micronutrient<br />
content — was measured and<br />
recorded. Within 24 hours of birth,<br />
both infant and placenta were weighed<br />
and other body measurements made. 16<br />
Almost one third of the nearly 800 infants<br />
born during the study were classified<br />
as low birthweight, under 2.5 kg. 17<br />
An interesting early finding suggests<br />
that birthweights are most strongly associated<br />
with the size of the mother —<br />
not just her weight gain during pregnancy,<br />
a well-known determinant of<br />
newborn size, but also her weight,<br />
height, percentage of body fat and<br />
head circumference before conception.<br />
The weight and body mass index of<br />
many of the women before pregnancy<br />
suggested chronic undernutrition. The<br />
study also suggested that women’s<br />
diet during pregnancy did not appear<br />
to have influenced foetal size substantially,<br />
although regular consumption<br />
of two particular items — green leafy<br />
vegetables and dairy products — was<br />
associated with larger birth size. These<br />
early findings lend support to the<br />
premise that building a sturdy baby<br />
depends on good nutrition for the expectant<br />
mother throughout her life.<br />
The children from the Pune study<br />
are growing up in a society of increasing<br />
urbanization and prosperity. Urban<br />
dwellers in India are already five<br />
times more likely to develop diabetes<br />
than their rural relatives, 18 and those<br />
who have migrated to industrialized<br />
countries like the United Kingdom die<br />
in significantly larger numbers from<br />
coronary heart disease than their<br />
indigenous white counterparts. 19<br />
In 1999, the first of the children in<br />
the study will be tested for signs of<br />
glucose intolerance and insulin resistance;<br />
these are early hints of diabetes<br />
that have already been noted in children<br />
of low birthweight in Pune. 20<br />
Soon after, blood pressure monitoring<br />
will begin in an effort to look for initial<br />
signs of hypertension. As the<br />
study progresses, findings can be related<br />
back to birth size, foetal growth<br />
and maternal diet before and during<br />
pregnancy. From an undertaking of this<br />
magnitude, clear evidence may emerge<br />
about the importance of improving<br />
maternal nutrition as a means of preventing<br />
chronic later-life disease in<br />
children — before these children have<br />
children of their own.<br />
New ways to reduce<br />
malnutrition deaths<br />
in emergencies<br />
The sheer extent of mild and moderate<br />
malnutrition makes these conditions<br />
78
Spotlight: Iodine<br />
responsible for much more sickness<br />
and death globally than does severe<br />
malnutrition. But a severely malnourished<br />
child — usually defined as under<br />
70 per cent of the median weight-forheight<br />
reference or having oedema<br />
(water retention and swelling) at least<br />
in the feet — is at very high risk of<br />
death, and requires prompt and intensive<br />
care in a health facility.<br />
Until recently, health professionals<br />
dealing with severe malnutrition in<br />
emergency situations or in large hospitals<br />
in poor countries had been<br />
using an approach practised for years.<br />
The protocol was to treat infectious<br />
conditions, correct rehydration and<br />
feed, at least in the early stages, with<br />
high-energy milk — usually a combination<br />
of dried skim milk, vegetable<br />
oil and sugar. In the last few<br />
years, however, with the help of<br />
WHO and the benefit of the experience<br />
of a number of NGOs specializing<br />
in this field, the new protocol is<br />
improving the treatment of severe<br />
malnutrition.<br />
While the new protocol retains<br />
some elements of former standard<br />
practices, there are significant changes.<br />
The milk now recommended for the<br />
early stages of therapeutic feeding,<br />
for example, is enhanced by the addition<br />
of both oil and a vitamin and<br />
mineral mix, which addresses the<br />
special micronutrient imbalance that<br />
accompanies severe malnutrition.<br />
Called F-100 because it gives 100<br />
kilocalories per 100 grammes, the<br />
milk optimizes the chance for rapid<br />
weight gain and the eventual recovery<br />
of a severely malnourished child.<br />
Another important change is a new<br />
recommendation calling for modification<br />
of the standard oral rehydration<br />
salts (ORS) to address the special<br />
electrolyte needs of severely malnourished<br />
children. The use of standard<br />
ORS has been known to increase risk<br />
of heart failure and sudden death<br />
among certain severely malnourished<br />
children. The revised ORS reduces<br />
that risk. Known as ReSoMal (rehydration<br />
solution for malnutrition), it<br />
contains more potassium and different<br />
concentrations of elements from<br />
those in standard ORS.<br />
The new protocol for the care of<br />
the severely malnourished also emphasizes<br />
elements that have been<br />
known by nutrition workers for some<br />
time, but perhaps not well enough to<br />
be integrated into regular practice.<br />
These include the need for rapid attention<br />
to clinical factors, such as low<br />
body temperature (hypothermia) and<br />
low body sugar (hypoglycaemia), as<br />
well as to less strictly medical factors<br />
such as meeting malnourished children’s<br />
great needs for emotional support,<br />
intellectual stimulation and play.<br />
Experienced emergency nutrition personnel<br />
working in places such as the<br />
Great Lakes region of Central Africa<br />
and the Democratic People’s Republic<br />
of Korea have adopted this method<br />
and noted how quickly it helps reduce<br />
mortality. One challenge is to ensure<br />
that supplies of the appropriate highenergy<br />
milk and rehydration solution<br />
are steady and sufficient (Panel 19).<br />
New ways to measure<br />
malnutrition<br />
Much of the new knowledge described<br />
above will contribute to effective<br />
actions to reduce malnutrition<br />
and related conditions. But even when<br />
actions are effective, assessing their<br />
impact is often difficult. Measuring<br />
malnutrition initially can also pose<br />
problems — and make it difficult to<br />
place the issue on the policy and programme<br />
agenda.<br />
There is thus a need for assessment<br />
and analysis techniques that are low<br />
in cost, produce rapid results and are<br />
easy to use and understand. Here are<br />
some of the promising new tools:<br />
Impact of deficiency<br />
Iodine deficiency is the single most<br />
important cause of preventable brain<br />
damage and mental retardation, most of<br />
the damage occurring before birth. It also<br />
significantly raises the risk of stillbirth<br />
and miscarriage for pregnant women.<br />
Who is affected<br />
The successful global campaign to iodize<br />
all edible salt is reducing the risk associated<br />
with this deficiency, which threatened<br />
1.6 billion people as recently as<br />
1992. Nevertheless, it is estimated that<br />
43 million people worldwide are suffering<br />
from varying degrees of brain damage;<br />
there are an estimated 11 million overt<br />
cretins. Some 760 million people have<br />
goitres.<br />
What iodine does<br />
Iodine is needed by the thyroid gland for<br />
normal mental and physical development.<br />
Most commonly and visibly associated<br />
with goitre (a swelling of the neck as the<br />
enlarged thyroid works to collect iodine<br />
from the blood), iodine deficiency takes a<br />
graver toll in impaired mental acuity.<br />
Persons suffering from IDD face a range<br />
of serious impairments including cretinism,<br />
spastic diplegia (a spastic paralysis of the<br />
lower limbs) and dwarfism. Less severe<br />
deficiencies in both adults and children<br />
can mean the loss of 10 to 15 intelligence<br />
quotient (IQ) points, as well as impaired<br />
physical coordination and lethargy.<br />
Sources<br />
Iodized salt is the best source of iodine.<br />
Sea fish and some seaweed also contain<br />
iodine, although sea salt does not.<br />
79
Panel 19<br />
Protecting nutrition in crises<br />
When refugees stream into a<br />
country, when families lose<br />
their homes, fields and<br />
crops in war or disaster, when children<br />
cry from hunger, it is not surprising<br />
that food can seem like the<br />
only priority and the only answer to<br />
averting widespread malnutrition.<br />
But in emergencies as well as in<br />
other situations, food, health and<br />
care are all crucial to saving lives.<br />
Access to basic health services and<br />
water and sanitation facilities is essential<br />
in emergencies not only to<br />
keep children alive, but also to protect<br />
their growth and development.<br />
To prevent outbreaks of measles,<br />
mass immunization usually along<br />
with the distribution of vitamin A<br />
supplements has become standard<br />
practice in emergencies. In Haiti, for<br />
example, a measles vaccination campaign<br />
in 1994-1995 reached almost 3<br />
million children, helping end an epidemic<br />
that began when the country<br />
was in the midst of civil unrest.<br />
UNICEF/94-0277/Press<br />
Preventing death and malnutrition<br />
from cholera and other diarrhoeal<br />
diseases — through adequate<br />
sanitation, access to safe water and<br />
oral rehydration therapy — saved<br />
thousands of children’s lives in the<br />
recent emergencies in Rwanda and<br />
Somalia. This is standard practice in<br />
the current emergency in Burundi,<br />
for example.<br />
Breastfeeding is an important element<br />
of nutrition-related ‘care’ in<br />
emergencies. There has been marked<br />
progress in this area as governments<br />
and agencies become increasingly<br />
sensitive to supporting women’s ability<br />
to breastfeed. Workers with some<br />
NGOs that specialize in preventing<br />
malnutrition in times of crisis have<br />
had success in recent years in promoting<br />
relactation — helping women<br />
who may have been separated from<br />
their children to begin breastfeeding<br />
again after having stopped.<br />
Sometimes infant formula must<br />
be used in emergencies — for instance,<br />
when young children have<br />
been separated from their mothers.<br />
In these cases, all UN agencies working<br />
in emergencies and many NGOs<br />
have committed to supplying only<br />
generically labelled (no brand name)<br />
formula, to prevent commercial exploitation<br />
of emergency situations.<br />
During the conflict in Bosnia and<br />
Herzegovina, UNICEF and other UN<br />
agencies jointly urged that infant formula<br />
distribution be severely limited,<br />
and relief organizations subsequently<br />
ended mass distribution programmes<br />
in January 1995. UNICEF and WHO<br />
strongly promoted breastfeeding,<br />
targeting health workers and joining<br />
with local health professionals during<br />
and after the war to develop a national<br />
policy on infant feeding.<br />
Children ages 6 to 18 months,<br />
pregnant women and women who<br />
are breastfeeding all need energydense,<br />
nutrient-dense foods. In emergencies,<br />
the approach to meeting<br />
these special needs varies. Agencies<br />
that are part of the International Federation<br />
of Red Cross and Red Crescent<br />
Societies, for example, try to<br />
provide a family ration to meet everyone’s<br />
requirements, including those<br />
of children and pregnant and breastfeeding<br />
women. The World Food Programme<br />
and some other agencies<br />
generally distribute a ration that meets<br />
minimum needs and, in addition, they<br />
cover vulnerable groups with supplementary<br />
feeding programmes. The<br />
comparative benefits of the two approaches<br />
need to be evaluated.<br />
Triple A — assessment, analysis<br />
and action — is an essential approach<br />
in emergencies as well as in other situations.<br />
Monitoring children’s nutritional<br />
status, with weight-for-height<br />
a commonly used indicator, is crucial<br />
during emergencies to help target resources<br />
and reach the most affected.<br />
80
Early warning systems and<br />
emergency preparedness are costeffective<br />
means to prevent malnutrition<br />
in emergencies. The<br />
United Nations Department of<br />
Humanitarian Affairs’ early warning<br />
system draws on the work of<br />
similar systems within and outside<br />
the United Nations in preparing<br />
comprehensive assessments<br />
of potential emergency situations,<br />
and UNHCR and other agencies<br />
have set up rapid deployment<br />
mechanisms for emergencies.<br />
Nonetheless, early warning systems<br />
and emergency planning<br />
and preparedness remain sadly<br />
underfinanced, a shortfall that endangers<br />
children in particular when<br />
crises loom.<br />
Photo: Health workers vaccinate two<br />
girls at a camp for unaccompanied<br />
Rwandan refugee children in the<br />
Democratic Republic of the Congo.<br />
t A simplified way to look for vitamin<br />
A: Population-level surveys of vitamin<br />
A status have been a particular challenge.<br />
In the past, when it was thought<br />
that the main impact of vitamin A deficiency<br />
was damaged eyes and blindness,<br />
population surveys of vitamin A<br />
status involved examining children’s<br />
eyes for early signs of damage. Now<br />
that it is understood that this deficiency<br />
has lethal consequences on a subclinical<br />
level — that is, at levels of deficiency<br />
that do not yet show up as damage to<br />
the eye — more sensitive methods of<br />
detecting its presence are needed.<br />
Most of the national or regional vitamin<br />
A surveys that have been conducted<br />
in recent years have used<br />
blood retinol as the principal indicator<br />
of vitamin A status. There are some<br />
difficulties with the interpretation of<br />
this indicator, and it is expensive and<br />
difficult to collect and analyse the<br />
venous blood samples needed for<br />
these surveys.<br />
A new technique that promises to<br />
be easier, cheaper and less invasive is<br />
‘dark adaptometry’. This method,<br />
which has been tested and found effective<br />
in several field situations, 21<br />
takes advantage of the fact that in very<br />
early stages of vitamin A deficiency<br />
the ability of the pupil of the eye to<br />
constrict under illumination is impaired.<br />
By flashing a simple handheld<br />
light at one pupil and covering<br />
the other, the degree of impairment of<br />
the pupillary reflex can be estimated.<br />
It is hoped that this simple method,<br />
which is non-invasive, will become<br />
widely available soon.<br />
t ‘Dipsticks’ for iodine deficiency:<br />
Iodine deficiency disorders (IDD) can<br />
be assessed in populations by palpating<br />
goitres, but this method requires a<br />
high level of training and is less useful<br />
as goitres begin to disappear with<br />
better access to iodized salt.<br />
81
Interaction and stimulation are essential to<br />
sound nutrition as well as intellectual and<br />
emotional development. In China, a boy<br />
delights in his meal and the attention of<br />
his aunt.<br />
UNICEF/93-1726/Lemoyne<br />
Since iodine excreted in the urine<br />
is a good indicator of iodine consumed,<br />
IDD can be reliably detected<br />
by analysing urine samples. Many<br />
countries have undertaken urinary iodine<br />
surveys, which involve collecting<br />
samples, preserving them carefully<br />
and sending them to a laboratory for<br />
analysis in a central location.<br />
A new technique may eliminate<br />
some of those steps and much of the<br />
cost. A reagent-treated testing strip or<br />
‘dipstick’ now being developed will<br />
simplify the procedure by allowing<br />
the iodine content of urine to be<br />
analysed and read directly on the spot<br />
without transporting samples to a laboratory.<br />
It is hoped that this tool will<br />
soon be available for field surveys.<br />
t Improved test kits for iodized salt:<br />
Simple iodized salt test kits have<br />
helped make salt-testing a community<br />
affair. Anyone can use the small plastic<br />
bottles of test solution that cause<br />
salt to turn blue if it is iodized, and<br />
some countries have distributed these<br />
kits to schoolchildren, teachers and<br />
community workers. The test kits,<br />
however, have a limited shelf life, and<br />
they do not distinguish very sensitively<br />
among levels of salt iodization.<br />
Work is now under way to improve the<br />
test kit in both these respects and make<br />
it an even more useful assessment tool.<br />
t Computerizing anaemia surveys:<br />
Thanks to computer chips, assessment<br />
of anaemia at the population<br />
level is becoming easier. There have<br />
been methods for some time to assess<br />
peripheral blood (from a fingertip, for<br />
example) without sending the samples<br />
to a laboratory, but some of them<br />
are slow and inaccurate.<br />
Portable electronic haemoglobinometers<br />
are now available, however,<br />
that enable blood to be drawn easily<br />
from a finger into a small cuvette that<br />
is inserted directly into a machine that<br />
gives a digital read-out of the precise<br />
haemoglobin level in a few seconds.<br />
The wider use of these machines in<br />
population surveys will help to raise<br />
awareness of the enormous magnitude<br />
of the anaemia problem.<br />
New ways to<br />
enrich diets<br />
There are many ways to enhance<br />
foods to improve the content of the vitamins<br />
and minerals that are so important<br />
for the well-being of children and<br />
their families. Food fortification is<br />
one very important way of doing this,<br />
and has already helped overcome<br />
micronutrient deficiencies in many<br />
industrialized countries and some<br />
developing ones.<br />
But many of the world’s poorest<br />
people eat locally grown crops that<br />
cannot be fortified. Agricultural scientists<br />
are now demonstrating that<br />
staple crops can be modified in several<br />
ways at the breeding stage, with<br />
great nutritional benefit.<br />
The grains and tubers on which<br />
the vast majority of people in the developing<br />
world depend have certain<br />
inherent shortcomings nutritionally.<br />
For one thing, these staples tend not<br />
to provide all the minerals and vitamins<br />
needed to ensure good nutrition.<br />
In addition, cereals, depending<br />
on several factors, including the degree<br />
to which they are refined, contain<br />
substances that impede the<br />
‘bioavailability’ of some important<br />
minerals — the ability of the body to<br />
absorb and use them. The most important<br />
of these substances is known<br />
as phytate, a molecule containing<br />
phosphorus. Micronutrients usually<br />
come from non-staple foods — animal<br />
products, vegetables and fruits.<br />
But the poorest populations often<br />
cannot afford these foods and depend<br />
on the grains and tubers they can afford.<br />
This fact helps explain the high<br />
82
Spotlight: Folate<br />
prevalence of some micronutrient<br />
deficiencies.<br />
Agricultural research has turned to<br />
the science of plant breeding to improve<br />
this situation. The goal is to develop<br />
staple food crops that contain<br />
higher quantities of essential micronutrients<br />
— or lower amounts of<br />
phytate. In this connection, work is<br />
currently being done in the United<br />
States to develop low-phytate grain<br />
foods for animal consumption. Such<br />
grains hold nutritional promise for<br />
people as well, according to the results<br />
of a recent study, which found<br />
that human volunteers absorbed iron<br />
at a significantly higher rate from<br />
foods prepared using a new lowphytate<br />
strain of corn than from an<br />
older higher-phytate strain. 22<br />
The Consultative Group on International<br />
Agricultural Research, made<br />
up of 17 internationally funded agricultural<br />
research centres, is trying to<br />
raise farm productivity and food consumption<br />
in developing countries.<br />
The group is now coordinating a<br />
global effort to increase the micronutrient<br />
content of five major staple food<br />
crops: rice, wheat, maize, beans and<br />
cassava. The aim is to breed plants<br />
that load high amounts of vitamins<br />
and minerals into their edible parts —<br />
and also into their seeds, allowing<br />
them to enrich themselves for subsequent<br />
harvests without changing their<br />
taste, texture, or the ease with which<br />
they are grown.<br />
In developed countries, such crops<br />
have already been successfully produced:<br />
high-zinc wheat, for example,<br />
is being grown in Australia. Estimates<br />
are that it will take 6 to 10 years to<br />
breed comparable new plants in developing<br />
countries. Scientists believe<br />
that they will not only improve the<br />
daily dietary intake in the developing<br />
world but will also significantly<br />
increase crop yields because these<br />
micronutrient-dense plants have better<br />
germination and more resistance to infection<br />
at the vulnerable seedling stage.<br />
More effective action<br />
for nutrition<br />
improvement<br />
The technical advances described in<br />
this report, whether new research on<br />
nutrition and illness or better ways to<br />
detect problems, are not magic bullets.<br />
They will contribute to sustainable<br />
improvement in nutrition only if<br />
they sharpen the ability of people, including<br />
the poor, to assess and analyse<br />
the causes of malnutrition around<br />
them — and to plan and carry out appropriate<br />
responses.<br />
Recent advances in the fields of<br />
social science and communication<br />
will also help accelerate and sharpen<br />
people’s ability to take control of<br />
actions to reduce malnutrition.<br />
Actions described here to improve<br />
child nutrition and thereby improve<br />
growth, resistance to illness and cognitive<br />
development need to be coupled<br />
with other highly effective<br />
low-cost interventions that have already<br />
been proven to prevent disease<br />
and improve child development.<br />
Some of these have yet to be<br />
widely exploited. For example, intestinal<br />
worms, which contribute to<br />
poor growth and development, can be<br />
combated through routine deworming<br />
using low-cost drugs that are both<br />
very safe and highly effective (Panel<br />
20). And child deaths from malaria<br />
can be reduced through the use of insecticide-impregnated<br />
mosquito nets.<br />
These measures have not received adequate<br />
global attention and resources,<br />
even though every child has a right to<br />
their benefits.<br />
Actions to prevent malnutrition in<br />
young children also need to be linked<br />
to efforts to promote early child development<br />
through stimulating play<br />
and early learning, and by strengthen-<br />
Impact of deficiency<br />
Folate deficiency causes birth defects in<br />
the developing foetus during the earliest<br />
weeks of pregnancy — before most<br />
women are aware that they are pregnant.<br />
Folate deficiency has been found to be<br />
associated with a high risk of pre-term<br />
delivery and low birthweight, though it is<br />
not clear that this would hold in all populations.<br />
Folate deficiency also contributes<br />
to anaemia, especially in pregnant and<br />
lactating women.<br />
Who is affected<br />
Although data are not abundant, in several<br />
developing countries women in their<br />
reproductive years have been found to<br />
have very high rates of folate deficiency.<br />
Young children are also likely to be at risk.<br />
What folate does<br />
This B vitamin helps in the formation of<br />
red blood cells. Folate also regulates the<br />
nerve cells at the embryonic and foetal<br />
stages of development, helping to prevent<br />
serious neural tube defects (of the<br />
brain and/or spinal cord).<br />
Sources<br />
Folate is found in almost all foods, but<br />
the best sources are liver, kidney, fish,<br />
green leafy vegetables, beans and<br />
groundnuts.<br />
83
Panel 20<br />
Progress against worms for pennies<br />
Asked to name the most widespread<br />
diseases, few people<br />
would think of including worms.<br />
Yet, helminth (worm) infections are<br />
indeed one of the most common —<br />
and neglected — of diseases, affecting<br />
more than 30 per cent of the<br />
world’s people. Health, productivity<br />
and physical and mental capacity<br />
may all suffer.<br />
Children in developing countries<br />
are the most severely affected, particularly<br />
those between the ages of 5<br />
and 14, in whom intestinal worms account<br />
for up to 12 per cent of total<br />
disease burden — the largest single<br />
contributor. While the impact of<br />
worms on health and growth is commonly<br />
believed to be most significant<br />
in children after they reach the<br />
age of five, a new study in India links<br />
worm infection with growth faltering<br />
in children between one and four<br />
years old.<br />
As many as 150,000 children die<br />
each year from intestinal obstruction<br />
UNICEF/5847/Vilas<br />
and other abdominal complications<br />
caused by large adult worms. In millions<br />
more, worms are a significant<br />
cause of malnutrition, stunting growth<br />
and causing severe anaemia, dysentery,<br />
delayed puberty and problems<br />
with learning and memory. In 1990,<br />
an estimated 44 million pregnant<br />
women were infected with hookworm;<br />
their foetuses, therefore, were<br />
at risk of retarded intrauterine growth,<br />
prematurity and low birthweight.<br />
Transmission is insidiously easy,<br />
especially where hygiene and sanitation<br />
are inadequate. A child walking<br />
barefoot can pick up hookworm; by<br />
putting a dirty finger in her mouth,<br />
she may ingest roundworm eggs. It<br />
is not uncommon for a child to carry<br />
up to 1,000 hookworms, roundworms<br />
and whipworms that deplete<br />
blood and nutrients.<br />
Overall, about 1.5 billion people<br />
have roundworms, making it the<br />
third most common human infection<br />
in the world. Whipworm infects 1 billion<br />
people, including nearly one third<br />
of all children in Africa. More than 1.3<br />
billion people carry hookworm in<br />
their gut, and 265 million people are<br />
infected with schistosomes, the parasites<br />
that cause the debilitating disease<br />
of schistosomiasis.<br />
Worms affect nutrition in several<br />
ways, ingesting blood and leading to<br />
the loss of iron and other nutrients.<br />
Worms also cause the lining of the<br />
intestines to change, which reduces<br />
the surface membrane available for<br />
digestion and absorption. As a result,<br />
fat, certain carbohydrates, proteins<br />
and several vitamins (including vitamin<br />
A) are not absorbed properly.<br />
Lactose intolerance and poor use of<br />
available iron can also result.<br />
Treatment is simple and relatively<br />
inexpensive. A single dose of antiworm<br />
medicine such as Mebendazole<br />
costs as little as 3 cents and<br />
can eliminate or significantly reduce<br />
intestinal worm infections. The total<br />
cost of treatment programmes is typically<br />
$1 to $2 per year per person.<br />
Controlled experiments in India,<br />
Indonesia, Malaysia, Myanmar and<br />
Tanzania have proved that the therapy<br />
works for months at a time.<br />
UNICEF, WHO and the World Bank<br />
have identified pre-school and schoolage<br />
children, women of childbearing<br />
age and adolescent girls as those<br />
who would benefit most from worm<br />
control programmes.<br />
The benefits are impressive. An<br />
innovative study in Kenya in 1994,<br />
which used motion detectors on the<br />
thighs of school children, found that<br />
ridding the youngsters of high levels<br />
of hookworm improved physical activity.<br />
Dewormed children reported<br />
better appetites and an end to abdominal<br />
pains and headaches. Within<br />
nine weeks, the treated group showed<br />
better growth, weight gain (both in<br />
84
terms of fat deposits and muscle<br />
mass), physical activity and appetite<br />
than the untreated group.<br />
Numerous studies have also<br />
noted the mental and cognitive effects<br />
of anaemia in children infected<br />
with worms, with intellectual<br />
performance improving after<br />
treatment.<br />
In a large-scale study done in<br />
India in 1996, two groups of children<br />
ages one to four years received<br />
twice-yearly vitamin A supplements;<br />
one group was also<br />
given deworming tablets. At the<br />
end of the trial, the children in the<br />
group given worm treatment<br />
were on average 1 kg heavier<br />
than the children who were not<br />
treated. The study shows not only<br />
that mass deworming can improve<br />
the weights of young children<br />
in areas where worms are<br />
common, but it also opens up the<br />
practical possibility of combining<br />
worm treatment with vitamin A<br />
supplementation in areas at risk.<br />
Some believe that deworming<br />
is not a satisfactory solution because<br />
it must be repeated in the<br />
absence of improved sanitation,<br />
hygiene and health education,<br />
and reinfection occurs frequently.<br />
Nevertheless, periodic deworming<br />
reduces helminths’ drain on<br />
children’s development at critical<br />
times in their lives, at least until<br />
the causes and conditions of environmental<br />
contamination and infection<br />
are successfully addressed.<br />
Photo: One of the most common infections<br />
in the world, worms impede children’s<br />
growth and cause anaemia. Learning and<br />
memory suffer. Here, a girl attends<br />
school in India.<br />
ing interaction with parents and peers.<br />
The parents of young children everywhere<br />
need regular contact with<br />
people who can help check their children’s<br />
growth and development and<br />
can provide advice and support on<br />
breastfeeding and complementary<br />
feeding. In many communities, parents<br />
and caregivers will also need<br />
both advice on and access to supplements<br />
of vitamin A, iron, iodine and<br />
other micronutrients. Support in these<br />
areas might best be provided through<br />
established formal institutions —<br />
health centres, clinics or pre-school<br />
centres (Panel 21). But where such facilities<br />
do not exist or do not function,<br />
children cannot wait for them to be<br />
built or staffed.<br />
Communities must receive overall<br />
support in their efforts to ensure<br />
that all families have access to basic<br />
preventive actions to improve the<br />
nutrition of children and pregnant<br />
women. This includes strengthened<br />
health services to prevent and treat<br />
disease, and increased support to<br />
stimulate early child learning, care<br />
and development.<br />
None of the preventive and supportive<br />
actions to promote child growth<br />
and development described in this report<br />
require a doctor or nurse or a<br />
trained educator. Communities can be<br />
helped to organize themselves to provide<br />
or administer these services, and<br />
in most communities, groups that can<br />
take on these responsibilities already<br />
exist. Communities can also be<br />
helped to assess their own priority<br />
problems and can learn to monitor the<br />
effectiveness of their actions, redesigning<br />
their own programmes accordingly.<br />
Combined with the use of<br />
effective low-cost technologies, the<br />
adoption of these measures could result<br />
in rapid improvements not only in<br />
child survival but also in child development,<br />
nutritional status and learning<br />
capacity.<br />
A girl enjoys an ear of corn in the United<br />
States, where researchers have developed a<br />
new strain of corn that increases the body’s<br />
ability to absorb iron.<br />
UNICEF/97-0423/Toutounji<br />
85
Panel 21<br />
Child nutrition a priority for the new South Africa<br />
Under apartheid, South Africa<br />
had a highly sophisticated<br />
medical research infrastructure<br />
that served the white minority,<br />
pioneering heart transplants, for example.<br />
Yet the majority of the people<br />
were left with poor health and nutrition<br />
care. The advent of democratic<br />
rule in 1994, however, changed all<br />
that. The Government is now reorienting<br />
the health system to the<br />
needs of the majority, and child nutrition<br />
is a priority.<br />
Establishing a community-level<br />
nutrition monitoring system is an important<br />
part of this effort, and one<br />
area where this approach is taking<br />
shape is the Bergville district of<br />
KwaZulu-Natal Province. Child health<br />
and nutrition problems in the province<br />
are among the most challenging<br />
in the country. Over half the children<br />
UNICEF/South Africa<br />
live in poverty, nearly 40 per cent<br />
have vitamin A deficiency, up to one<br />
quarter of the children in rural areas<br />
are stunted, and iodine deficiency is<br />
a problem in mountainous areas. Ten<br />
per cent of children ages six months<br />
to five years suffer from anaemia,<br />
which is also prevalant among pregnant<br />
women, and low birthweight is<br />
common.<br />
In the Bergville district, with a<br />
population of 120,000, a network of<br />
community health workers and health<br />
assistants is being trained as part of<br />
the new Child Survival Programme.<br />
The approach, based on regular<br />
weighing of young children in their<br />
homes to monitor growth, is similar<br />
to that used successfully in other developing<br />
countries during the past<br />
decade. Health workers will use the<br />
weighing sessions to discuss children’s<br />
growth with their families, reinforcing<br />
positive trends and exploring<br />
reasons behind faltering<br />
growth to devise solutions. To carry<br />
out the programme, the number of<br />
community health workers in the district<br />
will be expanded significantly.<br />
The main objective is to cover all<br />
families, including the poorest and<br />
most marginalized.<br />
Community participation in planning<br />
and operating health services is<br />
at the core of the programme. Community<br />
members formed a health<br />
forum in 1994, which serves as the<br />
steering committee of the Child Survival<br />
Programme. The group has<br />
helped establish a district hospital<br />
board and local committees to supervise<br />
health workers and has organized<br />
workshops on the new<br />
programme.<br />
Since 1996, resources for health<br />
care have been channelled more equitably<br />
to disadvantaged provinces<br />
such as KwaZulu-Natal, and this will<br />
help finance the improved health services.<br />
The University of Natal in<br />
Pietermaritzburg is taking a leading<br />
role in supporting child growth monitoring<br />
in the Bergville district. In addition,<br />
World Vision of South Africa,<br />
an NGO which has been active in<br />
the district since 1980, has helped lay<br />
the groundwork for the programme<br />
through various community development<br />
projects. These include local<br />
leadership training, skills training for<br />
women’s groups, support for a preschool<br />
and crèche programme and<br />
cooperation with the health service<br />
in addressing malnutrition.<br />
The new system for monitoring<br />
growth is sorely needed, according<br />
to a recent survey, which found that<br />
while most mothers had a health services<br />
card for monitoring child growth,<br />
many of the cards were either left<br />
86
lank or were incomplete. The<br />
survey also found that very little<br />
nutritional counselling had accompanied<br />
growth monitoring.<br />
The new programme faces<br />
many difficulties: Resources are<br />
stretched, personnel must be<br />
trained and there must be outreach<br />
into communities. Nonetheless,<br />
the new partnerships being<br />
forged between government, the<br />
university, NGOs and communities<br />
represent an approach that<br />
holds promise for the future.<br />
A major effort to tackle vitamin<br />
A deficiency is also under way.<br />
Within months after the new Government<br />
took office, the South<br />
African Vitamin A Consultative<br />
Group launched the country’s<br />
largest-ever nutrition survey, covering<br />
nearly 20,000 households.<br />
The survey found that one third of<br />
children ages six months to five<br />
years are vitamin A deficient or on<br />
the borderline. The Government<br />
and non-governmental partners<br />
are gearing up to address the problem.<br />
Steps planned include giving<br />
vitamin A supplements to young<br />
children and to mothers shortly<br />
after giving birth, fortifying staple<br />
foods with vitamin A and encouraging<br />
the production and consumption<br />
of vitamin A-rich foods.<br />
It has often been said that meeting<br />
this challenge is a matter of political<br />
will. In a $28 trillion global economy,<br />
the problem is surely not a lack of resources.<br />
But it may be more useful to<br />
see the challenge as a matter of political<br />
choice. Governments in poor and<br />
rich countries alike may choose to<br />
allow children to be intellectually disabled,<br />
physically stunted and vulnerable<br />
to illness in childhood and later<br />
life. This is the price of doing little or<br />
nothing to ensure good nutrition.<br />
But governments could instead resolve<br />
to move to consolidate lessons<br />
already learned about reducing malnutrition.<br />
They could do everything<br />
possible to mount massive actions<br />
that can clearly succeed and that can<br />
be implemented by communities themselves.<br />
And they could encourage<br />
research on, and implementation of,<br />
new and better actions.<br />
For the well-being and protection<br />
of children and the human development<br />
of the world, the course of action<br />
is clear.<br />
Governments could instead<br />
resolve to move to consolidate<br />
lessons already learned about<br />
reducing malnutrition. They<br />
could do everything possible<br />
to mount massive actions that<br />
can clearly succeed and that<br />
can be implemented by<br />
communities themselves.<br />
Photo: In South Africa, community health<br />
workers weigh children and discuss<br />
growth promotion with their families.<br />
87
References<br />
The silent emergency<br />
1. Gillespie, Stuart, ‘Increased Maternal<br />
Mortality Risk’, section 5.1 in Major<br />
Issues in Developing Effective<br />
Approaches for the Prevention and<br />
Control of Iron Deficiency: An<br />
overview prepared for the<br />
Micronutrient Initiative and UNICEF,<br />
work in progress, September 1996<br />
(first draft).<br />
2. Draper, Alizon, ‘Child Development and<br />
Iron Deficiency: Early action is critical<br />
for healthy mental, physical and social<br />
development’, The Oxford Brief,<br />
Opportunities for Micronutrient<br />
Interventions, Washington, D.C.,<br />
May 1997.<br />
3. World Bank, World Development<br />
Report 1993: Investing in health,<br />
Oxford University Press, Washington,<br />
D.C., 1993, p. 77, col. 1.<br />
4. World Bank, Enriching Lives:<br />
Overcoming vitamin and mineral<br />
malnutrition in developing countries,<br />
World Bank, Washington, D.C., 1994,<br />
p. 2; ‘Total GDP Table 1995’, World<br />
Development Indicators 1997<br />
(CD-ROM), International Bank for<br />
Reconstruction and Development/<br />
World Bank, Washington, D.C., 1997.<br />
5. Draper, Alizon, op. cit., p. 1.<br />
6. Maberly, Glenn F., ‘ Iodine Deficiency<br />
in Georgia: Progress towards<br />
elimination, Summary Report’, The<br />
Program Against Micronutrient<br />
Malnutrition, Atlanta, April-May 1997,<br />
p. 1, col. 3.<br />
7. Martorell, Reynaldo, ‘The Role of<br />
Nutrition in Economic Development’,<br />
Nutrition Reviews, Vol. 54, No. 4, April<br />
1996, p. S70.<br />
8. In accordance with international<br />
terminology recommended by WHO,<br />
readings that are three or more<br />
standard deviations from the<br />
reference median (based on a<br />
reference population of American<br />
children) are referred to as ‘severely<br />
malnourished’, while those between<br />
two and three standard deviations are<br />
called ‘moderately malnourished’.<br />
9. Young, Helen and Susanne Jaspars,<br />
Nutrition Matters: People, food and<br />
famine, Intermediate Technology<br />
Publications, London, 1995, p. 17.<br />
10. UNICEF, ‘Food, Health and Care’,<br />
UNICEF, New York, updated edition,<br />
November 1996, p. 13.<br />
11. Draper, Alizon, op cit., p. 1.<br />
12. What Governments Can Do: Seventh<br />
annual report on the state of world<br />
hunger, Bread for the World Institute,<br />
Silver Spring, 1997, p. 8.<br />
13. Ibid., p. 10.<br />
14. Philip, W. et al., ‘The contribution of<br />
nutrition to inequalities in health’,<br />
British Medical Journal, Vol. 314,<br />
British Medical Association, London,<br />
24 May 1997, p. 1545.<br />
15. ‘Children at Risk in Central and Eastern<br />
Europe: Perils and promises’,<br />
Economies in Transition Studies,<br />
Regional Monitoring Report, No. 4,<br />
UNICEF, International Child Development<br />
Centre, Florence, 1997, p. 43.<br />
16. Fogel, Robert W., ‘Economic Growth,<br />
Population Theory and Physiology:<br />
The bearing of long-term processes<br />
on the making of economic policy’,<br />
The American Economic Review, Vol.<br />
84, No. 3, The American Economic<br />
Association, Nashville, June 1994,<br />
pp. 369-395.<br />
17. Grantham-McGregor, Sally, ‘A Review<br />
of Studies of the Effect of Severe<br />
Malnutrition on Mental Development’,<br />
The Journal of Nutrition, Supplement,<br />
Vol. 125, No. 8S, The American<br />
Institute of Nutrition, Bethesda, 1995,<br />
p. 2235S.<br />
18. Cole, Michael and Sheila R. Cole,<br />
‘Prenatal Development’, The<br />
Development of Children, Scientific<br />
American Books, New York and<br />
Oxford, 1989, p. 72.<br />
19. Nash, Madeleine J., ‘Fertile Minds’,<br />
Special Report, Time, Vol. 149, No. 5,<br />
3 February 1997, p. 52.<br />
20. Landers, Cassie, ‘A Theoretical Basis<br />
for Investing in Early Child<br />
Development: Review of current<br />
concepts’, Innocenti Global Seminar<br />
on Early Child Development, UNICEF<br />
International Child Development<br />
Centre, Florence, 1989, p. 4.<br />
21. Hanson, Lars A. et al., ‘Effects of<br />
breastfeeding on the baby and on its<br />
immune system’, Food and Nutrition<br />
Bulletin, Vol. 17, No. 4, United Nations<br />
University Press, Tokyo, December<br />
1996, p. 384.<br />
22. De Zoysa, I., M. Rea and J. Martines,<br />
‘Why promote breastfeeding in<br />
diarrhoeal disease control<br />
programmes?’, Health Policy Planning,<br />
Oxford University Press, 1991, 6:371-379,<br />
as cited in ‘A warm chain for<br />
breastfeeding’, The Lancet, Vol. 344,<br />
No. 8932, 5 Nov. 1994, p. 1239.<br />
23. Glick, Daniel, ‘Rooting for Intelligence,’<br />
Newsweek, Special Edition, Newsweek,<br />
New York, Spring/Summer 1997, p. 32.<br />
24. UNDP, Human Development Report<br />
1997, UNDP, New York, pp. 164-165.<br />
25. UNICEF, WATERfront, Issue 8, UNICEF,<br />
New York, August 1996, p. 16.<br />
26. UNDP, Human Development Report<br />
1997, p. 29.<br />
27. United Nations, Progress made in<br />
providing safe water supply and<br />
sanitation for all during the first half of<br />
the 1990s: Report of the Secretary-<br />
General, United Nations, New York,<br />
A/50/213-E/1995/87, 8 June 1995, table<br />
1, p. 5.<br />
28. UNICEF, The Progress of Nations 1997,<br />
p. 12.<br />
29. US Department of Agriculture study<br />
(1990) cited in Tufts University, School<br />
of Nutrition, Center on Hunger, Poverty<br />
and Nutrition Policy, ‘Statement on the<br />
Link Between Nutrition and Cognitive<br />
Development in Children’, 1995, p. 8.<br />
88
30. Landers, op. cit., p. 7.<br />
31. United Nations, The World’s Women<br />
1995: Trends and statistics, Social<br />
Statistics and Indicators, Series K,<br />
No.12, United Nations, New York, 1995,<br />
p. 108.<br />
32. Holmboe-Ottesen, Gerd, Ophelia<br />
Mascarenhas and Margareta Wandel,<br />
‘Women’s Role in Food Chain Activities<br />
and the Implications for Nutrition’,<br />
ACC/SCN State-of-the-Art Series,<br />
Nutrition Policy Discussion Paper No.<br />
4, United Nations, New York, May<br />
1989, p. 37.<br />
Approaches that work<br />
1. Gillespie, Stuart, John Mason and<br />
Reynaldo Martorell, ‘How Nutrition<br />
Improves’, ACC/SCN State-of-the-Art<br />
Series, Nutrition Policy Discussion<br />
Paper No. 15, United Nations, New<br />
York, July 1996.<br />
2. ‘International Code of Marketing of<br />
Breastmilk Substitutes’, World Health<br />
Organization, Geneva, 1981, pp. 6-7.<br />
3. UNICEF, The Progress of Nations 1997,<br />
UNICEF, New York, 1997, p. 21.<br />
4. Micronutrient Initiative, Ottawa,<br />
facsimile dated 14 Oct. 1997.<br />
5. Sommer, Alfred et al., ‘Impact of<br />
vitamin A supplementation on<br />
childhood mortality: A randomised<br />
controlled community trial’, The<br />
Lancet, 1986, Vol. 1, pp. 1169-1173.<br />
6. Beaton, G. H. et al., ‘Effectiveness of<br />
Vitamin A Supplementation in the<br />
Control of Young Child Morbidity and<br />
Mortality in Developing Countries’,<br />
ACC/SCN State-of-the-Art Series,<br />
Nutrition Policy Discussion Paper<br />
No. 13, United Nations, December<br />
1993, p. 61.<br />
7. Ross, David A. et al., ‘Vitamin A<br />
supplementation in northern Ghana:<br />
Effects on clinic attendances, hospital<br />
admissions and child mortality’, The<br />
Lancet, Vol. 342, 3 July 1993, pp. 7-12.<br />
8. Katz, J. et al., ‘Night blindness is<br />
prevalent during pregnancy and<br />
lactation in rural Nepal’, Department<br />
of International Health, Johns Hopkins<br />
School of Hygiene and Public Health,<br />
Baltimore, Journal of Nutrition,<br />
August 1995.<br />
9. Gillespie, Stuart, John Kevany and<br />
John Mason, ‘Controlling Iron<br />
Deficiency: A report based on an<br />
ACC/SCN workshop’, United Nations,<br />
Geneva, February 1991, p. 4.<br />
10. Alnwick, David, ‘More for Less in<br />
Combating Iron Deficiency? Update on<br />
the Effectiveness of Weekly<br />
Supplements’, Research in Action, No.<br />
2, UNICEF, New York, November 1995,<br />
p. 1; Schultink, W. et al., ‘Effect of daily<br />
vs. twice weekly iron supplementation<br />
in Indonesian preschool children with<br />
low iron status’, American Journal of<br />
Clinical Nutrition, Vol. 61, American<br />
Society for Clinical Nutrition, 1995,<br />
pp. 111-115.<br />
11. Layrisse, M. et al., ‘Early response to<br />
the effect of iron fortification in the<br />
Venezuelan population’, American<br />
Journal of Clinical Nutrition, Vol. 64,<br />
1996, pp. 905-906.<br />
12. Stoltzfus, R. J. et al., ‘Epidemiology<br />
iron deficiency in Zanzibari<br />
schoolchildren: The importance of<br />
hookworms’, American Journal of<br />
Clinical Nutrition, Vol. 65, 1997, p. 157.<br />
13. United Nations, Progress at Mid-<br />
Decade on Implementation of General<br />
Assembly resolution 45/217 on the<br />
World Summit for Children: Report of<br />
the Secretary-General, United<br />
Nations, New York, A/51/256, 26 July<br />
1996, p. 30, para. 130.<br />
14. Lewnes, Alexia, Oral Rehydration<br />
Therapy: Elixir of life, UNICEF,<br />
New York, February 1997, p. 3.<br />
Bringing science to bear<br />
1. Piot, Peter, ‘Fighting AIDS together’,<br />
The Progress of Nations 1997, UNICEF,<br />
New York, 1997, p. 23.<br />
2. Sommer, Alfred and Keith P. West, Jr.,<br />
Vitamin A Deficiency: Health, survival<br />
and vision, Oxford University Press,<br />
New York and Oxford, 1996, pp. 41, 48,<br />
66-70.<br />
3. Roy, S. K. et al., ‘Impact of a single<br />
megadose of vitamin A at delivery on<br />
breastmilk of mothers and morbidity of<br />
their infants’, European Journal of<br />
Clinical Nutrition, No. 51, Stockton<br />
Press, 1997.<br />
4. ‘Zinc for Child Health: Child Health<br />
Research Project Special Report’,<br />
Report of a meeting, Baltimore,<br />
Maryland, 17-19 Nov. 1996, Vol. 1,<br />
No. 1, June 1997, p. 8.<br />
5. ‘Improving Iron and Zinc Nutrition in<br />
Infancy and Early Childhood:<br />
Proceedings of the Bali Consultation<br />
Meeting for the Planning of Multi-<br />
Country Iron and Zinc Intervention<br />
Trials’, in Bali, Indonesia, 4-6 February<br />
1997, UNICEF, 1997, pp. 6-7.<br />
6. Semba, Richard D., ‘Will vitamin A<br />
supplementation reduce mother-tochild<br />
transmission of HIV?’ Research<br />
in Action, No. 5, UNICEF, New York,<br />
July 1996.<br />
7. Adamson, Peter, ‘A failure of<br />
imagination’, The Progress of Nations<br />
1996, UNICEF, New York, 1996, p. 8.<br />
8. Rasmussen, Kathleen M. and Michelle<br />
K. McGuire, ‘Effects of breastfeeding<br />
on maternal health and well-being’,<br />
Food and Nutrition Bulletin, Vol. 17,<br />
No. 4, United Nations University Press,<br />
1996, p. 366.<br />
9. Murray, Christopher J. L. and Alan D.<br />
Lopez (eds.), The Global Burden of<br />
Disease, Harvard School of Public<br />
Health, Cambridge, 1996, pp. 360-367.<br />
10. Barker, David J. P., Mothers, Babies<br />
and Disease in Later Life, BMJ<br />
Publishing, London, 1994.<br />
11. Law, Catherine M. and Alistair W.<br />
Shiell, ‘Is blood pressure inversely<br />
related to birth weight? The strength<br />
of evidence from a systematic review<br />
of the literature’, Journal of<br />
89
Hypertension, Vol. 14, No. 8, 1996,<br />
pp. 935-941.<br />
12. Law, C. M. et al., ‘Thinness at birth and<br />
glucose tolerance in seven-year-old<br />
children’, Diabetic Medicine, 1995,<br />
12:24-29.<br />
13. Hales, C. N. et al., ‘Fetal and infant<br />
growth and impaired glucose<br />
tolerance at age 64’, British Medical<br />
Journal, Vol. 303, 26 Oct. 1991, pp.<br />
1019-1022; Phipps, K. et al., ‘Fetal<br />
growth and impaired glucose<br />
tolerance in men and women,<br />
Diabetologia, 1993, 36:225-228;<br />
McCance, David R. et al., ‘Birth weight<br />
and non-insulin dependent diabetes:<br />
Thrifty genotype, thrifty phenotype, or<br />
surviving small baby genotype?’,<br />
British Medical Journal, Vol. 308, 1994,<br />
pp. 942-945.<br />
14. Barker, op. cit.; Hales, C. N. and<br />
D. J. P. Barker, ‘Type 2 (non-insulin<br />
dependent) diabetes mellitus:<br />
The thrifty phenotype hypothesis’,<br />
Diabetologia, 1992, 35:595-601.<br />
15. The Smallest Babies in the World,<br />
video, MRC Environmental<br />
Epidemiology Unit, Southampton, 1996.<br />
16. A study of maternal nutrition and<br />
intrauterine fetal growth, King Edward<br />
Memorial Hospital Research Centre<br />
Annual Report 1995-1996, KEMHRC,<br />
Pune, 1996, p. 36.<br />
20. Among 201 four-year-old children<br />
born in Pune of known birthweight,<br />
those who were 2.4 kg or less at birth<br />
had mean glucose and insulin<br />
concentrations 8.1 mM (micromole)<br />
and 321 pM (picamole) respectively<br />
30 minutes after an oral glucose<br />
challenge; in comparison children<br />
born 3.0 kg or heavier had a mean<br />
glucose concentration of 7.5 mM and<br />
a mean blood insulin level of 289 pM.<br />
From Yajnik, M. et al., ‘Fetal growth<br />
and glucose and insulin metabolism in<br />
four-year-old Indian children’,<br />
Diabetic Medicine, Vol. 12, 1995,<br />
pp. 330-336.<br />
21. Congdon, N. et al., ‘Pupillary and<br />
visual thresholds in young children<br />
as an index of population vitamin A<br />
status’, American Journal of Clinical<br />
Nutrition, Vol. 61, The American<br />
Society of Clinical Nutrition, May<br />
1995, pp. 1076-1082; Sanchez, A. M. et<br />
al., ‘Pupillary threshold as an index of<br />
population vitamin A status among<br />
children in India’, American Journal<br />
of Clinical Nutrition, Vol. 65, January<br />
1997, pp. 61-66.<br />
22. Mendoza, C. et al., ‘Effect of<br />
Genetically Modified, Low-Phytate<br />
Maize on Iron Absorption from<br />
Tortillas’, article submitted to<br />
Experimental Biology ’97<br />
(unpublished).<br />
17. ‘Proceedings of the Third Annual<br />
Workshop on the Fetal and Early<br />
Origins of Adult Disease’, meeting in<br />
Khandala, Maharashtra, India,<br />
September 1996, p. 6.<br />
18. Fall, Caroline, Ranjan Yajnik and<br />
Shobha Rao, personal<br />
communication, 1997.<br />
19. McKeigue, P. M., G. J. Miller and<br />
M. G. Marmot, ‘Coronary heart<br />
disease in South Asians overseas:<br />
A review’, Journal of Clinical<br />
Epidemiology, Vol. 42, No. 7, United<br />
Kingdom, 1989, pp. 597-609.<br />
90
Chapter II<br />
Statistical tables<br />
Economic and social statistics on the nations of the world, with<br />
particular reference to children’s well-being.<br />
GENERAL NOTE ON <strong>THE</strong> DATA PAGE 92<br />
EXPLANATION <strong>OF</strong> SYMBOLS PAGE 92<br />
UNDER-FIVE MORTALITY RANKINGS PAGE 93<br />
REGIONAL SUMMARIES COUNTRY LIST PAGE 122<br />
GLOSSARY PAGE 131<br />
Tables<br />
1 BASIC INDICATORS PAGE 94<br />
2 NUTRITION PAGE 98<br />
3 HEALTH PAGE 102<br />
4 EDUCATION PAGE 106<br />
5 DEMOGRAPHIC INDICATORS PAGE 110<br />
6 ECONOMIC INDICATORS PAGE 114<br />
7 WOMEN PAGE 118<br />
8 <strong>THE</strong> RATE <strong>OF</strong> PROGRESS PAGE 124<br />
91
General note<br />
on the data<br />
Four major changes have been made to the<br />
statistical tables in The State of the World’s<br />
Children <strong>1998</strong> report.<br />
First, the less populous countries, which<br />
were previously presented in a separate table,<br />
have been merged into the main tables. Each<br />
of the eight tables now lists 193 countries.<br />
Second, only independent, sovereign countries<br />
are listed; these include all countries<br />
that are members of the United Nations and<br />
all countries that have ratified the Convention<br />
on the Rights of the Child.<br />
Third, countries are now listed alphabetically<br />
in each table rather than in descending<br />
order of their under-five mortality rate (U5MR).<br />
However, because this rate is a crucial indicator,<br />
countries ranked in order of their U5MR are<br />
listed on the page opposite this note. Every<br />
table also includes a column providing the<br />
U5MR rank of each country. The index to<br />
countries, which appeared before table 1 in<br />
previous reports, has been eliminated.<br />
Fourth, the regional summary for each<br />
table now appears with its relevant table.<br />
The data presented in these tables are<br />
accompanied by definitions, sources and explanations<br />
of symbols. The tables are derived<br />
from many sources and thus will inevitably<br />
contain a wide range of data quality. Official<br />
government data received by the responsible<br />
United Nations agency have been used whenever<br />
possible. In the many cases where there<br />
are no reliable official figures, estimates<br />
made by the responsible United Nations<br />
agency have been used. Where such internationally<br />
standardized estimates do not exist,<br />
the tables draw on other sources, particularly<br />
data received from the appropriate UNICEF<br />
field office. Where possible, only comprehensive<br />
or representative national data have<br />
been used.<br />
Data quality is likely to be adversely<br />
affected for countries that have recently<br />
suffered from man-made or natural disasters.<br />
This is particularly so where basic country<br />
infrastructure has been fragmented or major<br />
population movements have occurred.<br />
Data for life expectancy, total fertility<br />
rate, crude birth and death rates, etc. are part<br />
of the regular work on estimates and projections<br />
undertaken by the United Nations<br />
Population Division. These and other internationally<br />
produced estimates are revised<br />
periodically, which explains why some of the<br />
data will differ from those found in earlier<br />
UNICEF publications.<br />
In addition, the statistical tables in the<br />
present report contain new data from recent<br />
Multiple Indicator Cluster Surveys. These<br />
surveys were carried out in 1995 and 1996 by<br />
more than 60 countries worldwide as a<br />
means of assessing the progress made for<br />
children in the context of the goals of the<br />
World Summit for Children.<br />
Two new indicators have also been introduced.<br />
‘Per cent of routine EPI vaccines<br />
financed by government’, the first of these<br />
new indicators, appears in table 3. This indicator<br />
reflects a country’s capacity to immunize<br />
children as an integral part of its health<br />
care system. It replaces the previous indicator<br />
entitled ‘per cent of population with access<br />
to health services’, which although of interest<br />
to many has been eliminated because of the<br />
poor quality of the data.<br />
‘Per cent of population below $1 per day’,<br />
the second new indicator, can be found in<br />
table 6. This indicator is now used by the<br />
World Bank and is a more explicit monetary<br />
measure of international poverty than the indicator<br />
it replaces. Previous reports defined<br />
absolute poverty as the income level below<br />
which a minimum nutritionally adequate diet,<br />
plus essential non-food requirements, was<br />
not affordable.<br />
Explanation of<br />
symbols<br />
Since the aim of this statistics chapter is to<br />
provide a broad picture of the situation of<br />
children and women worldwide, detailed data<br />
qualifications and footnotes are seen as more<br />
appropriate for inclusion elsewhere. Only<br />
three symbols are used to classify the table<br />
data.<br />
- Indicates data are not available.<br />
x<br />
y<br />
Indicates data that refer to years or periods<br />
other than those specified in the column<br />
heading, differ from the standard definition,<br />
or refer to only part of a country.<br />
Indicates that survey data were used for<br />
estimating net primary school enrolment<br />
(in table 4 only).<br />
92
Under-five mortality<br />
rankings<br />
The following list ranks countries in descending<br />
order of their estimated 1996 under-five mortality<br />
rate (U5MR). Countries are listed alphabetically<br />
in the tables that follow.<br />
U5MR U5MR<br />
Country rate rank<br />
Niger 320 1<br />
Angola 292 2<br />
Sierra Leone 284 3<br />
Afghanistan 257 4<br />
Liberia 235 5<br />
Guinea-Bissau 223 6<br />
Mali 220 7<br />
Malawi 217 8<br />
Mozambique 214 9<br />
Somalia 211 10<br />
Guinea 210 11<br />
Congo, Dem. Rep. 207 12<br />
Zambia 202 13<br />
Nigeria 191 14<br />
Mauritania 183 15<br />
Ethiopia 177 16<br />
Burundi 176 17<br />
Equatorial Guinea 173 18<br />
Cambodia 170 19<br />
Rwanda 170 19<br />
Central African Rep. 164 21<br />
Madagascar 164 21<br />
Burkina Faso 158 23<br />
Djibouti 157 24<br />
Côte d’Ivoire 150 25<br />
Myanmar 150 25<br />
Chad 149 27<br />
Gabon 145 28<br />
Tanzania 144 29<br />
Uganda 141 30<br />
Benin 140 31<br />
Lesotho 139 32<br />
Pakistan 136 33<br />
Haiti 134 34<br />
Lao People’s Dem. Rep. 128 35<br />
Bhutan 127 36<br />
Senegal 127 36<br />
Togo 125 38<br />
Comoros 122 39<br />
Iraq 122 39<br />
Eritrea 120 41<br />
Nepal 116 42<br />
Sudan 116 42<br />
Bangladesh 112 44<br />
Papua New Guinea 112 44<br />
India 111 46<br />
Ghana 110 47<br />
Congo 108 48<br />
Gambia 107 49<br />
Yemen 105 50<br />
Bolivia 102 51<br />
Cameroon 102 51<br />
Swaziland 97 53<br />
Marshall Islands 92 54<br />
Kenya 90 55<br />
Guyana 83 56<br />
Sao Tome and Principe 80 57<br />
Egypt 78 58<br />
U5MR U5MR<br />
Country rate rank<br />
Turkmenistan 78 58<br />
Namibia 77 60<br />
Kiribati 76 61<br />
Maldives 76 61<br />
Tajikistan 76 61<br />
Morocco 74 64<br />
Cape Verde 73 65<br />
Zimbabwe 73 65<br />
Indonesia 71 67<br />
Mongolia 71 67<br />
South Africa 66 69<br />
Libya 61 70<br />
Uzbekistan 60 71<br />
Peru 58 72<br />
Nicaragua 57 73<br />
Dominican Rep. 56 74<br />
Guatemala 56 74<br />
Tuvalu 56 74<br />
Samoa 53 77<br />
Vanuatu 53 77<br />
Brazil 52 79<br />
Botswana 50 80<br />
Kyrgyzstan 50 80<br />
China 47 82<br />
Turkey 47 82<br />
Kazakstan 45 84<br />
Azerbaijan 44 85<br />
Belize 44 85<br />
Viet Nam 44 85<br />
Albania 40 88<br />
Ecuador 40 88<br />
El Salvador 40 88<br />
Lebanon 40 88<br />
Algeria 39 92<br />
Philippines 38 93<br />
Saint Kitts and Nevis 38 93<br />
Thailand 38 93<br />
Iran 37 96<br />
Honduras 35 97<br />
Palau 35 97<br />
Tunisia 35 97<br />
Paraguay 34 100<br />
Syria 34 100<br />
Mexico 32 102<br />
Moldova, Rep. of 32 102<br />
Colombia 31 104<br />
Grenada 31 104<br />
Nauru 31 104<br />
Suriname 31 104<br />
Armenia 30 108<br />
Cook Islands 30 108<br />
Korea, Dem. People’s Rep. 30 108<br />
Saudi Arabia 30 108<br />
TFYR Macedonia 30 108<br />
Georgia 29 113<br />
Solomon Islands 29 113<br />
Venezuela 28 115<br />
Micronesia, Fed. States of 27 116<br />
Argentina 25 117<br />
Jordan 25 117<br />
Romania 25 117<br />
Russian Federation 25 117<br />
Fiji 24 121<br />
Ukraine 24 121<br />
Bahamas 23 123<br />
Mauritius 23 123<br />
Saint Vincent/Grenadines 23 123<br />
Tonga 23 123<br />
U5MR U5MR<br />
Country rate rank<br />
Antigua and Barbuda 22 127<br />
Bahrain 22 127<br />
Saint Lucia 22 127<br />
Uruguay 22 127<br />
Yugoslavia, Fed. Rep. 22 127<br />
Qatar 21 132<br />
Dominica 20 133<br />
Latvia 20 133<br />
Panama 20 133<br />
Bulgaria 19 136<br />
Seychelles 19 136<br />
Sri Lanka 19 136<br />
Belarus 18 139<br />
Lithuania 18 139<br />
Oman 18 139<br />
United Arab Emirates 18 139<br />
Bosnia and Herzegovina 17 143<br />
Trinidad and Tobago 17 143<br />
Estonia 16 145<br />
Costa Rica 15 146<br />
Kuwait 14 147<br />
Poland 14 147<br />
Chile 13 149<br />
Malaysia 13 149<br />
San Marino 13 149<br />
Barbados 12 152<br />
Hungary 12 152<br />
Brunei Darussalam 11 154<br />
Croatia 11 154<br />
Jamaica 11 154<br />
Malta 11 154<br />
Slovakia 11 154<br />
Cuba 10 159<br />
Cyprus 10 159<br />
Greece 9 161<br />
Israel 9 161<br />
United States 8 163<br />
Belgium 7 164<br />
Canada 7 164<br />
Czech Rep. 7 164<br />
Ireland 7 164<br />
Italy 7 164<br />
Korea, Rep. of 7 164<br />
Liechtenstein 7 164<br />
Luxembourg 7 164<br />
New Zealand 7 164<br />
Portugal 7 164<br />
United Kingdom 7 164<br />
Andorra 6 175<br />
Australia 6 175<br />
Austria 6 175<br />
Denmark 6 175<br />
France 6 175<br />
Germany 6 175<br />
Japan 6 175<br />
Monaco 6 175<br />
Netherlands 6 175<br />
Norway 6 175<br />
Slovenia 6 175<br />
Iceland 5 186<br />
Spain 5 186<br />
Switzerland 5 186<br />
Finland 4 189<br />
Singapore 4 189<br />
Sweden 4 189<br />
Holy See<br />
no data<br />
Niue<br />
no data<br />
93
Table 1: Basic indicators<br />
Under-5<br />
mortality<br />
rank<br />
Under-5<br />
mortality<br />
rate<br />
1960 1996<br />
Infant<br />
mortality<br />
rate<br />
(under 1)<br />
1960 1996<br />
Total<br />
population<br />
(thousands)<br />
1996<br />
Annual<br />
no. of<br />
births<br />
(thousands)<br />
1996<br />
Annual<br />
no. of<br />
under-5<br />
deaths<br />
(thousands)<br />
1996<br />
GNP<br />
per capita<br />
(US$)<br />
1995<br />
Life<br />
expectancy<br />
at birth<br />
(years)<br />
1996<br />
Afghanistan 4 360 257 215 165 20883 1127 290 250x 45 32 48 - -<br />
Albania 88 151 40 112 34 3401 75 3 670 71 - 98 - -<br />
Algeria 92 255 39 152 34 28784 857 33 1600 68 62 105 18x 46x<br />
Andorra 175 - 6 - 5 71 1 0 c - - - - -<br />
Angola 2 345 292 208 170 11185 546 159 410 47 42x 88 - -<br />
Antigua and Barbuda 127 - 22 - 18 66 1 0 6980x 75 95x 100x - -<br />
Argentina 117 72 25 60 22 35219 709 18 8030 73 96 111 - -<br />
Armenia 108 48 30 38 25 3638 50 2 730 71 100 90 - -<br />
Australia 175 24 6 20 6 18057 262 2 18720 78 - 107 16x 42x<br />
Austria 175 43 6 37 5 8106 86 0 26890 77 - 103 - -<br />
Azerbaijan 85 75 44 55 34 7594 154 7 480 71 100 117 - -<br />
Bahamas 123 68 23 51 19 284 5 0 11940 73 98 97 - -<br />
Bahrain 127 203 22 130 18 570 12 0 7840 73 85 111 - -<br />
Bangladesh 44 247 112 151 83 120073 3186 357 240 57 38 79 23 38<br />
Barbados 152 90 12 74 11 261 3 0 6560 76 97 90 - -<br />
Belarus 139 47 18 37 14 10348 106 2 2070 70 99 97 26 33<br />
Belgium 164 35 7 31 6 10159 115 1 24710 77 - 99 22x 36x<br />
Belize 85 104 44 74 36 219 7 0 2630 74 80x 111 - -<br />
Benin 31 310 140 184 84 5563 238 33 370 54 37 72 - -<br />
Bhutan 36 300 127 175 90 1812 76 10 420 52 42 25x - -<br />
Bolivia 51 252 102 152 71 7593 258 26 800 61 83 95 15 48<br />
Bosnia and Herzegovina 143 155 17 105 15 3628 43 1 a 73 - - - -<br />
Botswana 80 170 50 117 40 1484 52 3 3020 52 70 115 11x 59x<br />
Brazil 79 177 52 115 44 161087 3211 167 3640 67 83 114 7x 68x<br />
Brunei Darussalam 154 87 11 63 9 300 6 0 25160 75 88 109 - -<br />
Bulgaria 136 70 19 49 16 8468 86 2 1330 71 98 86 21 39<br />
Burkina Faso 23 318 158 183 82 10780 501 79 230 46 19 39 - -<br />
Burundi 17 255 176 151 106 6221 272 48 160 46 35 69 - -<br />
Cambodia 19 217 170 146 108 10273 360 61 270 53 65x 118 - -<br />
Cameroon 51 264 102 156 63 13560 539 55 650 56 63 89 - -<br />
Canada 164 33 7 28 6 29680 367 2 19380 79 97x 103 18x 40x<br />
Cape Verde 65 164 73 110 54 396 12 1 960 66 72 131 - -<br />
Central African Rep. 21 343 164 195 103 3344 127 21 340 49 60 71x - -<br />
Chad 27 325 149 195 92 6515 275 41 180 47 48 55 - -<br />
Chile 149 138 13 107 11 14421 294 4 4160 75 95 99 10 61<br />
China 82 209 47 140 38 1232083 20712 973 620 69 82 118 15 48<br />
Colombia 104 130 31 82 26 36444 878 27 1910 71 91 121 11 56<br />
Comoros 39 248 122 165 83 632 26 3 470 57 57 75 - -<br />
Congo 48 220 108 143 81 2668 115 12 680 51 75 - - -<br />
Congo, Dem. Rep. 12 302 207 175 128 46812 2135 442 120 53 77 68 - -<br />
Cook Islands 108 - 30 - 26 19 0 0 1550x - 99x 98 - -<br />
Costa Rica 146 112 15 80 13 3500 86 1 2610 77 95 106 13x 51x<br />
Côte d’Ivoire 25 300 150 195 90 14015 523 78 660 51 40 68 18x 44x<br />
Croatia 154 98 11 70 10 4501 48 1 3250 72 98 86 - -<br />
Cuba 159 54 10 39 10 11018 149 2 1170x 76 96 104 - -<br />
Cyprus 159 36 10 30 9 756 12 0 10260x 77 94x 100 - -<br />
Czech Rep. 164 25 7 22 6 10251 111 1 3870 73 - 100 24 37<br />
Denmark 175 25 6 22 6 5237 68 0 29890 75 - 99 17x 39x<br />
Djibouti 24 289 157 186 112 617 24 4 780x 50 46 38 - -<br />
Dominica 133 - 20 - 17 71 2 0 2990 73 - - - -<br />
Dominican Rep. 74 149 56 102 45 7961 198 11 1460 71 82 103 12x 56x<br />
Ecuador 88 180 40 115 31 11699 309 12 1390 70 90 123 14 53<br />
Egypt 58 282 78 189 57 63271 1690 132 790 65 51 98 21 41<br />
El Salvador 88 210 40 130 34 5796 166 7 1610 69 72 79 - -<br />
Equatorial Guinea 18 316 173 188 111 410 17 3 380 49 79 149x - -<br />
Eritrea 41 250 120 170 78 3280 135 16 100x 50 - 49 - -<br />
Estonia 145 52 16 40 13 1471 13 0 2860 69 98 101 17 46<br />
Ethiopia 16 280 177 175 113 58243 2856 506 100 49 36 27 21x 41x<br />
Total<br />
adult<br />
literacy<br />
rate<br />
1995<br />
Primary<br />
school<br />
enrolment<br />
ratio<br />
(gross)<br />
1990-95<br />
% share<br />
of household<br />
income<br />
1990-96<br />
lowest highest<br />
40% 20%<br />
94
Under-5<br />
mortality<br />
rank<br />
Under-5<br />
mortality<br />
rate<br />
1960 1996<br />
Infant<br />
mortality<br />
rate<br />
(under 1)<br />
1960 1996<br />
Total<br />
population<br />
(thousands)<br />
1996<br />
Annual<br />
no. of<br />
births<br />
(thousands)<br />
1996<br />
Annual<br />
no. of<br />
under-5<br />
deaths<br />
(thousands)<br />
1996<br />
GNP<br />
per capita<br />
(US$)<br />
1995<br />
Life<br />
expectancy<br />
at birth<br />
(years)<br />
1996<br />
…Table 1<br />
Fiji 121 97 24 71 20 797 18 0 2440 72 92 128 - -<br />
Finland 189 28 4 22 4 5126 62 0 20580 76 - 100 18x 38x<br />
France 175 34 6 29 5 58333 692 4 24990 79 - 105 17x 42x<br />
Gabon 28 287 145 171 87 1106 41 6 3490 55 63 - - -<br />
Gambia 49 375 107 213 78 1141 46 5 320 46 39 67 - -<br />
Georgia 113 70 29 52 23 5442 77 2 440 73 99 82 - -<br />
Germany 175 40 6 34 5 81922 774 4 27510 76 - 97 19x 40x<br />
Ghana 47 213 110 126 70 17832 692 76 390 57 65 76 20 42<br />
Greece 161 64 9 53 8 10490 104 1 8210 78 97 95 - -<br />
Grenada 104 - 31 - 25 92 2 0 2980 - 96x 88x - -<br />
Guatemala 74 204 56 140 43 10928 405 23 1340 66 56 84 8x 63x<br />
Guinea 11 380 210 215 130 7518 359 75 550 46 36 46 11 50<br />
Guinea-Bissau 6 336 223 200 132 1091 44 10 250 44 55 60x 9 59<br />
Guyana 56 126 83 100 60 838 19 2 590 64 98 112x - -<br />
Haiti 34 260 134 170 94 7259 250 34 250 54 45 56 - -<br />
Holy See - - - - - 1 - - - - - - - -<br />
Honduras 97 204 35 137 29 5816 201 7 600 69 73 112 11 57<br />
Hungary 152 57 12 51 11 10049 104 1 4120 69 99 97 24 37<br />
Iceland 186 22 5 17 5 271 4 0 24950 79 - 98 - -<br />
India 46 236 111 144 73 944580 24381 2706 340 62 52 102 21 43<br />
Indonesia 67 216 71 127 47 200453 4732 336 980 64 84 115 21 41<br />
Iran 96 233 37 145 33 69975 2446 91 1033x 69 69 101 - -<br />
Iraq 39 171 122 117 94 20607 770 94 1036x 61 58 91 - -<br />
Ireland 164 36 7 31 6 3554 46 0 14710 76 - 104 - -<br />
Israel 161 39 9 32 8 5664 115 1 15920 77 95x 95 18x 40x<br />
Italy 164 50 7 44 6 57226 528 4 19020 78 98 98 19x 41x<br />
Jamaica 154 76 11 58 10 2491 56 1 1510 74 85 109 16 48<br />
Japan 175 40 6 31 4 125351 1281 8 39640 80 - 102 22x 38x<br />
Jordan 117 139 25 97 21 5581 211 5 1510 69 87 94 16 50<br />
Kazakstan 84 74 45 55 38 16820 312 14 1330 68 100 87 20 40<br />
Kenya 55 202 90 120 61 27799 1027 92 280 54 78 91 10 62<br />
Kiribati 61 - 76 - 56 80 2 0 920 58 93x 91 - -<br />
Korea, Dem. People’s Rep. 108 120 30 85 23 22466 493 15 970x 72 - 104x - -<br />
Korea, Rep. of 164 127 7 90 6 45314 688 5 9700 72 98 95 20x 42x<br />
Kuwait 147 128 14 89 13 1687 40 1 17390 76 79 69 - -<br />
Kyrgyzstan 80 115 50 80 39 4469 117 6 700 68 97 111 10 57<br />
Lao People’s Dem. Rep. 35 235 128 155 102 5035 227 29 350 53 57 107 23 40<br />
Latvia 133 44 20 35 16 2504 25 1 2270 68 100 83 23 37<br />
Lebanon 88 85 40 65 33 3084 76 3 2660 69 92 112 - -<br />
Lesotho 32 203 139 137 96 2078 74 10 770 58 71 99 9x 60x<br />
Liberia 5 288 235 190 157 2245 121 28 490x 48 38 35x - -<br />
Libya 70 269 61 160 50 5593 227 14 5540x 65 76 110 - -<br />
Liechtenstein 164 - 7 - 6 31 0 0 c - 100x - - -<br />
Lithuania 139 70 18 52 14 3728 41 1 1900 70 99 96 20 42<br />
Luxembourg 164 41 7 33 7 412 5 0 41210 76 - 91 - -<br />
Madagascar 21 364 164 219 100 15353 643 105 230 58 46 73 16 50<br />
Malawi 8 365 217 206 137 9845 487 106 170 41 56 120 - -<br />
Malaysia 149 105 13 73 11 20581 539 7 3890 72 84 93 13x 54x<br />
Maldives 61 258 76 158 54 263 11 1 990 64 93 134 - -<br />
Mali 7 500 220 285 134 11134 539 119 250 47 31 32 - -<br />
Malta 154 42 11 37 10 369 5 0 7910x 77 91 108 - -<br />
Marshall Islands 54 - 92 - 63 57 2 0 1680x - 91x 95 - -<br />
Mauritania 15 330 183 175 124 2333 90 16 460 53 38 74 14x 47x<br />
Mauritius 123 84 23 62 20 1129 22 1 3380 71 83 106 - -<br />
Mexico 102 148 32 103 27 92718 2351 75 3320 72 90 111 12 55<br />
Micronesia, Fed. States of 116 - 27 - 21 126 4 0 2010 - 81x 100 - -<br />
Moldova, Rep. of 102 88 32 64 26 4444 61 2 920 68 99 94 19 42<br />
Monaco 175 - 6 - 5 32 0 0 c - - - - -<br />
Total<br />
adult<br />
literacy<br />
rate<br />
1995<br />
Primary<br />
school<br />
enrolment<br />
ratio<br />
(gross)<br />
1990-95<br />
% share<br />
of household<br />
income<br />
1990-96<br />
lowest highest<br />
40% 20%<br />
95
Table 1: Basic indicators<br />
Under-5<br />
mortality<br />
rank<br />
Under-5<br />
mortality<br />
rate<br />
1960 1996<br />
Infant<br />
mortality<br />
rate<br />
(under 1)<br />
1960 1996<br />
Total<br />
population<br />
(thousands)<br />
1996<br />
Annual<br />
no. of<br />
births<br />
(thousands)<br />
1996<br />
Annual<br />
no. of<br />
under-5<br />
deaths<br />
(thousands)<br />
1996<br />
GNP<br />
per capita<br />
(US$)<br />
1995<br />
Life<br />
expectancy<br />
at birth<br />
(years)<br />
1996<br />
Mongolia 67 185 71 128 55 2515 70 5 310 65 83 84 - -<br />
Morocco 64 220 74 135 64 27021 714 53 1110 66 44 80 17 46<br />
Mozambique 9 280 214 163 133 17796 763 163 80 47 40 65 - -<br />
Myanmar 25 237 150 158 105 45922 1276 191 220x 59 83 100 - -<br />
Namibia 60 206 77 129 60 1575 57 4 2000 56 76x 137 - -<br />
Nauru 104 - 31 - 25 11 0 0 - - - - - -<br />
Nepal 42 315 116 212 82 22021 822 95 200 56 28 109 19 45<br />
Netherlands 175 22 6 18 5 15575 190 1 24000 78 - 97 21x 37x<br />
New Zealand 164 26 7 22 7 3602 56 0 14340 77 - 102 16x 45x<br />
Nicaragua 73 209 57 140 44 4238 145 8 380 68 66 104 12 55<br />
Niger 1 320 320 191 191 9465 484 155 220 48 14 30 19 44<br />
Nigeria 14 204 191 122 114 115020 4975 950 260 52 57 89 13 49<br />
Niue - - - - - 2 0 - - - 99x - - -<br />
Norway 175 23 6 19 5 4348 59 0 31250 77 - 99 19x 37x<br />
Oman 139 280 18 164 15 2302 102 2 4820 70 59x 83 - -<br />
Pakistan 33 226 136 139 95 139973 5207 708 460 63 38 69 21 40<br />
Palau 97 - 35 - 25 17 1 0 790x - 98x 103 - -<br />
Panama 133 104 20 67 18 2677 62 1 2750 74 91 106 8x 60x<br />
Papua New Guinea 44 204 112 137 79 4400 144 16 1160 57 72 82 - -<br />
Paraguay 100 90 34 66 28 4957 158 5 1690 69 92 109 - -<br />
Peru 72 234 58 142 45 23944 615 36 2310 68 89 123 14 50<br />
Philippines 93 107 38 77 32 69282 2029 77 1050 68 95 111 17x 48x<br />
Poland 147 70 14 62 12 38601 463 6 2790 71 - 99 23 37<br />
Portugal 164 112 7 81 7 9808 110 1 9740 75 90 117 - -<br />
Qatar 132 239 21 145 17 558 10 0 11600 71 79 87 - -<br />
Romania 117 82 25 69 21 22655 247 6 1480 70 98 94 24 35<br />
Russian Federation 117 65 25 48 20 148126 1427 36 2240 65 99 109 12 54<br />
Rwanda 19 210 170 124 105 5397 263 45 180 36 61 77 23x 39x<br />
Saint Kitts and Nevis 93 - 38 - 31 41 1 0 5170 69 90x - - -<br />
Saint Lucia 127 - 22 - 18 144 4 0 3370 71 - 95x - -<br />
Saint Vincent/Grenadines 123 - 23 - 19 113 2 0 2280 72 82x 95x - -<br />
Samoa 77 210 53 134 42 166 4 0 1120 69 98x 100 - -<br />
San Marino 149 - 13 - 12 25 0 0 - - - - - -<br />
Sao Tome and Principe 57 - 80 - 62 135 6 0 350 69 57x - - -<br />
Saudi Arabia 108 292 30 170 25 18836 657 20 7040 71 63 77 - -<br />
Senegal 36 300 127 173 74 8532 356 45 600 51 33 60 11 59<br />
Seychelles 136 - 19 - 15 74 3 0 6620 72 84x 102x - -<br />
Sierra Leone 3 385 284 219 164 4297 207 59 180 37 31 51 - -<br />
Singapore 189 40 4 31 4 3384 56 0 26730 77 91 107 15x 49x<br />
Slovakia 154 40 11 33 10 5347 64 1 2950 71 - 101 28 31<br />
Slovenia 175 45 6 37 6 1924 18 0 8200 73 99x 100 23 38<br />
Solomon Islands 113 185 29 120 24 391 14 0 910 71 62x 97 - -<br />
Somalia 10 294 211 175 125 9822 504 106 110x 48 24x 11x - -<br />
South Africa 69 126 66 89 50 42393 1280 84 3160 65 82 117 9 63<br />
Spain 186 57 5 46 5 39674 387 2 13580 78 97 104 22x 37x<br />
Sri Lanka 136 130 19 90 17 18100 322 6 700 73 90 105 22 39<br />
Sudan 42 210 116 125 73 27291 929 108 310x 54 46 55 - -<br />
Suriname 104 96 31 70 25 432 9 0 880 71 93 127x - -<br />
Swaziland 53 233 97 157 68 881 33 3 1170 59 77 122 - -<br />
Sweden 189 20 4 16 4 8819 108 0 23750 78 - 100 21x 37x<br />
Switzerland 186 27 5 22 5 7224 80 0 40630 78 - 101 17x 45x<br />
Syria 100 201 34 136 28 14574 450 15 1120 68 71 103 - -<br />
Tajikistan 61 140 76 95 56 5935 184 14 340 67 100 89 - -<br />
Tanzania 29 240 144 142 93 30799 1281 184 120 51 68 70 18 45<br />
TFYR Macedonia 108 177 30 120 26 2174 32 1 860 72 - 87 - -<br />
Thailand 93 148 38 103 31 58703 996 38 2740 69 94 87 14 53<br />
Togo 38 267 125 158 78 4201 179 22 310 50 52 102 - -<br />
Tonga 123 - 23 - 19 98 2 0 1630 69 99x 98x - -<br />
Total<br />
adult<br />
literacy<br />
rate<br />
1995<br />
Primary<br />
school<br />
enrolment<br />
ratio<br />
(gross)<br />
1990-95<br />
% share<br />
of household<br />
income<br />
1990-96<br />
lowest highest<br />
40% 20%<br />
96
Under-5<br />
mortality<br />
rank<br />
Under-5<br />
mortality<br />
rate<br />
1960 1996<br />
Infant<br />
mortality<br />
rate<br />
(under 1)<br />
1960 1996<br />
Total<br />
population<br />
(thousands)<br />
1996<br />
Annual<br />
no. of<br />
births<br />
(thousands)<br />
1996<br />
Annual<br />
no. of<br />
under-5<br />
deaths<br />
(thousands)<br />
1996<br />
GNP<br />
per capita<br />
(US$)<br />
1995<br />
Life<br />
expectancy<br />
at birth<br />
(years)<br />
1996<br />
…Table 1<br />
Trinidad and Tobago 143 73 17 61 15 1297 21 0 3770 73 98 94 - -<br />
Tunisia 97 254 35 170 28 9156 223 8 1820 69 67 118 16 46<br />
Turkey 82 219 47 163 41 61797 1371 64 2780 68 82 97 - -<br />
Turkmenistan 58 150 78 100 57 4155 122 10 920 65 98x - 18 43<br />
Tuvalu 74 - 56 - 40 10 0 0 650x - 99x 101 - -<br />
Uganda 30 224 141 133 88 20256 1040 147 240 41 62 67 17 48<br />
Ukraine 121 53 24 41 18 51608 511 12 1630 69 99 87 24 35<br />
United Arab Emirates 139 240 18 160 15 2260 42 1 17400 75 79 110 - -<br />
United Kingdom 164 27 7 23 6 58144 706 5 18700 77 - 114 15x 44x<br />
United States 163 30 8 26 8 269444 3827 32 26980 76 99x 107 16x 42x<br />
Uruguay 127 56 22 48 20 3204 54 1 5170 73 97 109 - -<br />
Uzbekistan 71 122 60 84 46 23209 674 40 970 68 100 77 - -<br />
Vanuatu 77 225 53 141 41 174 5 0 1200 67 64x 106 - -<br />
Venezuela 115 70 28 53 24 22311 570 16 3020 72 91 94 11 58<br />
Viet Nam 85 219 44 147 33 75181 1975 87 240 67 94 114 19 44<br />
Yemen 50 340 105 230 78 15678 756 79 260 57 33x 83 - -<br />
Yugoslavia, Fed. Rep. 127 120 22 87 19 10294 131 3 b 72 98 70 - -<br />
Zambia 13 213 202 126 112 8275 356 72 400 43 78 82 12 50<br />
Zimbabwe 65 181 73 109 49 11439 436 32 540 49 85 115 10 62<br />
Total<br />
adult<br />
literacy<br />
rate<br />
1995<br />
Primary<br />
school<br />
enrolment<br />
ratio<br />
(gross)<br />
1990-95<br />
% share<br />
of household<br />
income<br />
1990-96<br />
lowest highest<br />
40% 20%<br />
Regional summaries<br />
Sub-Saharan Africa 257 170 154 105 576069 24777 4224 501 51 57 73 11 58<br />
Middle East and North Africa 241 65 154 50 318201 10248 662 1710 65 59 93 - -<br />
South Asia 239 119 146 80 1267705 35132 4173 345 61 49 94 21 42<br />
East Asia and Pacific 201 54 133 41 1797840 34355 1843 1043 68 84 114 17 46<br />
Latin America and Caribbean 157 43 105 35 479139 11201 484 3271 69 87 110 9 61<br />
CEE/CIS and Baltic States 101 36 76 29 474657 6649 237 2086 68 97 97 18 44<br />
Industrialized countries 37 7 31 6 838679 10056 70 25926 77 98 104 18 40<br />
Developing countries 216 97 137 66 4577675 118889 11546 1101 62 71 99 15 51<br />
Least developed countries 280 171 171 109 594510 23695 4041 220 51 48 69 20 43<br />
World 192 88 123 60 5752290 132418 11694 4812 63 75 100 18 42<br />
Countries in each region are listed on page 122.<br />
Definitions of the indicators<br />
Under-five mortality rate — Probability of dying between birth and exactly five years of age<br />
expressed per 1,000 live births.<br />
Infant mortality rate — Probability of dying between birth and exactly one year of age<br />
expressed per 1,000 live births.<br />
GNP per capita — Gross national product (GNP) is the sum of gross value added by all<br />
resident producers, plus any taxes that are not included in the valuation of output, plus net<br />
receipts of primary income from non-resident sources. GNP per capita is the gross national<br />
product, converted to United States dollars using the World Bank Atlas method, divided by<br />
the mid-year population.<br />
Life expectancy at birth — The number of years newborn children would live if subject to<br />
the mortality risks prevailing for the cross-section of population at the time of their birth.<br />
Adult literacy rate — Percentage of persons aged 15 and over who can read and write.<br />
Gross primary school enrolment ratio — The number of children enrolled in primary<br />
school, regardless of age, divided by the population of the age group that officially<br />
corresponds to primary schooling.<br />
Income share — Percentage of income received by the 20 per cent of households with the<br />
highest income and by the 40 per cent of households with the lowest income.<br />
Main data sources<br />
Under-five and infant mortality rates — UNICEF, United Nations Population Division and<br />
United Nations Statistics Division.<br />
Total population — United Nations Population Division.<br />
Births — United Nations Population Division.<br />
Under-five deaths — UNICEF.<br />
GNP per capita — World Bank.<br />
Life expectancy — United Nations Population Division.<br />
Adult literacy — United Nations Educational, Scientific and Cultural Organization (UNESCO).<br />
School enrolment — United Nations Educational, Scientific and Cultural Organization<br />
(UNESCO).<br />
Household income — World Bank.<br />
Notes a: Range $765 or less<br />
- Data not available.<br />
b: Range $765 to $3035<br />
x Indicates data that refer to years or periods other than those specified in<br />
c: Range $9386 or more<br />
the column heading, differ from the standard definition, or refer to only part of a country.<br />
97
Table 2: Nutrition<br />
Under-5<br />
mortality<br />
rank<br />
% of infants<br />
with low<br />
birthweight<br />
1990-94<br />
exclusively<br />
breastfed<br />
(0-3 months)<br />
% of children (1990-96) who are:<br />
breastfed with<br />
complementary still<br />
food breastfeeding<br />
(6-9 months) (20-23 months)<br />
moderate<br />
& severe<br />
% of under-fives (1990-97) suffering from:<br />
underweight<br />
wasting<br />
moderate<br />
& severe<br />
Total goitre rate<br />
(6-11 years)<br />
(%)<br />
1985-94<br />
Afghanistan 4 20 - - - - - - - 20 -<br />
Albania 88 7 - - - - - - - 41 -<br />
Algeria 92 9 48 29 21 13 3 9 18 9 92<br />
Andorra 175 - - - - - - - - - -<br />
Angola 2 19 3 83 53 - - - - 7 10<br />
Antigua and Barbuda 127 8 - - - 10x 4x 10x 0x - -<br />
Argentina 117 7 - - - - - - - 8 90<br />
Armenia 108 - - - - - - - - 10 -<br />
Australia 175 6 - - - - - - - - -<br />
Austria 175 6 - - - - - - - - -<br />
Azerbaijan 85 - - - - - - - - 20 -<br />
Bahamas 123 - - - - - - - - - -<br />
Bahrain 127 6 - - - - - - - - -<br />
Bangladesh 44 50 51 - - 56 21 18 55 50 44<br />
Barbados 152 10 - - - 5x 1x 4x 7x - -<br />
Belarus 139 - - - - - - - - 22 37<br />
Belgium 164 6 - - - - - - - 5 -<br />
Belize 85 10 24 49 - - - - - 0 90<br />
Benin 31 - - - - - - - - 24 35<br />
Bhutan 36 - - - - 38x - 4x 56x 25 96<br />
Bolivia 51 12 53 78 36 8 2 1 29 21 92<br />
Bosnia and Herzegovina 143 - - - - - - - - - -<br />
Botswana 80 8 41x 82x 23x 15x - - 44x 8 27<br />
Brazil 79 11 42 30 17 6 1 2 11 14x 95<br />
Brunei Darussalam 154 - - - - - - - - - -<br />
Bulgaria 136 6 - - - - - - - 20 -<br />
Burkina Faso 23 21 12 - - 30 8 13 29 16 23<br />
Burundi 17 - 89x 66x 73x 37 11 9 43 42 80<br />
Cambodia 19 - - - - 40 7 8 38 15 -<br />
Cameroon 51 13 7 77 35 14 3 3 24 26 86<br />
Canada 164 6 - - - - - - - - -<br />
Cape Verde 65 11 - - - 19x - 3x 26x - -<br />
Central African Rep. 21 15 23 - - 27 8 7 34 63 65<br />
Chad 27 - - - - - - - - 15 31<br />
Chile 149 5 77 17 - 1 - 0 3 9x 95<br />
China 82 9 64 - - 16 - - - 20 51<br />
Colombia 104 9 16 61 17 8 1 1 15 7 90<br />
Comoros 39 8 5 87 45 26 8 8 34 - -<br />
Congo 48 16 43x 95x 27x 24x 3x 4x 21x 8 -<br />
Congo, Dem. Rep. 12 15 32 40 64 34 10 10 45 9 12<br />
Cook Islands 108 3 - - - - - - - - -<br />
Costa Rica 146 7 35 47 12 2 - - - 4 89<br />
Côte d’Ivoire 25 14 62 54 - 24 6 8 24 6 -<br />
Croatia 154 - 24 - - - - - - - 100<br />
Cuba 159 8 - - - - - 1x - 10 45<br />
Cyprus 159 - - - - - - - - - -<br />
Czech Rep. 164 6 - - - - - - - - -<br />
Denmark 175 6 - - - - - - - 5 -<br />
Djibouti 24 11 - - - 23 9 11 22 - -<br />
Dominica 133 10 - - - 5x 0x 2x 6x - -<br />
Dominican Rep. 74 11 25 47 7 6 1 1 11 5 40<br />
Ecuador 88 13 29 52 34 17x 0x 2x 34x 10 97<br />
Egypt 58 10 53 37 - 15 4 6 25 5 0<br />
El Salvador 88 11 20 71 28 11 1 1 23 25 91<br />
Equatorial Guinea 18 - - - - - - - - - 20<br />
Eritrea 41 13 66 45 60 44 17 16 38 - 80<br />
Estonia 145 - - - - - - - - - -<br />
Ethiopia 16 16 74 - 35 48 16 8 64 31 0<br />
severe<br />
stunting<br />
moderate<br />
& severe<br />
% of<br />
households<br />
consuming<br />
iodized salt<br />
1992-96<br />
98
…Table 2<br />
Under-5<br />
mortality<br />
rank<br />
% of infants<br />
with low<br />
birthweight<br />
1990-94<br />
exclusively<br />
breastfed<br />
(0-3 months)<br />
% of children (1990-96) who are:<br />
breastfed with<br />
complementary still<br />
food breastfeeding<br />
(6-9 months) (20-23 months)<br />
moderate<br />
& severe<br />
% of under-fives (1990-97) suffering from:<br />
underweight<br />
wasting<br />
moderate<br />
& severe<br />
Total goitre rate<br />
(6-11 years)<br />
(%)<br />
1985-94<br />
Fiji 121 12 - - - - - - - - 31<br />
Finland 189 4 - - - - - - - - -<br />
France 175 5 - - - - - - - 5x -<br />
Gabon 28 - 57 - - - - - - 5 -<br />
Gambia 49 - - - 61 - - - - - 0<br />
Georgia 113 - - - - - - - - 20 -<br />
Germany 175 - - - - - - - - 10 -<br />
Ghana 47 7 19 63 48 27 8 11 26 10 10<br />
Greece 161 6 - - - - - - - 10 -<br />
Grenada 104 9 - - - - - - - - -<br />
Guatemala 74 15 50 56 43 27 6 3 50 20 64<br />
Guinea 11 21 52 - 15 26 9 12 32 55 37<br />
Guinea-Bissau 6 20 - - - 23x - - - 19 -<br />
Guyana 56 19 - - - 18 2 - - - -<br />
Haiti 34 15 3 83 25 28 8 8 32 4x 10<br />
Holy See - - - - - - - - - - -<br />
Honduras 97 9 11 - - 18 3 2 40 9 85<br />
Hungary 152 9 - - - - - - - - -<br />
Iceland 186 - - - - - - - - - -<br />
India 46 33 51 31 67 53 21 18 52 9 70<br />
Indonesia 67 14 47 85 63 11 2 - 4 28 85<br />
Iran 96 9 53 - - 16 3 7 19 30 82<br />
Iraq 39 15 - - - 12 2 3 22 7 50<br />
Ireland 164 4 - - - - - - - - -<br />
Israel 161 7 - - - - - - - - -<br />
Italy 164 5 - - - - - - - 20 -<br />
Jamaica 154 10 - - - 10 1 4 6 - 100<br />
Japan 175 7 - - - - - - - - -<br />
Jordan 117 7 32 48 13 9 - 2 16 - 75<br />
Kazakstan 84 - 12 61 21 8 2 3 16 20 53<br />
Kenya 55 16 17 90 54 23 6 8 34 7 100<br />
Kiribati 61 6 - - - - - - - - -<br />
Korea, Dem. People’s Rep. 108 - - - - - - - - - 5<br />
Korea, Rep. of 164 9 - - - - - - - - -<br />
Kuwait 147 7 - - - 6x - 3x 12x - -<br />
Kyrgyzstan 80 - 38 50 25 - - - - 20 -<br />
Lao People’s Dem. Rep. 35 18 36 - 31 40 12 11 47 25 90<br />
Latvia 133 - - - - - - - - - -<br />
Lebanon 88 10 - - - - - - - 15 92<br />
Lesotho 32 11 54 47 52 16 4 5 44 43 73<br />
Liberia 5 - - 17 25 - - - - 6 -<br />
Libya 70 - - - - 5 - 3 15 6 90<br />
Liechtenstein 164 - - - - - - - - - -<br />
Lithuania 139 - - - - - - - - - -<br />
Luxembourg 164 - - - - - - - - - -<br />
Madagascar 21 17 47 80 45 34 10 7 50 24 1<br />
Malawi 8 20 11 78 68 30 9 7 48 13 58<br />
Malaysia 149 8 - - - 23 1 - - 20 -<br />
Maldives 61 20 8 - - 39 8 16 30 24 -<br />
Mali 7 17 42 31 73 27 10 11 49 29 9<br />
Malta 154 - - - - - - - - - -<br />
Marshall Islands 54 15 - - - - - - - - -<br />
Mauritania 15 11 60 64 59 23 9 7 44 - 3<br />
Mauritius 123 13 16 29 - 16 2 15 10 0 0<br />
Mexico 102 8 38x 36x 21x 14x - 6x 22x 3 87<br />
Micronesia, Fed. States of 116 9 - - - - - - - - -<br />
Moldova, Rep. of 102 4 - - - - - - - - -<br />
Monaco 175 - - - - - - - - - -<br />
severe<br />
stunting<br />
moderate<br />
& severe<br />
% of<br />
households<br />
consuming<br />
iodized salt<br />
1992-96<br />
99
Table 2: Nutrition<br />
Under-5<br />
mortality<br />
rank<br />
% of infants<br />
with low<br />
birthweight<br />
1990-94<br />
exclusively<br />
breastfed<br />
(0-3 months)<br />
% of children (1990-96) who are:<br />
breastfed with<br />
complementary still<br />
food breastfeeding<br />
(6-9 months) (20-23 months)<br />
moderate<br />
& severe<br />
% of under-fives (1990-97) suffering from:<br />
underweight<br />
wasting<br />
moderate<br />
& severe<br />
Total goitre rate<br />
(6-11 years)<br />
(%)<br />
1985-94<br />
Mongolia 67 6 - - - 12 - 2 26 28 42<br />
Morocco 64 9 31 33 20 9 2 2 23 20 -<br />
Mozambique 9 20 - - - 27 11 5 55 20 62<br />
Myanmar 25 16 30 40 56 43 16 8 45 18 14<br />
Namibia 60 16 22 65 23 26 6 9 28 35 80<br />
Nauru 104 - - - - - - - - - -<br />
Nepal 42 - 83 63 88 47 16 11 48 44 93<br />
Netherlands 175 - - - - - - - - 3 -<br />
New Zealand 164 6 - - - - - - - - -<br />
Nicaragua 73 15 11 48 17 12 - 2 24 4 98<br />
Niger 1 15 - 67 52 36 12 16 32 9 83<br />
Nigeria 14 16 2 52 43 36 12 9 43 10 83<br />
Niue - - - - - - - - - - -<br />
Norway 175 4 - - - - - - - - -<br />
Oman 139 8 28 85 64 23 3 13 23 10 35<br />
Pakistan 33 25 16 31 56 38 13 - - 32 19<br />
Palau 97 8 - - - - - - - - -<br />
Panama 133 9 32 38 21 7 1 1 9 13 92<br />
Papua New Guinea 44 23 - - - 35x - - - 30 -<br />
Paraguay 100 5 7 61 8 4 1 0 17 49 77<br />
Peru 72 11 63 83 43 8 1 1 26 36 90<br />
Philippines 93 15 33 52 18 30 5 8 33 15 15<br />
Poland 147 - - - - - - - - 10 -<br />
Portugal 164 5 - - - - - - - 15 -<br />
Qatar 132 - - - - - - - - - -<br />
Romania 117 11 - - - - - - - 10 -<br />
Russian Federation 117 - - - - - - - - - 30<br />
Rwanda 19 17 90 68 85 29 6 4 48 49 90<br />
Saint Kitts and Nevis 93 9 - - - - - - - - -<br />
Saint Lucia 127 8 - - - - - - - - -<br />
Saint Vincent/Grenadines 123 8 - - - - - - - - -<br />
Samoa 77 6 - - - - - - - - -<br />
San Marino 149 - - - - - - - - - -<br />
Sao Tome and Principe 57 7 - - - 17x - 5x 26x - -<br />
Saudi Arabia 108 7 - - - - - - - - -<br />
Senegal 36 11 9 87 - 22 - 7 23 12 9<br />
Seychelles 136 10 - - - 6x 0x 2x 5x - -<br />
Sierra Leone 3 11 - 94 41 29 - 9 35 7 75<br />
Singapore 189 7 - - - - - - - - -<br />
Slovakia 154 - - - - - - - - - -<br />
Slovenia 175 - - - - - - - - - -<br />
Solomon Islands 113 20 - - - - - - - - -<br />
Somalia 10 16 - - - - - - - 7 -<br />
South Africa 69 - - - - 9 1 3 23 2 40<br />
Spain 186 4 - - - - - - - 10 -<br />
Sri Lanka 136 25 24 60 66 38 7 16 24 14 7<br />
Sudan 42 15 14x 45x 44x 34 11 13 33 20 -<br />
Suriname 104 13 - - - - - - - - -<br />
Swaziland 53 10 37 51 20 10x - 1x 30x - 26<br />
Sweden 189 5 - - - - - - - - -<br />
Switzerland 186 5 - - - - - - - - -<br />
Syria 100 11 - 50 - 13 4 9 21 73 36<br />
Tajikistan 61 - - - - - - - - 20 20<br />
Tanzania 29 14 40 - - 27 8 6 42 37 74<br />
TFYR Macedonia 108 - - - - - - - - - 100<br />
Thailand 93 13 4x 69x 34x 26x 4x 6x 22x 8 50<br />
Togo 38 20 - 25 99 19 4 - 34 22 1<br />
Tonga 123 2 - - - - - - - - -<br />
severe<br />
stunting<br />
moderate<br />
& severe<br />
% of<br />
households<br />
consuming<br />
iodized salt<br />
1992-96<br />
100
…Table 2<br />
Under-5<br />
mortality<br />
rank<br />
% of infants<br />
with low<br />
birthweight<br />
1990-94<br />
exclusively<br />
breastfed<br />
(0-3 months)<br />
% of children (1990-96) who are:<br />
breastfed with<br />
complementary still<br />
food breastfeeding<br />
(6-9 months) (20-23 months)<br />
moderate<br />
& severe<br />
% of under-fives (1990-97) suffering from:<br />
underweight<br />
Trinidad and Tobago 143 10 10x 39x 16x 7x 0x 4x 5x - -<br />
Tunisia 97 8 12 - 16 9 - 4 23 4x 98<br />
Turkey 82 8 14 17 14 10 3 - - 36 18<br />
Turkmenistan 58 5 54 - - - - - - 20 0<br />
Tuvalu 74 2 - - - - - - - - -<br />
Uganda 30 - 70 64 40 26 7 5 38 7 69<br />
Ukraine 121 - - - - - - - - 10 4<br />
United Arab Emirates 139 6 - - 26 - - - - - -<br />
United Kingdom 164 7 - - - - - - - - -<br />
United States 163 7 - - - - - - - - -<br />
Uruguay 127 8 - - - 7x 2x - 16x - -<br />
Uzbekistan 71 - 4 - - - - - - 18 0<br />
Vanuatu 77 7 - - - 20x - - 19x - -<br />
Venezuela 115 9 - - - 6x - 2x 6x 11 65<br />
Viet Nam 85 17 - - - 45 11 12 47 20 59<br />
Yemen 50 19 - - 31 39 13 - 39 32 21<br />
Yugoslavia, Fed. Rep. 127 - - - - - - - - - 70<br />
Zambia 13 13 13 88 34 28 9 6 53 51x 90<br />
Zimbabwe 65 14 16 93 26 16 3 6 21 42 80<br />
severe<br />
wasting<br />
moderate<br />
& severe<br />
stunting<br />
moderate<br />
& severe<br />
Total goitre rate<br />
(6-11 years)<br />
(%)<br />
1985-94<br />
% of<br />
households<br />
consuming<br />
iodized salt<br />
1992-96<br />
Regional summaries<br />
Sub-Saharan Africa 16 32 61 47 30 10 8 42 18 50<br />
Middle East and North Africa 11 43 39 - 17 5 7 23 20 52<br />
South Asia 33 46 32 65 51 19 17 52 18 61<br />
East Asia and Pacific 11 56 70 - 20 - - - 21 52<br />
Latin America and Caribbean 10 38 44 22 10 1 3 18 12 87<br />
CEE/CIS and Baltic States - - - - - - - - 20 25<br />
Industrialized countries 6 - - - - - - - - -<br />
Developing countries 18 44 45 50 30 11 11 37 18 57<br />
Least developed countries 23 46 56 51 39 13 10 47 29 38<br />
World 17 44 45 50 30 11 11 37 18 56<br />
Countries in each region are listed on page 122.<br />
Definitions of the indicators<br />
Low birthweight – Less than 2,500 grams.<br />
Underweight – Moderate and severe — below minus two standard deviations from median<br />
weight for age of reference population; severe — below minus three standard deviations<br />
from median weight for age of reference population.<br />
Wasting – Moderate and severe — below minus two standard deviations from median<br />
weight for height of reference population.<br />
Stunting – Moderate and severe — below minus two standard deviations from median<br />
height for age of reference population.<br />
Main data sources<br />
Low birthweight – World Health Organization (WHO).<br />
Breastfeeding – Demographic and Health Surveys, Multiple Indicator Cluster Surveys (MICS)<br />
and World Health Organization (WHO).<br />
Underweight, wasting and stunting – Demographic and Health Surveys, Multiple Indicator<br />
Cluster Surveys (MICS) and World Health Organization (WHO).<br />
Salt iodization – UNICEF and Multiple Indicator Cluster Surveys (MICS).<br />
Goitre rate – World Health Organization (WHO).<br />
Total goitre rate – Percentage of children aged 6-11 with palpable or visible goitre. This is an<br />
indicator of iodine deficiency, which causes brain damage and mental retardation.<br />
Notes - Data not available.<br />
x Indicates data that refer to years or periods other than those specified in the column heading, differ from the standard definition, or refer to only part of a country.<br />
101
Table 3: Health<br />
Under-5<br />
mortality<br />
rank<br />
% of population<br />
with access to<br />
safe water<br />
1990-96<br />
total urban rural<br />
% of population<br />
with access to<br />
adequate sanitation<br />
1990-96<br />
% of routine<br />
EPI vaccines<br />
financed by<br />
government<br />
1995-96<br />
% fully immunized 1995-96<br />
1-year-old children<br />
total urban rural total TB DPT polio measles<br />
Afghanistan 4 12 39 5 8 38 1 0 47 31 31 42 37 -<br />
Albania 88 - - - - - - - 94 98 100 92 - -<br />
Algeria 92 78 91 64 91 99 80 - 94 75 75 68 34 98<br />
Andorra 175 - - - - - - - - - - - - -<br />
Angola 2 32 69 15 16 34 8 - 74 42 42 65 28 -<br />
Antigua and Barbuda 127 - - - 96 - - 100 - 100 100 100 - -<br />
Argentina 117 71 77 29 68 73 37 100 100 83 90 100 63 -<br />
Armenia 108 - - - - - - 0 82 86 97 89 - -<br />
Australia 175 - - - - - - - - - - - - -<br />
Austria 175 - - - - - - - - 90 90 60 - -<br />
Azerbaijan 85 - - - - - - - 90 95 97 99 - -<br />
Bahamas 123 - - - - - - 100 - 85 85 92 75x -<br />
Bahrain 127 - 100 - - 100 - - - 98 98 95 54 5<br />
Bangladesh 44 97 99 96 48 79 44 74 88 66 66 59 72 96<br />
Barbados 152 100 100 100 100 100 100 100 - 88 85 100 100 -<br />
Belarus 139 - - - - - - - 93x 95 94 74 - -<br />
Belgium 164 - - - - - - - - 97 94 70 - -<br />
Belize 85 89 96 82 57 23 87 100 90 85 85 81 88 -<br />
Benin 31 50 41 53 20 54 6 15 90 80 80 74 75 60<br />
Bhutan 36 58 75 54 70 90 66 0 98 87 86 86 70 85<br />
Bolivia 51 63 86 32 58 74 37 65 90 76 76 87 52 41<br />
Bosnia and Herzegovina 143 - - - - - - - 97 88 86 88 - -<br />
Botswana 80 93x 100x 91x 55 91 41 100 67 83 81 82 61 -<br />
Brazil 79 76 88 25 70 80 30 100 90 75 73 74 45 54<br />
Brunei Darussalam 154 - - - - - - - 100x 100x 100x 100x 50x -<br />
Bulgaria 136 - - - - - - - 98 100 94 93 - -<br />
Burkina Faso 23 42 66 37 37 41 33 34 61 48 48 54 27 100<br />
Burundi 17 52 92 49 51 60 50 - 77 63 63 50 33 -<br />
Cambodia 19 36 65 33 14 81 8 0 90 75 76 72 36 -<br />
Cameroon 51 50 57 43 50 64 36 - 54 46 46 46 12 43<br />
Canada 164 - - - - - - - - 93 89 98 - -<br />
Cape Verde 65 51 70 34 24 40 10 100 80 73 73 66 4 -<br />
Central African Rep. 21 38 55 21 27 38 16 - 94 53 53 46 15 100<br />
Chad 27 24 48 17 21 73 7 100 40 19 19 28 50 -<br />
Chile 149 95 98 81 - 86 - 100 96 92 92 96 - -<br />
China 82 67 97 56 24 74 7 100 97 95 96 97 13 85<br />
Colombia 104 85 97 56 85 97 56 99 98 92 93 95 57 53<br />
Comoros 39 53 76 45 23 40 16 - 89 60 57 48 34 32<br />
Congo 48 34 53 7 69 - - 0 50 47 47 42 55 41<br />
Congo, Dem. Rep. 12 42 89 26 18 53 6 - 51 36 36 41 20 90<br />
Cook Islands 108 100 100 100 100 100 100 50 90 75 75 72 64 -<br />
Costa Rica 146 96 100 92 84 95 70 100 91 84 84 86 90 31<br />
Côte d’Ivoire 25 42 56 32 39 71 17 100 68 55 55 65 22 73<br />
Croatia 154 - - - - - - - 90 91 91 91 91 5<br />
Cuba 159 93 96 85 66 71 51 - 99 100 93x 94 61x -<br />
Cyprus 159 - 100 - - 96 - - - 98 98 90 57x -<br />
Czech Rep. 164 - - - - - - - 96 97 98 97 - -<br />
Denmark 175 - - - - - - - - 89x 100x 88x - -<br />
Djibouti 24 90 77 100 55 64 24 - 58 49 49 47 39 -<br />
Dominica 133 96 97 95 80 80 85 100 100 100 100 100 - -<br />
Dominican Rep. 74 65 80 - 78 76 83 100 98 58 48 78 96 39<br />
Ecuador 88 68 80 49 76 95 49 100 100 88 89 79 25 64<br />
Egypt 58 87 97 79 88 98 79 100 91 77 77 85 55 95<br />
El Salvador 88 69 85 46 81 91 65 100 100 100 100 97 69 69<br />
Equatorial Guinea 18 95 88 100 54 61 48 - 99 64 64 61 63 -<br />
Eritrea 41 22 60 8 13 48 - 0 52 46 46 38 23 38<br />
Estonia 145 - - - - - - - 99 90 93 86 - -<br />
Ethiopia 16 25 91 19 19 97 7 0 87 67 67 54 36 95<br />
pregnant<br />
women<br />
tetanus<br />
ORT<br />
use rate<br />
(%)<br />
1990-97<br />
102
Under-5<br />
mortality<br />
rank<br />
% of population<br />
with access to<br />
safe water<br />
1990-96<br />
total urban rural<br />
% of population<br />
with access to<br />
adequate sanitation<br />
1990-96<br />
% of routine<br />
EPI vaccines<br />
financed by<br />
government<br />
1995-96<br />
% fully immunized 1995-96<br />
1-year-old children<br />
total urban rural total TB DPT polio measles<br />
…Table 3<br />
Fiji 121 100 100 100 92 100 85 50 100 97 99 94 100 -<br />
Finland 189 - - - - - - - 100 100 100 98 - -<br />
France 175 - - - - - - - 83 96 97 82 - -<br />
Gabon 28 68x 90x 50x - - - - 54 41 41 38 4 25<br />
Gambia 49 48 67 - 37 83 23 100 99 97 97 89 92 -<br />
Georgia 113 - - - - - - - 30 58 82 63 - 14<br />
Germany 175 - - - - - - - - 45 80 75 - -<br />
Ghana 47 65 88 52 55 62 44 50 65 51 52 53 9 93<br />
Greece 161 - - - - - - - 70 78 95 90 - -<br />
Grenada 104 - - - - - - 100 - 80 80 85 80 -<br />
Guatemala 74 77 76 78 83 95 74 100 76 73 73 69 81 22<br />
Guinea 11 46 69 36 31 54 19 - 59 48 48 49 43 31<br />
Guinea-Bissau 6 59 32 67 30 24 32 0 72 56 58 53 43 -<br />
Guyana 56 61 90 45 81 82 80 100 88 83 83 91 56 -<br />
Haiti 34 37 50 28 25 49 17 0 68 34 34 31 49 31<br />
Holy See - - - - - - - - - - - - - -<br />
Honduras 97 87 96 79 87 97 78 100 100 93 94 91 99 32<br />
Hungary 152 - - - - - - - 100 100 100 100 - -<br />
Iceland 186 - - - - - - - - 98x 99x 98x - -<br />
India 46 81 85 79 29 70 14 100 96 89 90 81 78 67<br />
Indonesia 67 62 78 54 51 73 40 100 99 91 90 92 75 97<br />
Iran 96 90 98 82 81 86 74 100 90 96 97 95 50 37<br />
Iraq 39 78 92 44 70 85 37 0 99 94 95 97 65 -<br />
Ireland 164 - - - - - - - - - - - - -<br />
Israel 161 - - - - - - - - 92 93 94 - -<br />
Italy 164 - - - - - - - - 50 98 50 - -<br />
Jamaica 154 86 - - 89 100 80 100 98 92 92 99 82 -<br />
Japan 175 97x 100x 85x - 85x - - 91 85 91 68 - -<br />
Jordan 117 98 - - 77 - - - - 99 99 98 41 41<br />
Kazakstan 84 93 99 84 99 100 98 20 93 94 98 97 - 31<br />
Kenya 55 53 67 49 77 69 81 0 56 46 43 38 21 76<br />
Kiribati 61 100 100 100 100 100 100 75 100 79 82 64 41 -<br />
Korea, Dem. People’s Rep. 108 81 - - - - - - 60 96 58 60 95 -<br />
Korea, Rep. of 164 93 100 76 100 100 100 - 93x 93x 93x 92x - -<br />
Kuwait 147 - - - - 100x - - - 100 100 99 21 -<br />
Kyrgyzstan 80 71 - - 94 - - - 90 82 81 80 - 98<br />
Lao People’s Dem. Rep. 35 44 - - 18 - - 0 62 28 33 62 45 -<br />
Latvia 133 - - - - - - - 100 64 77 82 64 -<br />
Lebanon 88 94 96 88 63 81 8 - - 94 94 85 - 82<br />
Lesotho 32 62 91 57 38 56 35 - 55 58 58 82 10 84<br />
Liberia 5 46 79 13 30 56 4 0 84 45 45 44 35 94<br />
Libya 70 97 97 97 98 99 94 - 99 96 96 92 45x 49<br />
Liechtenstein 164 - - - - - - - - - - - - -<br />
Lithuania 139 - - - - - - - 98 91 93 96 - -<br />
Luxembourg 164 - - - - - - - - 95x 90x 80x - -<br />
Madagascar 21 34 68 21 41 77 29 10 87 73 73 68 33 85<br />
Malawi 8 37 80 32 6 22 4 - 95 90 82 89 56 78<br />
Malaysia 149 78 96 66 94 - - - 97x 90x 90x 81x 79x -<br />
Maldives 61 96 100 81 66 100 54 - 98 95 95 94 93 -<br />
Mali 7 66 87 55 6 12 3 65 70 29 30 35 32 29<br />
Malta 154 - - - - - - - 96 84 92 51 - -<br />
Marshall Islands 54 74 100 45 74 100 45 100 88 74 75 69 15x -<br />
Mauritania 15 74 88 59 32 44 19 0 93 50 50 53 28 51<br />
Mauritius 123 98 95 100 100 100 100 100 87 90 90 61 79 -<br />
Mexico 102 83 92 57 72 85 32 100 97 83 84 75 69 81<br />
Micronesia, Fed. States of 116 100 100 100 100 100 100 100 50 83 81 90 44 -<br />
Moldova, Rep. of 102 55x 98x 18x 50x 90x 8x - 98 97 99 98 - -<br />
Monaco 175 - - - - - - - - - - - - -<br />
pregnant<br />
women<br />
tetanus<br />
ORT<br />
use rate<br />
(%)<br />
1990-97<br />
103
Table 3: Health<br />
Under-5<br />
mortality<br />
rank<br />
% of population<br />
with access to<br />
safe water<br />
1990-96<br />
total urban rural<br />
% of population<br />
with access to<br />
adequate sanitation<br />
1990-96<br />
% of routine<br />
EPI vaccines<br />
financed by<br />
government<br />
1995-96<br />
% fully immunized 1995-96<br />
1-year-old children<br />
total urban rural total TB DPT polio measles<br />
Mongolia 67 40 73 3 86 99 74 - 92 90 90 88 - -<br />
Morocco 64 65 98 34 58 94 24 100 96 95 95 93 100 29<br />
Mozambique 9 63 - - 54 - - 0 83 60 60 67 61 83<br />
Myanmar 25 60 78 50 43 56 36 0 92 88 87 86 79 96<br />
Namibia 60 57 87 42 34 77 12 - 79 70 71 61 75 66<br />
Nauru 104 - - - - - - - - - - - - -<br />
Nepal 42 63 88 60 18 58 12 40 73 51 48 45 11x 29<br />
Netherlands 175 - - - - - - - - 97 97 94 - -<br />
New Zealand 164 97x 100x 82x - - - - 20 84 84 87 - -<br />
Nicaragua 73 61 81 27 31 34 27 99 93 78 86 78 96 54<br />
Niger 1 48 76 44 17 79 5 0 63 33 33 59 31 85<br />
Nigeria 14 50 80 39 57 82 48 100 49 28 32 45 36 86<br />
Niue - 100 100 100 100 100 100 25 100 100 100 100 - -<br />
Norway 175 - - - - - - - - 92 92 93 - -<br />
Oman 139 82 - - 78 - - 100 96 100 100 98 98 85<br />
Pakistan 33 74 82 69 47 77 22 100 93 77 77 78 54 97<br />
Palau 97 88 - - 98 - - - 100 100 100 100 55 -<br />
Panama 133 93 - - 83 - - 100 100 93 93 92 24 94<br />
Papua New Guinea 44 28 84 17 22 82 11 - 78 55 57 44 50 -<br />
Paraguay 100 60 - - 41 65 14 100 89 80 81 81 69 33<br />
Peru 72 67 84 33 72 89 37 100 93 72 66 71 51 55<br />
Philippines 93 84 93 80 75 89 63 88 82 70 67 72 47 87<br />
Poland 147 - - - - - - - 94 95 95 91 - -<br />
Portugal 164 - - - - - - - 91 95 95 99 - -<br />
Qatar 132 - 100 - - 100 - - 98 92 92 86 - 71<br />
Romania 117 - - - - - - 100 100 98 97 94 - -<br />
Russian Federation 117 - - - - - - - 97 87 97 95 - -<br />
Rwanda 19 - - 79 - - 85 - 93 98 98 76 43 47<br />
Saint Kitts and Nevis 93 100 100 100 100 98 100 100 - 100 98 100 - -<br />
Saint Lucia 127 - - - - - - 100 89 88 88 95 - -<br />
Saint Vincent/Grenadines 123 89 100 85 98 100 100 100 100 100 100 100 - -<br />
Samoa 77 82 100 77 94 100 92 30 98 95 95 96 96 -<br />
San Marino 149 - - - - - - - - - - - - -<br />
Sao Tome and Principe 57 82 - - 35 - - - 85 66 61 57 49 74<br />
Saudi Arabia 108 95x 100x 74x 86x 100x 30x - 91 93 93 92 60 58<br />
Senegal 36 63 90 44 39 71 15 100 80 62 62 60 34 84<br />
Seychelles 136 - - - - - - - 100 100 100 98 100 -<br />
Sierra Leone 3 34 58 21 11 17 8 3 77 65 65 79 65 -<br />
Singapore 189 100x 100x - - - - - 97 95 93 88 - -<br />
Slovakia 154 - - - - - - - 98 98 98 99 - -<br />
Slovenia 175 - - - - - - - 99x 98x 98x 91x - -<br />
Solomon Islands 113 61 82 58 11 73 2 60 71 72 72 67 63 -<br />
Somalia 10 31 46 28 43 69 35 0 43 21 21 33 28 97<br />
South Africa 69 99 99 53 53 85 12 100 95 73 72 76 26x -<br />
Spain 186 - - - - - - - - 88 90 90x - -<br />
Sri Lanka 136 57 88 52 63 68 62 100 88 90 91 86 81 34<br />
Sudan 42 50 66 45 22 79 4 0 96 79 80 75 44 35<br />
Suriname 104 - - - - - 43 100 - 80 79 78 99x -<br />
Swaziland 53 60 89 46 70 92 59 - 68 70 71 59 65 99<br />
Sweden 189 - - - - - - - - 99 99 96 - -<br />
Switzerland 186 - - - - - - - - - - - - -<br />
Syria 100 86 95 77 67 96 31 100 100 96 96 95 78 27<br />
Tajikistan 61 60 82 49 - 46 - - 96 93 96 80 - -<br />
Tanzania 29 38 73 29 86 96 84 0 96 85 80 81 92 91<br />
TFYR Macedonia 108 - - - - - - 14 98 93 94 90 91x -<br />
Thailand 93 89 94 88 96 98 95 - 98 94 94 85 88 95<br />
Togo 38 55 82 41 41 76 22 0 63 82 82 39 43 94<br />
Tonga 123 100 100 100 100 100 100 50 99 95 93 94 88 -<br />
pregnant<br />
women<br />
tetanus<br />
ORT<br />
use rate<br />
(%)<br />
1990-97<br />
104
Under-5<br />
mortality<br />
rank<br />
% of population<br />
with access to<br />
safe water<br />
1990-96<br />
total urban rural<br />
% of population<br />
with access to<br />
adequate sanitation<br />
1990-96<br />
% of routine<br />
EPI vaccines<br />
financed by<br />
government<br />
1995-96<br />
% fully immunized 1995-96<br />
1-year-old children<br />
total urban rural total TB DPT polio measles<br />
…Table 3<br />
Trinidad and Tobago 143 97 99 91 79 99 98 100 - 89 90 88 19x -<br />
Tunisia 97 98 100 95 80 96 52 100 86 91 91 86 80 41<br />
Turkey 82 49 63 28 62 83 31 100 69 84 83 84 32 100<br />
Turkmenistan 58 74 - - 91 - - 9 88 80 83 66 - 98<br />
Tuvalu 74 97 100 95 87 90 85 70 88 87 85 94 53 -<br />
Uganda 30 46 77 41 57 75 55 35 96 68 67 66 55 49<br />
Ukraine 121 - - - - - - - 92x 94x 95x 96x - -<br />
United Arab Emirates 139 95 - - 77 93 22 - 98 90 90 90 - -<br />
United Kingdom 164 - - - - - - - - 94 96 92 - -<br />
United States 163 - - - - - - - - 94 84 89 - -<br />
Uruguay 127 - 95 - - 98 - 100 98 89 89 85 13x -<br />
Uzbekistan 71 62 82 49 22 46x - 16 95 89 99 81 - -<br />
Vanuatu 77 87x - - 91x - - 100 72 67 68 61 15 -<br />
Venezuela 115 79 80 75 59 64 30 100 90 57 73 64 60 -<br />
Viet Nam 85 43 47 42 21 43 15 29 95 94 94 96 82 -<br />
Yemen 50 61 88 55 24 47 17 0 59 59 59 51 55 92<br />
Yugoslavia, Fed. Rep. 127 - - - - - - 0 97 91 94 81x - -<br />
Zambia 13 27 50 17 64 89 43 10 100 83 81 93 48 99<br />
Zimbabwe 65 79 99 69 52 96 32 90 74 80 80 77 65 60<br />
pregnant<br />
women<br />
tetanus<br />
ORT<br />
use rate<br />
(%)<br />
1990-97<br />
Regional summaries<br />
Sub-Saharan Africa 49 79 36 44 73 33 48 70 52 53 56 38 81<br />
Middle East and North Africa 81 95 67 72 91 52 71 91 86 87 86 57 59<br />
South Asia 80 85 78 33 71 19 93 93 83 83 77 71 73<br />
East Asia and Pacific 67 93 57 35 76 18 89 95 92 92 92 35 87<br />
Latin America and Caribbean 77 88 46 71 81 41 97 93 79 79 78 58 58<br />
CEE/CIS and Baltic States - - - - - - - 89 89 93 89 - -<br />
Industrialized countries - - - - - - - - 86 89 83 - -<br />
Developing countries 70 88 61 42 78 23 82 88 79 80 78 51 76<br />
Least developed countries 54 78 48 35 66 28 21 78 60 60 59 48 80<br />
World 71 89 61 42 78 23 82 89 80 81 79 51 76<br />
Countries in each region are listed on page 122.<br />
Definitions of the indicators<br />
Government funding of vaccines – Percentage of vaccines routinely administered in<br />
a country to protect children against TB, DPT, measles and polio that are financed by the<br />
national government.<br />
EPI – Extended Programme on Immunization: the immunizations in this programme include<br />
those against TB, DPT, polio and measles, as well as protecting babies against neonatal<br />
tetanus by vaccination of pregnant women. Other vaccines (e.g. against hepatitis B or<br />
yellow fever) may be included in the programme in some countries.<br />
DPT – Diphtheria, pertussis (whooping cough) and tetanus.<br />
Main data sources<br />
Access to safe drinking water and adequate sanitation facilities – UNICEF,<br />
World Health Organization (WHO) and Multiple Indicator Cluster Surveys (MICS).<br />
Government funding of vaccines – UNICEF.<br />
Immunization – World Health Organization (WHO), UNICEF, Multiple Indicator Cluster<br />
Surveys (MICS) and Demographic and Health Surveys (DHS).<br />
ORT use – Multiple Indicator Cluster Surveys (MICS), Demographic and Health Surveys and<br />
World Health Organization (WHO).<br />
ORT use – Percentage of all cases of diarrhoea in children under five years of age treated<br />
with oral rehydration salts and/or recommended home fluids.<br />
Notes - Data not available.<br />
x Indicates data that refer to years or periods other than those specified in the column heading, differ from the standard definition, or refer to only part of a country.<br />
105
Table 4: Education<br />
Under-5<br />
mortality<br />
rank<br />
Adult literacy rate<br />
1980 1995<br />
male female male female<br />
No. of sets<br />
per 1000<br />
population<br />
1994<br />
Primary school enrolment ratio<br />
1960 (gross) 1990-95 (gross) 1993-97 (net)<br />
radio television male female male female male female<br />
% of primary<br />
school<br />
children<br />
reaching<br />
grade 5<br />
1990-95<br />
Secondary school<br />
enrolment ratio<br />
1990-95<br />
(gross)<br />
Afghanistan 4 33 6 47 15 118 10 14 2 63 32 36y 11y 43x 32 11<br />
Albania 88 - - - - 190 91 102 86 98 99 95 97 82 36 37<br />
Algeria 92 55 24 74 49 236 79 55 37 111 98 99 91 95 66 58<br />
Andorra 175 - - - - 211 367 - - - - - - - - -<br />
Angola 2 16x 7x 56x 29x 30 7 30 14 95 87 - - 34 - -<br />
Antigua and Barbuda 127 - - - - 427 370 - - - - - - - - -<br />
Argentina 117 94 94 96 96 673 219 99 99 108 107 - - - 70 75<br />
Armenia 108 - - 100 99 - 225 - - 87 93 - - - 80 90<br />
Australia 175 - - - - 1291 489 103 103 107 106 98 98 99 83 86<br />
Austria 175 - - - - 619 480 106 104 103 103 100 100 96 109 104<br />
Azerbaijan 85 - - 100 99 - - - - 120 115 - - - 87 85<br />
Bahamas 123 98 96 99 98 735 226 125 112 100 103 92x 96x 78 95 95<br />
Bahrain 127 80 60 89 79 556 430 103 50 110 113 99 100 94 97 100<br />
Bangladesh 44 41 17 49 26 47 6 80 31 84 73 82y 82y 47x 25 13<br />
Barbados 152 97 94 98 97 877 279 116 101 90 91 78x 78x - 90x 80x<br />
Belarus 139 - - 100 99 285 226 - - 98 95 97 94 98 92 97<br />
Belgium 164 99x 99x - - 774 453 111 108 99 100 98 98 - 103 104<br />
Belize 85 - - 70 70 581 167 - - 113 109 100 98 70 46 52<br />
Benin 31 28 10 49 26 91 6 40 15 88 44 74 43 61 17 7<br />
Bhutan 36 41 15 56 28 17 - 5 0 31x 19x - - 82 7x 2x<br />
Bolivia 51 81 59 91 76 670 113 70 43 99 90 90y 89y 60 40 34<br />
Bosnia and Herzegovina 143 - - - - 227 - - - - - - - - - -<br />
Botswana 80 70 43 81 60 125 17 37 43 114 115 94 99 89 54 58<br />
Brazil 79 76 73 83 83 393 209 58 56 - - 93y 94y 70 - -<br />
Brunei Darussalam 154 86 68 93 83 271 241 117 101 113 106 91 91 95 67 73<br />
Bulgaria 136 - - 99 98 454 363 94 92 88 84 98 96 95 68 72<br />
Burkina Faso 23 19 4 30 9 28 6 12 5 48 31 37 24 79 12 6<br />
Burundi 17 37 12 49 23 64 2 31 10 76 62 56x 48x 74 8 5<br />
Cambodia 19 74x 23x 80x 53x 108 8 85 48 130 106 - - 50 31 18<br />
Cameroon 51 59 30 75 52 148 24 81 40 93 84 69y 60y 66 32 22<br />
Canada 164 - - - - 1051 685 108 105 104 102 96 94 97 106 106<br />
Cape Verde 65 64 38 81 64 176 3 40 28 132 130 100 100 - 28 26<br />
Central African Rep. 21 41 19 69 52 73 5 52 11 88x 55x 70y 55y 24 17x 6x<br />
Chad 27 47 19 62 35 246 1 30 4 75 36 - - 28 13 3<br />
Chile 149 92 91 95 95 345 211 87 86 100 98 87 85 92 66 70<br />
China 82 79 53 90 73 184 189 131 78 120 116 99 98 92 60 51<br />
Colombia 104 87 87 91 91 178 118 71 72 118 120 90y 91y 58 57 68<br />
Comoros 39 56 40 64 50 129 0 22 4 81 69 58 48 45 21 17<br />
Congo 48 65 40 83 67 115 7 - - - - - - 54 - -<br />
Congo, Dem. Rep. 12 75 45 87 68 98 2 93 34 78 58 71 50 64 33 15<br />
Cook Islands 108 - - - 99x 700 179 - - - - - - - - -<br />
Costa Rica 146 92 91 95 95 260 142 99 96 107 105 86x 87x 89 47 51<br />
Côte d’Ivoire 25 34 14 50 30 143 60 64 23 78 59 59y 46y 73 33 17<br />
Croatia 154 - - 98 97 261 253 - - 87 86 83 82 98 75 81<br />
Cuba 159 91 87 96 95 347 171 109 108 104 103 99 99 94 70 79<br />
Cyprus 159 - - 98x 91x 300 320 - - 100 100 96 96 100 96 98<br />
Czech Rep. 164 - - - - 631 478 - - 100 100 98 98 99 90 94<br />
Denmark 175 - - - - 1036 539 103 103 99 99 98 99 99 113 117<br />
Djibouti 24 45 18 60 33 81 44 32 12 43 33 37 28 82 15 10<br />
Dominica 133 - - - - 600 75 - - - - - - 84 - -<br />
Dominican Rep. 74 75 74 82 82 173 90 75 74 103 104 79 83 58 34 47<br />
Ecuador 88 86 79 92 88 327 88 82 75 124 122 91 92 77 54 56<br />
Egypt 58 54 26 64 39 307 109 79 52 105 91 83y 72y 98 82 71<br />
El Salvador 88 66 60 74 70 443 443 59 56 79 80 78 80 58 27 30<br />
Equatorial Guinea 18 77 45 90 68 424 10 92 54 - - - - - - -<br />
Eritrea 41 - - - - 87 0 - - 54 43 33 30 79 19 13<br />
Estonia 145 - - 98 98 467 367 - - 103 100 93 94 97 92 90<br />
Ethiopia 16 32 14 46 25 197 4 9 3 33 21 28 19 51 11 10<br />
male<br />
female<br />
106
…Table 4<br />
Under-5<br />
mortality<br />
rank<br />
Adult literacy rate<br />
1980 1995<br />
male female male female<br />
No. of sets<br />
per 1000<br />
population<br />
1994<br />
Primary school enrolment ratio<br />
1960 (gross) 1990-95 (gross) 1993-97 (net)<br />
radio television male female male female male female<br />
% of primary<br />
school<br />
children<br />
reaching<br />
grade 5<br />
1990-95<br />
Secondary school<br />
enrolment ratio<br />
1990-95<br />
(gross)<br />
Fiji 121 87 79 94 89 607 17 110 96 128 127 99x 100x 87 64 65<br />
Finland 189 - - - - 1003 511 100 95 100 100 99 99 100 110 130<br />
France 175 99x 98x - - 891 591 144 143 107 105 99 99 96 104 107<br />
Gabon 28 54 28 74 53 147 38 - - - - 87y 86y 50x - -<br />
Gambia 49 37 13 53 25 163 3 21 10 79 56 51y 43y 87 25 13<br />
Georgia 113 - - 100 99 550 459 - - 82 81 81 82 98 82 76<br />
Germany 175 - - - - 935 560 - - 97 98 100 100 99 101 100<br />
Ghana 47 59 31 76 54 229 89 58 31 83 70 70y 69y 80 45 29<br />
Greece 161 93x 76x 98 95 418 206 104 101 95 95 98x 98x 100 99 96<br />
Grenada 104 - - - - 595 337 - - - - - - - - -<br />
Guatemala 74 56 41 63 49 68 53 48 39 89 78 61y 55y - 25 23<br />
Guinea 11 34 11 50 22 43 8 30 11 61 30 39y 26y 54 18 6<br />
Guinea-Bissau 6 53 26 68 43 40 - 35 15 77x 42x 60x 33x 20x 9x 4x<br />
Guyana 56 96 93 99 98 491 39 110 99 113x 111x 90 89 93 56x 59x<br />
Haiti 34 36 29 48 42 50 5 39 31 58 54 68y 69y 47 22 21<br />
Holy See - - - - - - - - - - - - - - - -<br />
Honduras 97 64 61 73 73 408 78 68 67 111 112 89 91 - 29 37<br />
Hungary 152 98x 98x 99 99 625 429 103 100 97 97 92 94 98 79 83<br />
Iceland 186 - - - - 793 350 - - 100 96 - - - 105 105<br />
India 46 55 25 66 38 81 40 83 44 113 91 75y 61y 62 59 38<br />
Indonesia 67 78 58 90 78 148 62 78 58 117 113 99 95 90 49 41<br />
Iran 96 61 37 78 59 237 62 57 27 104 97 99y 93y 90 76 62<br />
Iraq 39 55 25 71 45 218 75 94 36 98 83 83x 74x 72x 53 34<br />
Ireland 164 - - - - 636 302 107 112 104 104 100 100 100 110 115<br />
Israel 161 93x 83x 97x 93x 478 275 99 97 95 95 - - 100 83 89<br />
Italy 164 95x 92x 99 98 802 437 112 109 98 99 - - 97 81 82<br />
Jamaica 154 73 81 81 89 436 142 78 79 109 108 100x 100x 96 62 70<br />
Japan 175 100x 99x - - 912 681 103 102 102 102 100 100 100 98 99<br />
Jordan 117 82 54 93 79 243 76 - - 94 95 89x 89x 98 52 54<br />
Kazakstan 84 - - 100 99 376 250 - - 86 86 - - - 89 92<br />
Kenya 55 72 44 86 70 88 11 62 29 92 91 85y 83y 68 28 23<br />
Kiribati 61 - - - 92x 209 - - - - - - - 90 - -<br />
Korea, Dem. People’s Rep. 108 - - - - 126 43 - - 108x 101x - - - - -<br />
Korea, Rep. of 164 97 90 99 97 1017 323 108 94 95 96 98 99 100 100 99<br />
Kuwait 147 73 59 82 75 445 380 132 99 69 69 65 65 100 65 64<br />
Kyrgyzstan 80 - - 99 95 - - - - 110 111 86y 87y 92 84 89<br />
Lao People’s Dem. Rep. 35 56 28 69 44 127 8 43 20 123 92 70y 67y 53 31 19<br />
Latvia 133 - - 100 100 662 465 - - 85 81 86 82 96 84 89<br />
Lebanon 88 91 82 95 90 889 360 111 105 114 110 - - - 75 83<br />
Lesotho 32 71 45 81 62 33 10 73 109 93 104 60 71 79 23 34<br />
Liberia 5 38 11 54 22 228 19 40 14 - - 59y 53y - - -<br />
Libya 70 73 31 88 63 226 100 70 18 110 110 98x 96x - 95 95<br />
Liechtenstein 164 - - 100x 100x 661 337 - - - - - - - - -<br />
Lithuania 139 - - 100 99 387 386 - - 97 95 - - 98 80 84<br />
Luxembourg 164 - - - - 636 374 - - 88 94 - - - 78 78<br />
Madagascar 21 56x 43x 60 32 192 20 74 57 75 72 62y 61y 28 14 14<br />
Malawi 8 64 28 72 42 226 - 50 26 126 114 100 100 94 6 4<br />
Malaysia 149 80 60 89 78 432 157 108 79 93 94 91 92 94 58 64<br />
Maldives 61 91 89 93 93 118 25 2 3 136 133 - - 93 49 49<br />
Mali 7 20 9 39 23 44 1 15 6 39 25 30 19 86 11 6<br />
Malta 154 - - 91 92 530 747 - - 110 107 100 99 97 93 83<br />
Marshall Islands 54 - - - 90x - - - - - - - - - - -<br />
Mauritania 15 41 19 50 26 147 25 12 3 81 66 64 55 63 19 11<br />
Mauritius 123 82 67 87 79 367 222 97 90 107 106 96 96 99 58 60<br />
Mexico 102 86 80 92 87 256 163 82 77 114 110 - - 85 57 58<br />
Micronesia, Fed. States of 116 - - - 79x - - - - - - - - - - -<br />
Moldova, Rep. of 102 - - 98 99 679 271 - - 95 94 - - 93 71 74<br />
Monaco 175 - - - - 1016 741 - - - - - - 100 - -<br />
male<br />
female<br />
107
Table 4: Education<br />
Under-5<br />
mortality<br />
rank<br />
Adult literacy rate<br />
1980 1995<br />
male female male female<br />
No. of sets<br />
per 1000<br />
population<br />
1994<br />
Primary school enrolment ratio<br />
1960 (gross) 1990-95 (gross) 1993-97 (net)<br />
radio television male female male female male female<br />
% of primary<br />
school<br />
children<br />
reaching<br />
grade 5<br />
1990-95<br />
Secondary school<br />
enrolment ratio<br />
1990-95<br />
(gross)<br />
Mongolia 67 82 63 89 77 136 42 74 75 82 87 78 81 - 50 70<br />
Morocco 64 42 16 57 31 219 79 60 24 92 68 81 62 78 43 32<br />
Mozambique 9 44 12 58 23 37 4 57 34 75 54 45 35 47 10 6<br />
Myanmar 25 86 68 89 78 82 5 60 53 112 108 85y 85y - 23 23<br />
Namibia 60 - - 78x 74x 139 23 43 48 136 138 - - 76 57 69<br />
Nauru 104 - - - - 577 - - - - - - - - - -<br />
Nepal 42 31 7 41 14 35 5 20 3 129 88 80y 60y 52 46 23<br />
Netherlands 175 - - - - 909 494 105 104 96 98 99 99 - 129 118<br />
New Zealand 164 - - - - 991 510 110 106 103 101 100 100 94 111 114<br />
Nicaragua 73 61 61 65 67 262 67 57 58 102 105 82 85 47 40 47<br />
Niger 1 14 3 21 7 61 5 8 3 35 21 34y 19y 77 9 5<br />
Nigeria 14 47 23 67 47 196 38 54 31 100 79 60y 58y 80 33 28<br />
Niue - - - - 99x 563 - - - - - - - - - -<br />
Norway 175 - - - - 799 428 100 100 99 99 99 99 100 118 114<br />
Oman 139 - - 71x 46x 583 662 - - 85 80 72 70 96 67 61<br />
Pakistan 33 38 15 50 24 88 19 39 11 94 42 71y 62y 48 33 17<br />
Palau 97 - - - 97x - - - - - - - - - - -<br />
Panama 133 86 85 91 90 227 170 90 86 108 104 91x 92x 82 60 65<br />
Papua New Guinea 44 70 45 81 63 76 3 24 15 88 75 - - 59 17 11<br />
Paraguay 100 90 84 94 91 172 83 106 94 111 108 89 89 71 38 40<br />
Peru 72 89 71 95 83 255 99 98 74 - - 91 90 - - -<br />
Philippines 93 91 89 95 94 144 48 98 93 110 111 89y 91y 70 - -<br />
Poland 147 99x 97x 99x 98x 441 308 110 107 100 98 97 96 100 95 96<br />
Portugal 164 78x 65x 92 87 233 321 132 129 122 118 100 100 - 63 74<br />
Qatar 132 72 65 79 80 428 398 111 63 89 84 81 80 95 82 82<br />
Romania 117 98x 93x 99 97 204 201 101 95 94 93 92 92 99 77 78<br />
Russian Federation 117 - - 100 99 339 377 - - 109 108 100 100 - 84 91<br />
Rwanda 19 55 30 70 52 67 - 65 29 78 76 76x 76x 60 11 9<br />
Saint Kitts and Nevis 93 - - - - 666 213 - - - - - - - - -<br />
Saint Lucia 127 - - - - 764 189 - - - - - - 96 - -<br />
Saint Vincent/Grenadines 123 - - - - 667 147 - - - - - - - - -<br />
Samoa 77 - - - 98x 462 39 - - - - 100 99 - - -<br />
San Marino 149 - - - - 592 352 - - - - - - 100 - -<br />
Sao Tome and Principe 57 - - 73x 42x 270 162 - - - - - - - - -<br />
Saudi Arabia 108 60 32 72 50 294 255 32 3 79 75 63 61 94 57 47<br />
Senegal 36 31 12 43 23 117 37 36 18 68 51 60 48 81 21 11<br />
Seychelles 136 - - 83x 86x 490 88 - - - - - - 97 - -<br />
Sierra Leone 3 30 9 45 18 233 11 30 15 60 42 - - - 22 12<br />
Singapore 189 92 74 96 86 645 390 122 101 109x 107x - - 100x 69x 71x<br />
Slovakia 154 - - - - 568 474 - - 101 101 - - 97 88 93<br />
Slovenia 175 - - 100x 99x 378 320 - - 100 100 100 99 98 89 91<br />
Solomon Islands 113 - - - 56x 122 6 - - 104 90 - - 81 21 14<br />
Somalia 10 8x 1x 36x 14x 41 13 4 1 - - - - - - -<br />
South Africa 69 77 75 82 82 314 101 - - 119 115 95 96 65 76 88<br />
Spain 186 94x 86x 98 96 312 402 106 116 104 105 100 100 98 107 120<br />
Sri Lanka 136 91 80 93 87 201 50 125 112 106 104 - - 98 71 79<br />
Sudan 42 43 17 58 35 258 80 29 11 61 48 59y 52y 94 24 19<br />
Suriname 104 92 84 95 91 680 141 113 106 129x 125x - - - 50x 58x<br />
Swaziland 53 64 57 78 76 163 20 58 58 125 119 95 96 78 53 51<br />
Sweden 189 - - - - 879 475 95 96 100 100 100 100 98 99 100<br />
Switzerland 186 - - - - 841 416 118 118 100 102 100 100 100 93 89<br />
Syria 100 72 34 86 56 257 62 89 39 108 97 95 87 91 50 41<br />
Tajikistan 61 - - 100 100 - - - - 91 88 - - - 83 75<br />
Tanzania 29 66 34 79 57 26 2 33 16 71 69 47 48 83 6 5<br />
TFYR Macedonia 108 - - - - 182 166 - - 88 87 86 84 99 55 56<br />
Thailand 93 92 84 96 92 190 117 92 84 98 97 - - 88 38 37<br />
Togo 38 49 18 67 37 212 8 64 25 122 81 98 72 71 34 12<br />
Tonga 123 - - - 99x 561 16 - - - - - - 92 - -<br />
male<br />
female<br />
108
…Table 4<br />
Under-5<br />
mortality<br />
rank<br />
Adult literacy rate<br />
1980 1995<br />
male female male female<br />
No. of sets<br />
per 1000<br />
population<br />
1994<br />
Primary school enrolment ratio<br />
1960 (gross) 1990-95 (gross) 1993-97 (net)<br />
radio television male female male female male female<br />
% of primary<br />
school<br />
children<br />
reaching<br />
grade 5<br />
1990-95<br />
Secondary school<br />
enrolment ratio<br />
1990-95<br />
(gross)<br />
Trinidad and Tobago 143 97 93 99 97 491 317 111 108 94 94 83 94 95 74 78<br />
Tunisia 97 61 32 79 55 199 81 88 43 123 113 98 95 92 58 53<br />
Turkey 82 81 50 92 72 162 181 90 58 101 94 98 94 95 76 50<br />
Turkmenistan 58 - - 99x 97x - 180 - - - - 81y 80y - - -<br />
Tuvalu 74 - - - - 310 - - - - - - - 96 - -<br />
Uganda 30 62 32 74 50 107 11 39 18 74 59 65y 63y 55 14 8<br />
Ukraine 121 - - 98 99 812 340 - - 87 87 - - 54 88 95<br />
United Arab Emirates 139 72 64 79 80 312 107 - - 112 108 84 82 98 88 97<br />
United Kingdom 164 - - - - 1429 439 92 92 114 114 100 100 - 93 95<br />
United States 163 99x 99x - - 2122 817 - - 107 106 96 97 99 98 97<br />
Uruguay 127 94 95 97 98 606 232 117 117 110 109 95 95 96 74 88<br />
Uzbekistan 71 - - 100 100 81 190 - - 78 76 83y 83y - 99 87<br />
Vanuatu 77 - - - 60x 294 13 - - 105 107 76x 72x 61 23 18<br />
Venezuela 115 86 82 92 90 443 164 73 74 93 96 87x 90x 78 29 41<br />
Viet Nam 85 90 78 97 91 104 43 103 74 - - - - - - -<br />
Yemen 50 14x 3x 53x 26x 32 28 - - 118 47 73y 39y - 37 9<br />
Yugoslavia, Fed. Rep. 127 - - 99 97 207 179 - - 68 71 69x 70x 100 61 63<br />
Zambia 13 65 43 86 71 83 27 54 36 85 79 76 75 - 31 19<br />
Zimbabwe 65 83 68 90 80 86 27 82 65 119 111 91y 90y 90 49 39<br />
male<br />
female<br />
Regional summaries<br />
Sub-Saharan Africa 51 30 66 47 147 26 47 24 81 67 61 55 67 27 22<br />
Middle East and North Africa 55 27 70 47 255 99 65 34 99 85 85 76 91 62 51<br />
South Asia 52 24 63 36 80 34 77 39 107 82 75 63 59 52 33<br />
East Asia and Pacific 80 58 91 76 196 156 119 76 117 113 98 96 90 57 49<br />
Latin America and Caribbean 82 77 88 85 349 170 74 70 107 105 89 90 74 52 56<br />
CEE/CIS and Baltic States 92 81 98 96 379 308 100 86 98 96 95 94 89 84 82<br />
Industrialized countries 98 96 98 96 1287 623 109 109 105 104 98 98 99 98 99<br />
Developing countries 68 46 79 62 178 105 92 58 105 92 83 76 75 52 41<br />
Least developed countries 47 24 60 38 96 10 48 23 78 62 64 55 58 22 13<br />
World 74 56 81 66 359 197 95 64 105 93 85 79 77 58 50<br />
Countries in each region are listed on page 122.<br />
Definitions of the indicators<br />
Adult literacy rate – Percentage of persons aged 15 and over who can read and write.<br />
Gross primary or secondary school enrolment ratio – The number of children enrolled in<br />
a level (primary or secondary), regardless of age, divided by the population of the age group<br />
which officially corresponds to the same level.<br />
Net primary school enrolment ratio – The number of children enrolled in primary school,<br />
who belong to the age group that officially corresponds to primary schooling, divided by the<br />
total population of the same age group. Data from household surveys on children attending<br />
school have been used to fill blanks and to replace UNESCO reported data that are three<br />
years or more older than the survey data. Such data are identified by a ‘y’.<br />
Main data sources<br />
Adult literacy – United Nations Educational, Scientific and Cultural Organization (UNESCO).<br />
Radio and television – United Nations Educational, Scientific and Cultural Organization<br />
(UNESCO).<br />
Net primary school enrolment – United Nations Educational, Scientific and Cultural<br />
Organization (UNESCO), Multiple Indicator Cluster Surveys (MICS) and Demographic and<br />
Health Surveys.<br />
Gross school enrolment and reaching grade 5 – United Nations Educational, Scientific<br />
and Cultural Organization (UNESCO).<br />
Children reaching grade 5 of primary school – Percentage of the children entering the<br />
first grade of primary school who eventually reach grade 5.<br />
Notes - Data not available.<br />
x Indicates data that refer to years or periods other than those specified in the column heading, differ from the standard definition, or refer to only part of a country.<br />
y Indicates net primary school data derived from household surveys.<br />
109
Table 5: Demographic indicators<br />
Under-5<br />
mortality<br />
rank<br />
Population<br />
(thousands)<br />
1996<br />
under under<br />
18 5<br />
Population<br />
annual<br />
growth rate<br />
(%)<br />
1965-80 1980-96<br />
Crude<br />
death rate<br />
1970 1996<br />
Crude<br />
birth rate<br />
1970 1996<br />
Life<br />
expectancy<br />
1970 1996<br />
Total<br />
fertility<br />
rate<br />
1996<br />
% of<br />
population<br />
urbanized<br />
1996<br />
Average<br />
annual<br />
growth rate<br />
of urban<br />
population (%)<br />
1965-80 1980-96<br />
Afghanistan 4 9685 3734 1.9 1.6 27 21 52 52 37 45 6.9 20 5.3 3.3<br />
Albania 88 1246 363 2.4 1.5 8 6 33 22 67 71 2.7 38 2.9 2.2<br />
Algeria 92 13138 3900 3.0 2.7 16 6 49 30 53 68 4.0 57 4.0 4.3<br />
Andorra 175 15 4 6.4 4.6 - - - - - - - 94 6.2 4.4<br />
Angola 2 6049 2200 2.0 2.9 27 19 49 49 37 47 6.8 32 5.4 5.5<br />
Antigua and Barbuda 127 23 7 0.6 0.5 - 6 26 17 67 75 - 36 0.3 0.8<br />
Argentina 117 12130 3439 1.5 1.4 9 8 23 20 67 73 2.7 88 2.1 1.8<br />
Armenia 108 1213 285 2.3 1.0 6 7 24 15 72 71 1.8 69 3.4 1.3<br />
Australia 175 4601 1312 1.6 1.3 9 7 20 14 71 78 1.9 85 1.9 1.3<br />
Austria 175 1721 463 0.3 0.4 13 10 15 11 70 77 1.4 64 0.2 0.4<br />
Azerbaijan 85 2828 790 2.0 1.3 7 7 29 20 68 71 2.4 56 2.5 1.7<br />
Bahamas 123 96 24 2.7 1.9 7 5 27 18 66 73 2.0 87 2.9 2.8<br />
Bahrain 127 207 65 4.0 3.1 9 4 40 22 62 73 3.1 91 3.8 3.8<br />
Bangladesh 44 57200 13377 2.8 1.9 21 10 48 27 44 57 3.2 19 6.7 5.2<br />
Barbados 152 72 19 0.4 0.3 9 9 22 15 69 76 1.7 48 1.1 1.4<br />
Belarus 139 2655 584 0.8 0.4 9 12 17 11 71 70 1.5 72 3.4 1.9<br />
Belgium 164 2166 594 0.3 0.2 12 11 15 11 71 77 1.6 97 0.4 0.3<br />
Belize 85 106 33 2.1 2.5 8 4 40 32 66 74 3.8 47 1.7 2.2<br />
Benin 31 3050 1024 2.4 3.0 25 13 53 43 43 54 6.0 39 7.6 5.2<br />
Bhutan 36 887 306 2.0 2.1 23 14 43 41 40 52 5.9 6 4.4 5.2<br />
Bolivia 51 3556 1160 2.4 2.2 20 9 45 34 46 61 4.5 62 3.2 4.1<br />
Bosnia and Herzegovina 143 933 205 0.9 -0.5 7 7 23 11 66 73 1.4 43 3.9 0.7<br />
Botswana 80 745 237 3.3 3.1 15 12 50 36 52 52 4.6 63 12.5 12.0<br />
Brazil 79 60228 15626 2.4 1.8 10 7 35 20 59 67 2.3 79 4.3 2.9<br />
Brunei Darussalam 154 118 35 4.2 2.8 7 3 36 23 67 75 2.8 70 5.1 3.7<br />
Bulgaria 136 1903 433 0.5 -0.3 9 13 16 10 71 71 1.5 69 2.4 0.4<br />
Burkina Faso 23 5821 2054 2.3 2.8 25 18 53 46 40 46 6.7 16 5.6 6.9<br />
Burundi 17 3292 1130 1.7 2.6 20 18 44 44 44 46 6.4 8 6.2 6.3<br />
Cambodia 19 4822 1564 0.4 2.9 21 13 42 35 43 53 4.6 21 1.3 6.2<br />
Cameroon 51 6879 2322 2.6 2.8 21 12 45 40 44 56 5.4 46 6.9 5.2<br />
Canada 164 7185 2003 1.5 1.2 7 7 17 13 73 79 1.6 77 1.7 1.3<br />
Cape Verde 65 190 59 1.6 2.0 12 8 41 32 57 66 3.7 56 3.4 7.4<br />
Central African Rep. 21 1626 537 2.1 2.3 22 17 43 38 42 49 5.1 40 4.0 3.1<br />
Chad 27 3241 1127 2.0 2.3 26 18 45 42 38 47 5.6 23 6.9 3.5<br />
Chile 149 4961 1465 1.8 1.6 10 6 30 20 62 75 2.5 84 2.6 1.8<br />
China 82 378019 101412 2.1 1.3 9 7 33 17 61 69 1.8 31 2.8 4.2<br />
Colombia 104 14640 4303 2.4 2.0 9 6 37 24 61 71 2.8 73 3.6 2.8<br />
Comoros 39 336 112 3.1 3.1 19 11 50 42 47 57 5.7 31 5.5 4.9<br />
Congo 48 1392 490 2.7 2.9 20 15 46 43 46 51 6.0 59 4.3 5.2<br />
Congo, Dem. Rep. 12 25140 9084 2.9 3.4 20 14 48 46 45 53 6.4 29 3.5 3.5<br />
Cook Islands 108 8 2 -0.4 0.3 - - - - - - - 63 0.0 1.1<br />
Costa Rica 146 1424 422 2.9 2.7 7 4 35 25 67 77 3.0 50 3.7 3.6<br />
Côte d’Ivoire 25 7192 2239 4.0 3.4 20 14 52 38 44 51 5.3 44 6.7 4.8<br />
Croatia 154 1034 245 0.4 0.2 10 12 15 11 69 72 1.6 56 2.8 0.9<br />
Cuba 159 2867 776 1.5 0.8 7 7 29 14 70 76 1.6 76 2.6 1.5<br />
Cyprus 159 226 63 0.3 1.3 10 8 20 17 71 77 2.3 54 1.6 2.4<br />
Czech Rep. 164 2400 595 0.4 0.0 13 12 16 11 70 73 1.5 66 2.1 0.2<br />
Denmark 175 1108 341 0.5 0.1 10 12 16 13 73 75 1.8 85 1.0 0.3<br />
Djibouti 24 292 96 6.4 4.9 23 15 48 39 40 50 5.5 82 8.4 5.6<br />
Dominica 133 25 7 0.8 -0.3 11 6 26 23 - 73 - 69 2.8 0.3<br />
Dominican Rep. 74 3255 953 2.7 2.1 11 5 42 25 58 71 2.9 63 5.1 3.4<br />
Ecuador 88 4973 1455 2.9 2.4 12 6 42 26 58 70 3.2 60 4.5 3.9<br />
Egypt 58 27791 7800 2.2 2.3 17 7 40 27 51 65 3.5 45 2.7 2.5<br />
El Salvador 88 2565 771 2.7 1.5 12 6 44 29 57 69 3.2 45 3.2 2.1<br />
Equatorial Guinea 18 202 71 -1.5 4.0 25 17 42 42 40 49 5.6 44 -1.2 6.9<br />
Eritrea 41 1650 569 2.6 2.0 21 15 47 41 43 50 5.5 18 4.8 3.6<br />
Estonia 145 358 73 0.9 0.0 11 13 15 10 70 69 1.4 73 1.7 0.3<br />
Ethiopia 16 30615 11257 2.4 2.9 24 17 50 48 40 49 7.0 16 4.5 5.6<br />
110
Under-5<br />
mortality<br />
rank<br />
Population<br />
(thousands)<br />
1996<br />
under under<br />
18 5<br />
Population<br />
annual<br />
growth rate<br />
(%)<br />
1965-80 1980-96<br />
Crude<br />
death rate<br />
1970 1996<br />
Crude<br />
birth rate<br />
1970 1996<br />
Life<br />
expectancy<br />
1970 1996<br />
Total<br />
fertility<br />
rate<br />
1996<br />
…Table 5<br />
% of<br />
population<br />
urbanized<br />
1996<br />
Average<br />
annual<br />
growth rate<br />
of urban<br />
population (%)<br />
1965-80 1980-96<br />
Fiji 121 326 87 2.1 1.4 7 5 35 23 64 72 2.8 41 3.1 1.9<br />
Finland 189 1170 326 0.3 0.4 10 10 15 12 70 76 1.8 63 2.4 0.8<br />
France 175 13492 3563 0.7 0.5 11 9 17 12 72 79 1.7 75 1.3 0.6<br />
Gabon 28 487 167 2.2 2.9 21 15 32 37 44 55 5.3 51 5.5 5.5<br />
Gambia 49 535 189 3.1 3.6 28 18 49 41 36 46 5.3 30 5.5 6.2<br />
Georgia 113 1529 405 0.8 0.4 10 9 19 14 68 73 2.0 59 1.7 1.3<br />
Germany 175 15836 3978 0.2 0.3 12 11 14 9 71 76 1.3 87 0.6 0.6<br />
Ghana 47 9110 2987 2.1 3.1 17 11 46 39 49 57 5.4 36 3.3 4.1<br />
Greece 161 2168 517 0.8 0.5 8 10 17 10 72 78 1.4 59 2.1 0.7<br />
Grenada 104 33 10 -0.6 0.2 - - - - - - - 37 -0.2 1.0<br />
Guatemala 74 5563 1824 2.8 2.9 15 7 45 37 52 66 5.0 39 3.4 3.2<br />
Guinea 11 4027 1462 1.6 3.3 28 19 52 49 37 46 6.7 30 4.9 6.0<br />
Guinea-Bissau 6 523 181 2.8 2.0 27 21 41 41 36 44 5.5 22 3.9 3.6<br />
Guyana 56 315 92 1.1 0.6 11 8 38 23 60 64 2.4 36 1.4 1.6<br />
Haiti 34 3389 1091 1.7 1.9 19 13 39 34 47 54 4.7 32 3.7 3.9<br />
Holy See - - - - - - - - - - - - 100 - -<br />
Honduras 97 2924 939 3.1 3.1 15 6 48 35 53 69 4.5 44 5.1 4.6<br />
Hungary 152 2250 561 0.4 -0.4 11 15 15 11 69 69 1.5 65 1.8 0.4<br />
Iceland 186 78 23 1.1 1.1 7 7 22 17 74 79 2.2 92 1.6 1.3<br />
India 46 382891 111216 2.2 2.0 17 9 39 26 49 62 3.2 27 3.6 3.0<br />
Indonesia 67 77807 21884 2.3 1.8 18 8 40 24 48 64 2.7 36 4.6 4.9<br />
Iran 96 35706 11348 3.1 3.6 16 6 45 35 55 69 4.9 60 4.9 4.8<br />
Iraq 39 10116 3158 3.3 2.9 16 9 48 37 55 61 5.4 75 5.0 3.8<br />
Ireland 164 1039 241 1.1 0.3 11 9 22 13 71 76 1.9 58 2.0 0.5<br />
Israel 161 1950 568 2.8 2.4 7 6 26 21 71 77 2.8 90 3.4 2.5<br />
Italy 164 10492 2686 0.5 0.1 10 10 17 9 72 78 1.2 67 1.0 0.1<br />
Jamaica 154 924 281 1.3 1.0 8 6 35 22 67 74 2.5 54 2.7 1.9<br />
Japan 175 24730 6178 1.1 0.4 7 8 19 10 72 80 1.5 78 1.9 0.6<br />
Jordan 117 2789 960 2.7 4.0 18 5 51 38 54 69 5.3 72 4.4 5.2<br />
Kazakstan 84 5890 1519 1.5 0.7 9 8 26 19 64 68 2.4 60 2.4 1.4<br />
Kenya 55 14739 4419 3.6 3.2 18 11 53 37 50 54 5.0 30 7.7 7.0<br />
Kiribati 61 37 12 2.0 1.7 - 9 - 28 49 58 - 36 5.0 2.6<br />
Korea, Dem. People’s Rep. 108 6986 2311 2.5 1.5 10 6 40 21 60 72 2.1 62 4.1 2.0<br />
Korea, Rep. of 164 12646 3387 1.9 1.1 10 6 30 15 60 72 1.7 82 5.7 3.4<br />
Kuwait 147 756 187 7.1 1.3 6 2 47 22 66 76 2.9 100 8.1 2.0<br />
Kyrgyzstan 80 1904 564 2.3 1.3 11 7 31 26 62 68 3.3 39 2.7 1.4<br />
Lao People’s Dem. Rep. 35 2574 917 1.8 2.8 23 14 44 45 40 53 6.7 21 5.0 5.7<br />
Latvia 133 609 133 0.7 -0.1 11 14 14 10 70 68 1.5 73 1.6 0.4<br />
Lebanon 88 1223 376 1.4 0.9 11 7 35 25 64 69 2.9 87 4.1 2.0<br />
Lesotho 32 1010 326 2.3 2.6 20 11 43 36 48 58 5.0 25 7.3 6.5<br />
Liberia 5 1107 331 3.0 1.1 21 19 49 48 46 48 6.5 48 6.1 3.1<br />
Libya 70 2896 987 4.2 3.8 16 7 49 41 52 65 6.1 86 10.4 5.2<br />
Liechtenstein 164 7 2 2.2 1.3 - - - - - - - 19 1.5 1.1<br />
Lithuania 139 957 229 0.9 0.5 9 12 17 11 71 70 1.6 72 3.0 1.6<br />
Luxembourg 164 88 26 0.6 0.8 12 10 13 13 70 76 1.7 90 2.1 1.6<br />
Madagascar 21 8185 2761 2.6 3.3 19 10 47 42 45 58 5.8 27 5.3 5.8<br />
Malawi 8 5266 1868 2.9 2.9 25 22 56 49 40 41 6.8 14 7.1 5.6<br />
Malaysia 149 8916 2668 2.5 2.5 10 5 37 26 61 72 3.4 54 4.7 4.1<br />
Maldives 61 140 47 2.5 3.2 17 8 40 42 50 64 6.8 27 6.6 4.5<br />
Mali 7 5995 2183 2.2 3.0 26 18 51 48 38 47 6.8 28 4.8 5.5<br />
Malta 154 98 26 0.4 0.8 9 8 17 14 70 77 2.1 89 1.2 1.3<br />
Marshall Islands 54 26 8 3.4 3.0 - - - - - - - 70 2.4 4.3<br />
Mauritania 15 1157 380 2.3 2.6 22 13 45 39 43 53 5.1 53 9.7 6.7<br />
Mauritius 123 377 111 1.7 1.0 7 7 29 20 62 71 2.3 41 2.6 0.7<br />
Mexico 102 38611 11234 3.0 2.0 10 5 44 25 61 72 2.9 74 4.2 2.6<br />
Micronesia, Fed. States of 116 58 19 3.1 2.6 - 7 - 33 58 - - 29 3.7 3.4<br />
Moldova, Rep. of 102 1382 327 1.2 0.6 10 11 19 14 65 68 1.9 52 3.7 2.3<br />
Monaco 175 7 2 1.4 1.1 - - - - - - - 100 1.4 1.1<br />
111
Table 5: Demographic indicators<br />
Under-5<br />
mortality<br />
rank<br />
Population<br />
(thousands)<br />
1996<br />
under under<br />
18 5<br />
Population<br />
annual<br />
growth rate<br />
(%)<br />
1965-80 1980-96<br />
Crude<br />
death rate<br />
1970 1996<br />
Crude<br />
birth rate<br />
1970 1996<br />
Life<br />
expectancy<br />
1970 1996<br />
Mongolia 67 1135 314 2.8 2.6 14 7 42 28 53 65 3.4 61 4.2 3.6<br />
Morocco 64 11526 3375 2.5 2.1 17 7 47 26 52 66 3.3 53 4.2 3.6<br />
Mozambique 9 9114 3193 2.5 2.4 22 18 46 43 42 47 6.2 35 9.5 8.6<br />
Myanmar 25 19055 5675 2.2 1.9 17 10 40 28 49 59 3.4 26 3.1 2.5<br />
Namibia 60 767 252 2.6 2.7 18 12 43 36 48 56 5.0 37 4.6 5.7<br />
Nauru 104 5 2 2.2 2.8 - - - - - - - 100 2.2 2.8<br />
Nepal 42 10887 3593 2.3 2.6 22 12 45 37 42 56 5.1 11 6.5 5.7<br />
Netherlands 175 3394 976 0.9 0.6 8 9 17 12 74 78 1.6 89 1.2 0.6<br />
New Zealand 164 988 292 1.1 0.9 9 8 22 16 72 77 2.1 86 1.5 1.1<br />
Nicaragua 73 2130 659 3.1 2.6 14 6 48 34 54 68 4.0 63 4.6 3.6<br />
Niger 1 5197 1931 2.8 3.3 26 18 58 51 38 48 7.2 19 6.9 5.8<br />
Nigeria 14 59722 21052 2.6 2.9 21 14 46 43 43 52 6.1 41 5.7 5.5<br />
Niue - 1 0 - - - - - - - - - 50 - -<br />
Norway 175 1000 298 0.6 0.4 10 11 17 14 74 77 1.9 73 2.0 0.6<br />
Oman 139 1233 444 3.9 4.4 21 4 50 44 47 70 7.2 78 14.6 10.1<br />
Pakistan 33 68346 22773 2.7 3.1 19 8 48 37 49 63 5.2 35 3.8 4.5<br />
Palau 97 8 3 2.7 2.2 - - - - - - - 71 3.1 2.5<br />
Panama 133 1040 305 2.7 2.0 8 5 37 23 65 74 2.7 56 3.5 2.6<br />
Papua New Guinea 44 2014 637 2.4 2.2 18 10 42 33 46 57 4.8 16 8.6 3.6<br />
Paraguay 100 2361 743 2.7 2.9 9 6 37 32 66 69 4.3 53 3.6 4.4<br />
Peru 72 10074 2901 2.8 2.0 14 7 42 26 54 68 3.1 71 4.2 2.6<br />
Philippines 93 30923 9602 2.7 2.3 10 6 39 29 57 68 3.7 55 3.9 4.7<br />
Poland 147 10589 2422 0.8 0.5 8 11 17 12 70 71 1.7 64 1.8 1.1<br />
Portugal 164 2146 557 0.4 0.0 11 11 20 11 67 75 1.5 36 1.8 1.3<br />
Qatar 132 175 50 7.9 5.6 13 4 34 19 61 71 3.9 92 8.6 6.0<br />
Romania 117 5646 1195 1.0 0.1 9 11 20 11 69 70 1.4 56 2.8 1.0<br />
Russian Federation 117 37115 7389 0.6 0.4 9 14 15 10 69 65 1.4 76 1.8 1.0<br />
Rwanda 19 2880 950 3.2 0.3 21 27 53 43 44 36 6.2 6 6.8 1.9<br />
Saint Kitts and Nevis 93 15 4 -0.7 -0.4 11 12 - 20 - 69 - 34 0.4 -0.8<br />
Saint Lucia 127 51 15 1.3 1.4 - 6 41 28 62 71 - 38 1.0 1.4<br />
Saint Vincent/Grenadines 123 40 12 1.0 0.9 - 7 - 22 63 72 - 50 5.4 4.6<br />
Samoa 77 75 20 1.2 0.4 12 6 44 27 57 69 3.9 22 1.9 0.5<br />
San Marino 149 5 1 1.4 1.1 - - - - - - - 96 4.2 2.2<br />
Sao Tome and Principe 57 71 25 2.2 2.3 - 7 - 35 - 69 - 44 5.3 4.4<br />
Saudi Arabia 108 9033 2977 4.6 4.2 18 4 48 35 52 71 6.0 84 8.2 5.7<br />
Senegal 36 4359 1470 2.8 2.7 25 15 49 42 39 51 5.8 44 3.4 4.0<br />
Seychelles 136 39 13 2.0 1.0 - 7 - 22 - 72 - 55 4.9 3.1<br />
Sierra Leone 3 2163 765 1.9 1.8 30 27 49 47 34 37 6.2 34 5.5 4.0<br />
Singapore 189 888 294 1.7 2.1 5 5 23 16 69 77 1.8 100 1.7 2.1<br />
Slovakia 154 1468 348 0.9 0.4 10 11 19 12 70 71 1.6 59 3.1 1.3<br />
Slovenia 175 426 92 0.8 0.3 10 11 17 10 70 73 1.3 52 3.4 0.7<br />
Solomon Islands 113 199 65 3.4 3.4 10 4 46 37 60 71 5.1 18 4.6 6.6<br />
Somalia 10 5308 1941 3.1 2.4 24 17 50 50 40 48 7.0 26 3.9 3.4<br />
South Africa 69 18378 5761 2.6 2.3 14 8 39 30 53 65 3.9 50 2.7 2.5<br />
Spain 186 8172 1935 1.1 0.3 9 9 20 10 72 78 1.2 77 2.2 0.7<br />
Sri Lanka 136 6382 1588 1.9 1.3 8 6 30 18 65 73 2.1 22 2.4 1.5<br />
Sudan 42 13026 3999 2.8 2.4 21 12 47 34 43 54 4.7 32 5.6 5.4<br />
Suriname 104 173 50 0.4 1.2 8 6 37 23 63 71 2.5 50 0.1 1.9<br />
Swaziland 53 439 144 2.8 2.8 19 10 48 37 46 59 4.6 32 9.5 6.5<br />
Sweden 189 1963 584 0.5 0.4 10 11 14 12 74 78 1.9 83 1.0 0.4<br />
Switzerland 186 1500 423 0.5 0.8 9 9 16 11 73 78 1.5 61 1.0 1.3<br />
Syria 100 7485 2103 3.3 3.2 14 5 47 31 56 68 4.2 53 4.3 4.0<br />
Tajikistan 61 2842 835 3.0 2.5 10 7 40 31 63 67 4.0 32 2.9 2.2<br />
Tanzania 29 16154 5479 3.0 3.2 19 14 50 42 45 51 5.6 25 9.9 6.5<br />
TFYR Macedonia 108 636 164 1.3 1.2 8 7 25 15 66 72 2.0 60 3.2 1.9<br />
Thailand 93 19529 4830 2.8 1.4 10 6 38 17 58 69 1.8 20 4.7 2.5<br />
Togo 38 2197 766 3.2 3.0 20 15 46 43 44 50 6.2 31 7.9 4.9<br />
Tonga 123 41 12 1.5 0.4 - 6 - 28 - 69 - 42 2.6 3.9<br />
Total<br />
fertility<br />
rate<br />
1996<br />
% of<br />
population<br />
urbanized<br />
1996<br />
Average<br />
annual<br />
growth rate<br />
of urban<br />
population (%)<br />
1965-80 1980-96<br />
112
Under-5<br />
mortality<br />
rank<br />
Population<br />
(thousands)<br />
1996<br />
under under<br />
18 5<br />
Population<br />
annual<br />
growth rate<br />
(%)<br />
1965-80 1980-96<br />
Crude<br />
death rate<br />
1970 1996<br />
Crude<br />
birth rate<br />
1970 1996<br />
Life<br />
expectancy<br />
1970 1996<br />
…Table 5<br />
Trinidad and Tobago 143 467 108 1.3 1.1 7 6 28 17 66 73 2.2 72 1.2 2.0<br />
Tunisia 97 3742 1044 2.2 2.2 14 6 39 24 54 69 3.0 63 4.0 3.4<br />
Turkey 82 22986 6388 2.4 2.1 13 7 37 22 56 68 2.6 71 4.0 5.0<br />
Turkmenistan 58 1887 570 2.8 2.3 11 8 38 30 60 65 3.7 45 2.8 2.1<br />
Tuvalu 74 4 1 1.9 1.4 - - - - - - - 40 4.6 4.3<br />
Uganda 30 11239 4066 3.3 2.7 19 21 50 51 46 41 7.1 13 5.3 5.1<br />
Ukraine 121 12377 2771 0.7 0.2 9 14 15 10 71 69 1.5 71 2.0 1.0<br />
United Arab Emirates 139 781 213 13.0 5.0 11 3 36 19 61 75 3.6 84 15.6 6.0<br />
United Kingdom 164 13333 3681 0.2 0.2 12 11 16 12 72 77 1.7 89 0.4 0.2<br />
United States 163 70382 20014 1.0 1.0 9 9 17 14 71 76 2.0 76 1.1 1.2<br />
Uruguay 127 941 263 0.5 0.6 10 10 21 17 69 73 2.3 90 0.9 1.0<br />
Uzbekistan 71 10614 3162 3.0 2.3 10 7 36 29 63 68 3.6 41 3.9 2.4<br />
Vanuatu 77 86 27 3.0 2.5 14 6 46 34 53 67 4.5 19 6.4 2.8<br />
Venezuela 115 9411 2770 3.4 2.4 7 5 38 26 65 72 3.1 86 4.5 3.0<br />
Viet Nam 85 32318 9558 2.2 2.1 15 7 38 26 49 67 3.1 19 3.3 2.2<br />
Yemen 50 8498 3084 2.3 4.0 23 11 53 48 41 57 7.6 34 6.3 7.4<br />
Yugoslavia, Fed. Rep. 127 2678 655 0.8 0.5 9 10 19 13 68 72 1.8 57 3.0 1.8<br />
Zambia 13 4562 1483 3.1 2.3 19 18 49 43 46 43 5.6 43 6.6 2.8<br />
Zimbabwe 65 5822 1951 3.1 3.0 16 14 50 38 50 49 4.8 33 6.0 5.3<br />
Total<br />
fertility<br />
rate<br />
1996<br />
% of<br />
population<br />
urbanized<br />
1996<br />
Average<br />
annual<br />
growth rate<br />
of urban<br />
population (%)<br />
1965-80 1980-96<br />
Regional summaries<br />
Sub-Saharan Africa 298349 103119 2.7 2.9 21 15 48 43 44 51 5.9 32 5.2 5.0<br />
Middle East and North Africa 150639 46229 2.9 3.0 17 7 45 32 52 65 4.5 56 4.8 4.3<br />
South Asia 536418 156634 2.3 2.1 18 9 41 28 48 61 3.5 27 3.8 3.4<br />
East Asia and Pacific 598624 165346 2.2 1.5 11 7 35 19 58 68 2.1 33 3.4 4.1<br />
Latin America and Caribbean 189383 53761 2.5 1.9 10 6 37 23 60 69 2.8 74 3.8 2.7<br />
CEE/CIS and Baltic States 137929 33210 1.1 0.7 9 11 20 14 66 68 1.9 67 2.3 1.7<br />
Industrialized countries 191260 51706 0.8 0.6 10 9 17 12 72 77 1.7 78 1.2 0.8<br />
Developing countries 1827055 540175 2.3 2.0 14 9 38 26 53 62 3.2 38 3.9 3.8<br />
Least developed countries 298758 97112 2.5 2.5 22 14 48 40 43 51 5.3 23 5.4 5.0<br />
World 2102602 610005 2.0 1.7 13 9 32 23 56 63 2.9 46 2.8 2.8<br />
Countries in each region are listed on page 122.<br />
Definitions of the indicators<br />
Life expectancy at birth – The number of years newborn children would live if subject to the<br />
mortality risks prevailing for the cross-section of population at the time of their birth.<br />
Crude death rate – Annual number of deaths per 1,000 population.<br />
Crude birth rate – Annual number of births per 1,000 population.<br />
Total fertility rate – The number of children that would be born per woman if she were to<br />
live to the end of her childbearing years and bear children at each age in accordance with<br />
prevailing age-specific fertility rates.<br />
Main data sources<br />
Life expectancy – United Nations Population Division.<br />
Child population – United Nations Population Division.<br />
Crude death and birth rates – United Nations Population Division.<br />
Fertility – United Nations Population Division.<br />
Urban population – United Nations Population Division.<br />
Urban population – Percentage of population living in urban areas as defined according to<br />
the national definition used in the most recent population census.<br />
Notes - Data not available.<br />
x Indicates data that refer to years or periods other than those specified in the column heading, differ from the standard definition, or refer to only part of a country.<br />
113
Table 6: Economic indicators<br />
Under-5<br />
mortality<br />
rank<br />
GNP per<br />
capita<br />
(US$)<br />
1995<br />
GNP per capita<br />
average annual<br />
growth rate (%)<br />
1965-80 1985-95<br />
Annual<br />
rate of<br />
inflation<br />
(%)<br />
1985-95<br />
% of<br />
population<br />
below $1<br />
a day<br />
1990-96<br />
% of central government<br />
expenditure allocated to<br />
(1990-96)<br />
health education defence<br />
ODA inflow<br />
in millions<br />
US$<br />
1995<br />
ODA inflow<br />
as a % of<br />
recipient<br />
GNP<br />
1995<br />
Debt service<br />
as a % of<br />
exports of<br />
goods and services<br />
1970 1995<br />
Afghanistan 4 250x 0.6 - - - - - - 214 5 - -<br />
Albania 88 670 - -6.0x 27 - 6 2 7 179 8 - 1<br />
Algeria 92 1600 4.2 -2.4 23 2x - - - 310 1 3 37<br />
Andorra 175 c - - - - - - - - - - -<br />
Angola 2 410 - -6.1 170 - 6x 15x 34x 423 10 - 15<br />
Antigua and Barbuda 127 6980x - 2.7 4 - - - - 2 0 - 2<br />
Argentina 117 8030 1.7 1.8 256 - 2 5 7 222 0 22 26<br />
Armenia 108 730 - -15.1 183 - - - - 213 8 - 1<br />
Australia 175 18720 2.2 1.4 4 - 13 8 7 - - - -<br />
Austria 175 26890 4.0 1.9 3 - 14 10 2 - - - -<br />
Azerbaijan 85 480 - -16.3 279 - - - - 109 3 - 1<br />
Bahamas 123 11940 - -0.8 3 - 15 19 3 4 0 - -<br />
Bahrain 127 7840 - 0.2 0 - 9 13 17 49 1 - 2<br />
Bangladesh 44 240 -0.3 2.1 6 - 5x 11x 10x 1269 4 0 15<br />
Barbados 152 6560 - 0.8 3 - - - - -1 -0 - 10<br />
Belarus 139 2070 - -5.2 309 - 2 18 4 - - - 2<br />
Belgium 164 24710 3.6 2.2 3 - 2x 12x 5x - - - -<br />
Belize 85 2630 - 3.9 4 - 13 20 5 16 4 - -<br />
Benin 31 370 -0.3 -0.3 3 - 6x 31x 17x 276 14 2 13<br />
Bhutan 36 420 - 4.9 8 - 8 10 - 73 25 - 10<br />
Bolivia 51 800 1.7 1.8 18 7 6 19 8 692 12 11 26<br />
Bosnia and Herzegovina 143 a - - - - - - - - - - -<br />
Botswana 80 3020 9.9 6.1 12 35x 5 21 12 92 2 1 4<br />
Brazil 79 3640 6.3 -0.8 875 29x 5 3 3 366 0 12 29<br />
Brunei Darussalam 154 25160 - - 0 - - - - 4 0 - -<br />
Bulgaria 136 1330 - -2.6 46 3 3 4 6 - - - 11<br />
Burkina Faso 23 230 1.7 -0.2 3 - 7 17 14 483 20 4 17<br />
Burundi 17 160 2.4 -1.3 6 - 4x 16x 16x 288 29 4 22<br />
Cambodia 19 270 - 2.0 71 - - - - 567 21 - 2<br />
Cameroon 51 650 2.4 -6.6 2 - 5 18 9 444 5 3 17<br />
Canada 164 19380 3.3 0.4 3 - 5 3 6 - - - -<br />
Cape Verde 65 960 - 2.1 7 - - - - 111 30 - -<br />
Central African Rep. 21 340 0.8 -2.4 4 - - - - 161 14 5 3<br />
Chad 27 180 -1.9 0.6 3 - 8x 8x - 237 21 4 7x<br />
Chile 149 4160 0.0 6.1 18 15 12 15 9 159 0 19 15<br />
China 82 620 4.1 8.3 9 29 0 2 12 3521 0 0x 10<br />
Colombia 104 1910 3.7 2.6 25 7 5 19 9 231 0 12 27<br />
Comoros 39 470 - -1.4 4 - - - - 43 18 - 2<br />
Congo 48 680 2.7 -3.2 2 - - - - 125 7 11 11<br />
Congo, Dem. Rep. 12 120 -1.3 -8.5 - - 1 1 4 189 4 5 6x<br />
Cook Islands 108 1550x - - - - - - - 13 16 - -<br />
Costa Rica 146 2610 3.3 2.8 18 19x 21 17 - 25 0 10 15<br />
Côte d’Ivoire 25 660 2.8 -4.3 4 18x 4x 21x 4x 1200 13 7 18<br />
Croatia 154 3250 - - - - 15 7 21 - - - 2<br />
Cuba 159 1170x - - - - 23x 10x - 64 0x - -<br />
Cyprus 159 10260x - 4.6 4 - 6 11 3 22 0 - -<br />
Czech Rep. 164 3870 - -1.8 12 3 17 12 6 - - - 8<br />
Denmark 175 29890 2.2 1.5 3 - 1 9 4 - - - -<br />
Djibouti 24 780x - - - - - - - 103 - - 7<br />
Dominica 133 2990 - 4.1 4 - - - - 24 11 - 6<br />
Dominican Rep. 74 1460 3.8 2.1 26 20x 10 12 5 124 1 4 16<br />
Ecuador 88 1390 5.4 0.8 46 30 11 18 13 235 1 9 21<br />
Egypt 58 790 2.8 1.1 16 8 2 12 9 2017 4 26 21<br />
El Salvador 88 1610 1.5 2.8 15 - 8 13 8 304 3 4 13<br />
Equatorial Guinea 18 380 - 2.3 4 - - - - 33 22 - 1<br />
Eritrea 41 100x - - - - - - - 145 46x - -<br />
Estonia 145 2860 - -4.3 77 6 17 9 3 - - - 0<br />
Ethiopia 16 100 0.4 -0.3 6 34x 5 14 20 876 15 11 20<br />
114
…Table 6<br />
Under-5<br />
mortality<br />
rank<br />
GNP per<br />
capita<br />
(US$)<br />
1995<br />
GNP per capita<br />
average annual<br />
growth rate (%)<br />
1965-80 1985-95<br />
Annual<br />
rate of<br />
inflation<br />
(%)<br />
1985-95<br />
% of<br />
population<br />
below $1<br />
a day<br />
1990-96<br />
% of central government<br />
expenditure allocated to<br />
(1990-96)<br />
health education defence<br />
ODA inflow<br />
in millions<br />
US$<br />
1995<br />
ODA inflow<br />
as a % of<br />
recipient<br />
GNP<br />
1995<br />
Debt service<br />
as a % of<br />
exports of<br />
goods and services<br />
1970 1995<br />
Fiji 121 2440 - 2.0 5 - 9 18 6 43 2 - 4<br />
Finland 189 20580 3.6 -0.2 4 - 3 11 4 - - - -<br />
France 175 24990 3.7 1.5 3 - 16 7 6 - - - -<br />
Gabon 28 3490 5.6 -8.2 5 - - - - 143 4 6 13<br />
Gambia 49 320 - 0.3 9 - 7 12 4 46 13 1 11<br />
Georgia 113 440 - -17.0 310 - - - - 209 9 - 4<br />
Germany 175 27510 3.0x 1.9x 3 - 17 1 7 - - - -<br />
Ghana 47 390 -0.8 1.4 29 - 7 22 5 644 10 5 15<br />
Greece 161 8210 4.8 1.3 15 - 7 9 9 - - 9 17<br />
Grenada 104 2980 - - 5 - 10 17 - 10 4 - 13<br />
Guatemala 74 1340 3.0 0.3 19 53x 11 19 15 213 1 7 11<br />
Guinea 11 550 1.3 1.4 17 26 3x 11x 29x 392 11 - 13<br />
Guinea-Bissau 6 250 -2.7 2.0 63 87 1x 3x 4x 119 45 - 30<br />
Guyana 56 590 - 0.6 51 - - - - 88 18 - 19<br />
Haiti 34 250 0.9 -5.2 15 - - - - 733 41 5 14<br />
Holy See - - - - - - - - - - - - -<br />
Honduras 97 600 1.1 0.1 14 47 10x 19x 7x 411 12 3 32<br />
Hungary 152 4120 5.1 -1.0 20 1 8 3 4 - - - 31<br />
Iceland 186 24950 - 1.0 12 - 23 12 - - - - -<br />
India 46 340 1.5 3.2 10 53 2 2 14 1738 1 21 23<br />
Indonesia 67 980 5.2 6.0 9 15 3 10 7 1389 1 7 23<br />
Iran 96 1033x 2.9 -1.5 24 - 9 16 6 183 0 - 19x<br />
Iraq 39 1036x - - - - - - - 326 2x - -<br />
Ireland 164 14710 2.8 5.2 3 - 14 13 3 - - - -<br />
Israel 161 15920 3.7 2.5 17 - 9 13 18 336 0 3 -<br />
Italy 164 19020 3.2 1.8 6 - 11x 8x 4x - - - -<br />
Jamaica 154 1510 -0.1 3.6 28 5 7x 11x 8x 108 3 3 17<br />
Japan 175 39640 5.1 2.9 1 - 2 6 4 - - - -<br />
Jordan 117 1510 5.8x -4.5 7 3 8 16 21 536 8 4 21<br />
Kazakstan 84 1330 - -8.6 307 - - - - 58 0 - 3<br />
Kenya 55 280 3.1 0.1 13 50 5 19 6 707 9 6 23<br />
Kiribati 61 920 - -0.6 4 - - - - 15 21 - -<br />
Korea, Dem. People’s Rep. 108 970x - - - - - - - 14 0x - -<br />
Korea, Rep. of 164 9700 7.3 7.7 7 - 1 21 17 58 0 20 3<br />
Kuwait 147 17390 0.6x 1.1 -1 - 6 11 25 6 0 - -<br />
Kyrgyzstan 80 700 - -6.9 172 19 - - - 283 9 - 7<br />
Lao People’s Dem. Rep. 35 350 - 2.7 23 - - - - 311 18 - 8x<br />
Latvia 133 2270 - -6.6 73 - 6 15 3 - - - 1<br />
Lebanon 88 2660 - 2.7 46 - - - - 188 2 - 16<br />
Lesotho 32 770 6.8 1.2 13 50x 13 21 6 114 8 1 17<br />
Liberia 5 490x 0.5 - - - 5x 11x 9x 121 11 8 -<br />
Libya 70 5540x 0.0 - - - - - - 7 0 - -<br />
Liechtenstein 164 c - - - - - - - - - - -<br />
Lithuania 139 1900 - -11.7 151 2 7 7 2 - - - 0<br />
Luxembourg 164 41210 - 0.9 5 - 2 9 1 - - - -<br />
Madagascar 21 230 -0.4 -2.2 18 72 6 11 5 301 9 32 7<br />
Malawi 8 170 3.2 -0.7 22 - 7x 12x 5x 429 26 8 22<br />
Malaysia 149 3890 4.7 5.7 3 6x 6 22 13 114 0 4 3<br />
Maldives 61 990 - 5.9 9 - 8 16 - 55 22 - -<br />
Mali 7 250 2.1x 0.8 5 - 2x 9x 8x 542 22 1 7<br />
Malta 154 7910x - 5.1 3 - 11 12 2 9 0 - -<br />
Marshall Islands 54 1680x - - 5 - - - - 39 41 - -<br />
Mauritania 15 460 -0.1 0.5 7 31x 4x 23x - 220 21 3 19<br />
Mauritius 123 3380 3.7 5.4 9 - 9 17 2 23 1 3 5<br />
Mexico 102 3320 3.6 0.1 37 15 3 27 4 379 0 24 19<br />
Micronesia, Fed. States of 116 2010 - - 5 - - - - 77 36 - -<br />
Moldova, Rep. of 102 920 - -8.2 - 7 - - - - - - 5<br />
Monaco 175 c - - - - - - - - - - -<br />
115
Table 6: Economic indicators<br />
Under-5<br />
mortality<br />
rank<br />
GNP per<br />
capita<br />
(US$)<br />
1995<br />
GNP per capita<br />
average annual<br />
growth rate (%)<br />
1965-80 1985-95<br />
Annual<br />
rate of<br />
inflation<br />
(%)<br />
1985-95<br />
% of<br />
population<br />
below $1<br />
a day<br />
1990-96<br />
% of central government<br />
expenditure allocated to<br />
(1990-96)<br />
health education defence<br />
ODA inflow<br />
in millions<br />
US$<br />
1995<br />
ODA inflow<br />
as a % of<br />
recipient<br />
GNP<br />
1995<br />
Debt service<br />
as a % of<br />
exports of<br />
goods and services<br />
1970 1995<br />
Mongolia 67 310 - -3.8 52 - 4 7 12 208 27 - 9x<br />
Morocco 64 1110 2.7 0.9 5 1 3 18 14 494 2 8 39<br />
Mozambique 9 80 - 3.6 52 - 5x 10x 35x 1102 81 - 58<br />
Myanmar 25 220x 1.6 0.4 26 - 4 12 37 152 2x 18 15x<br />
Namibia 60 2000 - 2.9 10 - 10 22 7 188 6 - -<br />
Nauru 104 - - - - - - - - - - - -<br />
Nepal 42 200 - 2.4 12 53 5 14 4 430 10 3 8<br />
Netherlands 175 24000 2.7 1.9 2 - 15 11 4 - - - -<br />
New Zealand 164 14340 1.7 0.8 4 - 16 15 4 - - - -<br />
Nicaragua 73 380 -0.7 -5.4 962 44 13 15 6 662 40 11 57<br />
Niger 1 220 -2.5 -2.1 1 62 - - - 268 14 4 9x<br />
Nigeria 14 260 4.2 1.2 33 29 1x 3x 3x 208 1 4 22<br />
Niue - - - - - - - - - 8 - - -<br />
Norway 175 31250 3.6 1.7 3 - 4 7 7 - - - -<br />
Oman 139 4820 9.0 0.3 -0 - 6 13 35 59 1 - 8<br />
Pakistan 33 460 1.8 1.2 9 12 1 2 31 805 1 22 29<br />
Palau 97 790x - - - - - - - 142 - - -<br />
Panama 133 2750 2.8 -0.4 2 26x 18 17 5 50 1 8 8<br />
Papua New Guinea 44 1160 - 2.3 5 - 8 15 4 372 7 1 10<br />
Paraguay 100 1690 4.1 1.2 25 - 7 22 11 146 2 12 8<br />
Peru 72 2310 0.8 -1.6 399 49 5 16 11 428 1 12 13<br />
Philippines 93 1050 3.2 1.5 10 28x 3 16 11 884 1 8 16<br />
Poland 147 2790 - 1.2 92 7 - - - - - - 6<br />
Portugal 164 9740 4.6 3.6 11 - 9x 11x 6x - - 7 16<br />
Qatar 132 11600 - -4.2 - - - - - 3 0 - -<br />
Romania 117 1480 - -3.8 69 18 8 10 7 - - 0x 4<br />
Russian Federation 117 2240 - -5.1 149 1 2 2 12 - - - 8<br />
Rwanda 19 180 1.6 -5.4 11 46x 5x 26x - 711 63 1 28<br />
Saint Kitts and Nevis 93 5170 - 4.8 6 - - - - 4 2 - -<br />
Saint Lucia 127 3370 - 3.9 3 - - - - 47 9 - -<br />
Saint Vincent/Grenadines 123 2280 - 3.8 4 - 13 17 - 47 19 - -<br />
Samoa 77 1120 - 0.2 11 - - - - 43 23 - -<br />
San Marino 149 - - - - - - - - - - - -<br />
Sao Tome and Principe 57 350 - -2.1 40 - - - - 78 174 - 17<br />
Saudi Arabia 108 7040 4.0x -1.9 3 - 6x 14x 36x 21 0 - 1<br />
Senegal 36 600 -0.5 -1.2 4 54 - - - 663 13 4 12<br />
Seychelles 136 6620 - 4.2 3 - 8 12 4 13 3 - 7<br />
Sierra Leone 3 180 0.7 -3.6 62 - 10 13 10 205 27 11 27<br />
Singapore 189 26730 8.3 6.2 4 - 7 23 29 16 0 1 -<br />
Slovakia 154 2950 - -2.8 11 13 - - - - - - 6<br />
Slovenia 175 8200 - - - - - - - - - - 3<br />
Solomon Islands 113 910 - 3.2 12 - - - - 47 14 - -<br />
Somalia 10 110x -0.1 -2.3x 75 - 1x 2x 38x 191 20 2 7x<br />
South Africa 69 3160 3.2 -1.1 14 24 - - - 384 0 - 5<br />
Spain 186 13580 4.1 2.6 6 - 6 4 3 - - - -<br />
Sri Lanka 136 700 2.8 2.6 12 4 6 10 15 553 4 11 11<br />
Sudan 42 310x 0.8 0.6 63 - - - - 225 3 11 0x<br />
Suriname 104 880 - 3.5 49 - - - - 77 21 - -<br />
Swaziland 53 1170 - -1.4 12 - - - - 54 5 - 2<br />
Sweden 189 23750 2.0 -0.1 6 - 0 5 6 - - - -<br />
Switzerland 186 40630 1.5 0.2 3 - 20x 3x 6x - - - -<br />
Syria 100 1120 5.1 0.9 16 - 3 9 28 347 2 11 3x<br />
Tajikistan 61 340 - -13.0 147 - - - - 65 3 - -<br />
Tanzania 29 120 0.8 1.0 32 16 6x 8x 16x 875 24 1 16<br />
TFYR Macedonia 108 860 - - - - - - - - - - 7<br />
Thailand 93 2740 4.4 8.4 5 0 8 22 14 863 1 3 3<br />
Togo 38 310 1.7 -2.7 3 - 5x 20x 11x 188 15 3 5<br />
Tonga 123 1630 - 0.5 8 - 7 13 - 38 22 - -<br />
116
…Table 6<br />
Under-5<br />
mortality<br />
rank<br />
GNP per<br />
capita<br />
(US$)<br />
1995<br />
GNP per capita<br />
average annual<br />
growth rate (%)<br />
1965-80 1985-95<br />
Annual<br />
rate of<br />
inflation<br />
(%)<br />
1985-95<br />
% of<br />
population<br />
below $1<br />
a day<br />
1990-96<br />
% of central government<br />
expenditure allocated to<br />
(1990-96)<br />
health education defence<br />
ODA inflow<br />
in millions<br />
US$<br />
1995<br />
ODA inflow<br />
as a % of<br />
recipient<br />
GNP<br />
1995<br />
Debt service<br />
as a % of<br />
exports of<br />
goods and services<br />
1970 1995<br />
Trinidad and Tobago 143 3770 3.1 -1.7 7 - - - - 26 1 5 16<br />
Tunisia 97 1820 4.7 1.9 6 4 6 17 6 69 0 18 17<br />
Turkey 82 2780 3.6 2.2 65 - 3 12 10 303 0 16 27<br />
Turkmenistan 58 920 - -9.6 381 5 - - - 26 1 - 4x<br />
Tuvalu 74 650x - - - - - - - 8 - - -<br />
Uganda 30 240 -2.2 2.7 66 50 2x 15x 26x 805 17 3 18<br />
Ukraine 121 1630 - -9.2 363 - - - - - - - 2x<br />
United Arab Emirates 139 17400 - -2.8 - - 7 17 37 8 0 - -<br />
United Kingdom 164 18700 2.0 1.4 5 - 14 5 8 - - - -<br />
United States 163 26980 1.8 1.3 3 - 19 2 17 - - - -<br />
Uruguay 127 5170 2.5 3.1 71 - 6 7 7 81 0 22 22<br />
Uzbekistan 71 970 - -3.9 239 - - - - 81 0 - 3<br />
Vanuatu 77 1200 - -1.1 6 - - - - 46 23 - -<br />
Venezuela 115 3020 2.3 0.5 38 12 10x 20x 6x 49 0 3 17<br />
Viet Nam 85 240 - 4.2 88 - - - - 826 5 - 4<br />
Yemen 50 260 - - - - 5 21 30 173 4 - 5<br />
Yugoslavia, Fed. Rep. 127 b - - - - - - - - - - -<br />
Zambia 13 400 -1.2 -0.8 92 85 14 15 - 2029 56 6 24<br />
Zimbabwe 65 540 1.7 -0.6 21 41 8x 24x 17x 490 8 2 20x<br />
Regional summaries<br />
Sub-Saharan Africa 501 2.8 -0.9 20 36 5 14 10 17379 6 6 11<br />
Middle East and North Africa 1710 3.1 -0.9 14 - 6 15 21 5146 1 12 13<br />
South Asia 345 1.4 2.8 10 47 2 3 16 5137 1 17 22<br />
East Asia and Pacific 1043 4.9 7.4 9 26 2 12 14 9818 0 6 7<br />
Latin America and Caribbean 3271 4.0 0.5 406 24 5 11 5 6026 0 13 21<br />
CEE/CIS and Baltic States 2086 - -3.3 139 4 4 7 10 - - - 9<br />
Industrialized countries 25926 2.9 1.8 3 - 12 4 9 - - - -<br />
Developing countries 1101 3.7 2.9 141 32 4 11 12 45181 1 11 13<br />
Least developed countries 220 -0.1 0.0 30 - 5 13 15 16465 14 6 14<br />
World 4812 3.1 1.9 32 30 11 6 10 45377 1 11 12<br />
Countries in each region are listed on page 122.<br />
Definitions of the indicators<br />
GNP per capita – Gross national product (GNP) is the sum of gross value added by all resident<br />
producers, plus any taxes that are not included in the valuation of output, plus net receipts<br />
of primary income from non-resident sources. GNP per capita is the gross national product,<br />
converted to United States dollars using the World Bank Atlas method, divided by the midyear<br />
population.<br />
% of population below $1 a day – Percentage of population living on less than $1 a day at<br />
1985 international prices, adjusted for purchasing power parity.<br />
ODA – Official development assistance.<br />
Main data sources<br />
GNP per capita – World Bank.<br />
% of population below $1 a day – World Bank.<br />
Expenditure on health, education and defence – International Monetary Fund (IMF).<br />
ODA – Organisation for Economic Co-operation and Development (OECD).<br />
Debt service – World Bank.<br />
Debt service – The sum of interest payments and repayments of principal on external public<br />
and publicly guaranteed long-term debts.<br />
Notes a: Range US$765 or less. - Data not available.<br />
b: Range US$766 to $3035. x Indicates data that refer to years or periods other than those specified in<br />
c: Range US$9386 or more. the column heading, differ from the standard definition, or refer to only part of a country.<br />
117
Table 7: Women<br />
Under-5<br />
mortality<br />
rank<br />
Life expectancy<br />
females as a<br />
% of males<br />
1996<br />
Adult literacy rate<br />
females as a<br />
% of males<br />
1995<br />
Enrolment ratios<br />
females as a % of males<br />
1990-95<br />
primary school<br />
secondary school<br />
Contraceptive<br />
prevalence<br />
(%)<br />
1990-97<br />
% of<br />
pregnant women<br />
immunized against<br />
tetanus<br />
1995-96<br />
% of births<br />
attended<br />
by trained<br />
health<br />
personnel<br />
1990-96<br />
Afghanistan 4 102 32 51 34 2x 37 9x 1700<br />
Albania 88 109 - 101 103 - - 99x 65<br />
Algeria 92 104 66 88 88 57 34 77 160<br />
Andorra 175 - - - - - - - -<br />
Angola 2 107 52x 92 - 1x 28 15x 1500<br />
Antigua and Barbuda 127 92 - - - 53x - 90x -<br />
Argentina 117 110 100 99 107 74x 63 97 100<br />
Armenia 108 110 99 107 113 - - - 50<br />
Australia 175 108 - 99 104 76x - 100 9<br />
Austria 175 110 - 100 95 71x - 100 10<br />
Azerbaijan 85 112 99 96 98 - - - 22<br />
Bahamas 123 110 99 103 100 62x 75x 100x 100<br />
Bahrain 127 106 89 103 103 54x 54 97 60<br />
Bangladesh 44 100 53 87 52 49 72 14 850<br />
Barbados 152 107 99 101 89x 55x 100 98x 43<br />
Belarus 139 117 99 97 105 50 - 100x 37<br />
Belgium 164 108 - 101 101 79 - 100x 10<br />
Belize 85 104 100x 96 113 47 88 77 -<br />
Benin 31 110 53 50 41 9x 75 45x 990<br />
Bhutan 36 106 50 61x 29x 19 70 15 1600<br />
Bolivia 51 107 84 91 85 45 52 47 650<br />
Bosnia and Herzegovina 143 109 - - - - - - -<br />
Botswana 80 106 74 101 107 33x 61 78x 250<br />
Brazil 79 113 100 96x 116x 77 45 88 220<br />
Brunei Darussalam 154 107 89 94 109 - 50x 98 60<br />
Bulgaria 136 110 99 95 106 76x - 100x 27<br />
Burkina Faso 23 104 30 65 50 8 27 42 930<br />
Burundi 17 107 47 82 63 9x 33 19x 1300<br />
Cambodia 19 106 66x 82 58 - 36 47x 900<br />
Cameroon 51 106 69 90 69 16 12 64 550<br />
Canada 164 108 - 98 100 73x - 99x 6<br />
Cape Verde 65 103 79 98 93 15x 4 30x -<br />
Central African Rep. 21 111 75 63x 35x 15 15 46 700<br />
Chad 27 107 56 48 23 1x 50 15 1500<br />
Chile 149 108 100 98 106 43x - 98x 65<br />
China 82 104 81 97 85 83 13 84 95<br />
Colombia 104 107 100 102 119 72 57 85 100<br />
Comoros 39 102 78 85 81 21 34 52 950<br />
Congo 48 110 81 - - - 55 - 890<br />
Congo, Dem. Rep. 12 106 78 74 45 8 20 - 870<br />
Cook Islands 108 - - - - 50 64 99 -<br />
Costa Rica 146 107 100 98 109 75 90 93x 55<br />
Côte d’Ivoire 25 106 60 76 52 11 22 45 810<br />
Croatia 154 112 99 99 108 - 91 - -<br />
Cuba 159 105 99 99 113 70x 61x 90x 95<br />
Cyprus 159 107 93x 100 102 - 57x 100x 5<br />
Czech Rep. 164 109 - 100 104 69 - - 15<br />
Denmark 175 107 - 100 104 78x - 100x 9<br />
Djibouti 24 106 55 77 67 - 39 79x 570<br />
Dominica 133 96 - - - 50x - 96x -<br />
Dominican Rep. 74 106 100 101 138 64 96 96 110<br />
Ecuador 88 107 96 98 104 57 25 64 150<br />
Egypt 58 105 61 87 87 48 55 46 170<br />
El Salvador 88 109 95 101 111 53 69 87 300<br />
Equatorial Guinea 18 106 76 - - - 63 58x 820<br />
Eritrea 41 106 - 80 68 8 23 21 1400<br />
Estonia 145 117 100 97 98 70 - - 41<br />
Ethiopia 16 106 54 64 91 4 36 14x 1400<br />
Maternal<br />
mortality<br />
rate<br />
1990<br />
118
…Table 7<br />
Under-5<br />
mortality<br />
rank<br />
Life expectancy<br />
females as a<br />
% of males<br />
1996<br />
Adult literacy rate<br />
females as a<br />
% of males<br />
1995<br />
Enrolment ratios<br />
females as a % of males<br />
1990-95<br />
primary school<br />
secondary school<br />
Contraceptive<br />
prevalence<br />
(%)<br />
1990-97<br />
% of<br />
pregnant women<br />
immunized against<br />
tetanus<br />
1995-96<br />
% of births<br />
attended<br />
by trained<br />
health<br />
personnel<br />
1990-96<br />
Fiji 121 107 95 99 102 32x 100 96x 90<br />
Finland 189 110 - 100 118 80x - 100 11<br />
France 175 112 - 98 103 75 - 99 15<br />
Gabon 28 108 72 - - - 4 80x 500<br />
Gambia 49 107 47 71 52 12 92 44 1100<br />
Georgia 113 112 99 99 93 - - - 33<br />
Germany 175 110 - 101 99 75 - 99x 22<br />
Ghana 47 105 71 84 64 20 9 44 740<br />
Greece 161 107 97 100 97 - - 97x 10<br />
Grenada 104 - - - - 54 80 81x -<br />
Guatemala 74 108 78 88 92 31 81 35 200<br />
Guinea 11 102 44 49 33 2 43 31 1600<br />
Guinea-Bissau 6 107 63 55x 44x 1x 43 27x 910<br />
Guyana 56 110 99 98x 105x 0x 56 90x -<br />
Haiti 34 106 88 93 95 18 49 21 1000<br />
Holy See - - - - - - - - -<br />
Honduras 97 107 100 101 128 47 99 88 220<br />
Hungary 152 114 100 100 105 73x - 99x 30<br />
Iceland 186 105 - 96 100 - - 100x 0<br />
India 46 100 58 81 64 41 78 34 570<br />
Indonesia 67 105 87 97 84 55 75 36 650<br />
Iran 96 101 76 93 82 73 50 77 120<br />
Iraq 39 105 63 85 64 18x 65 54x 310<br />
Ireland 164 107 - 100 105 - - - 10<br />
Israel 161 104 96x 100 107 - - 99x 7<br />
Italy 164 108 99 101 101 78x - - 12<br />
Jamaica 154 107 110 99 113 62 82 82x 120<br />
Japan 175 108 - 100 101 59 - 100x 18<br />
Jordan 117 106 85 101 104 35 41 87 150<br />
Kazakstan 84 116 99 100 103 59 - 99 80<br />
Kenya 55 108 81 99 82 33 21 45 650<br />
Kiribati 61 92 - - - 28 41 72 -<br />
Korea, Dem. People’s Rep. 108 109 - 94x - - 95 100x 70<br />
Korea, Rep. of 164 112 98 101 99 79 - 98 130<br />
Kuwait 147 105 91 100 98 35x 21 99x 29<br />
Kyrgyzstan 80 114 96 101 106 - - - 110<br />
Lao People’s Dem. Rep. 35 106 64 75 61 19 45 - 650<br />
Latvia 133 117 100 95 106 - 64 - 40<br />
Lebanon 88 104 95 96 111 55x - 45x 300<br />
Lesotho 32 105 77 112 148 23 10 40x 610<br />
Liberia 5 107 41 55x 39x 6x 35 58x 560<br />
Libya 70 106 72 100 100 - 45x 76x 220<br />
Liechtenstein 164 - 100x - - - - - -<br />
Lithuania 139 117 99 98 105 - - - 36<br />
Luxembourg 164 108 - 107 100 - - 99x 0<br />
Madagascar 21 105 53 96 100 17 33 57 490<br />
Malawi 8 100 58 90 67 22 56 55 560<br />
Malaysia 149 106 88 101 110 48x 79x 94 80<br />
Maldives 61 97 100 98 100 10 93 90 -<br />
Mali 7 107 59 64 55 7 32 24 1200<br />
Malta 154 107 101 97 89 - - - 0<br />
Marshall Islands 54 - - - - 27 15x - -<br />
Mauritania 15 108 52 81 58 4 28 40 930<br />
Mauritius 123 110 91 99 103 75 79 97 120<br />
Mexico 102 109 95 96 102 53x 69 77 110<br />
Micronesia, Fed. States of 116 95 - - - - 44 90x -<br />
Moldova, Rep. of 102 113 101 99 104 - - - 60<br />
Monaco 175 - - - - - - - -<br />
Maternal<br />
mortality<br />
rate<br />
1990<br />
119
Table 7: Women<br />
Under-5<br />
mortality<br />
rank<br />
Life expectancy<br />
females as a<br />
% of males<br />
1996<br />
Adult literacy rate<br />
females as a<br />
% of males<br />
1995<br />
Enrolment ratios<br />
females as a % of males<br />
1990-95<br />
primary school<br />
secondary school<br />
Contraceptive<br />
prevalence<br />
(%)<br />
1990-97<br />
% of<br />
pregnant women<br />
immunized against<br />
tetanus<br />
1995-96<br />
% of births<br />
attended<br />
by trained<br />
health<br />
personnel<br />
1990-96<br />
Mongolia 67 105 87 106 140 - - 99x 65<br />
Morocco 64 106 54 74 74 50 100 40 610<br />
Mozambique 9 107 40 72 60 4x 61 25x 1500<br />
Myanmar 25 105 88 96 100 17 79 57x 580<br />
Namibia 60 104 95x 101 121 29 75 68 370<br />
Nauru 104 - - - - - - - -<br />
Nepal 42 98 34 68 50 29 11x 9 1500<br />
Netherlands 175 107 - 102 91 80 - 100x 12<br />
New Zealand 164 107 - 98 103 70x - 99x 25<br />
Nicaragua 73 108 103 103 118 49 96 61 160<br />
Niger 1 109 33 60 56 4 31 15 1200<br />
Nigeria 14 106 70 79 85 6 36 31 1000<br />
Niue - - - - - - - - -<br />
Norway 175 108 - 100 97 76x - 100x 6<br />
Oman 139 106 65x 94 91 9x 98 87x 190<br />
Pakistan 33 103 48 45 52 12 54 19 340<br />
Palau 97 - - - - 38x 55 90 -<br />
Panama 133 106 99 96 108 58x 24 86 55<br />
Papua New Guinea 44 102 78 85 65 4x 50 20x 930<br />
Paraguay 100 107 97 97 105 50 69 66 160<br />
Peru 72 108 87 96x 91x 64 51 56 280<br />
Philippines 93 106 99 101 102x 40 47 53 280<br />
Poland 147 113 99x 98 101 75x - 99x 19<br />
Portugal 164 110 95 97 117 66x - 90x 15<br />
Qatar 132 107 101 94 100 32x - 97x -<br />
Romania 117 111 98 99 101 57 - 100x 130<br />
Russian Federation 117 122 99 99 108 - - - 75<br />
Rwanda 19 106 74 97 82 21 43 26 1300<br />
Saint Kitts and Nevis 93 93 100x - - 41x - 100x -<br />
Saint Lucia 127 93 - - - 47x - 99x -<br />
Saint Vincent/Grenadines 123 92 - - - 58x - 73x -<br />
Samoa 77 106 - - - 21 96 95x 35<br />
San Marino 149 - - - - - - - -<br />
Sao Tome and Principe 57 92 58x - - 10x 49 86x -<br />
Saudi Arabia 108 106 69 95 82 - 60 82x 130<br />
Senegal 36 104 53 75 52 13 34 46 1200<br />
Seychelles 136 91 104x - - - 100 99x -<br />
Sierra Leone 3 109 40 70 55 4x 65 25x 1800<br />
Singapore 189 105 90 98x 103x 74x - 100x 10<br />
Slovakia 154 113 - 100 106 74 - - -<br />
Slovenia 175 113 99x 100 102 - - - 13<br />
Solomon Islands 113 107 - 87 67 25 63 87x -<br />
Somalia 10 106 39x 53x 56x 1x 28 2x 1600<br />
South Africa 69 110 100 97 116 50x 26x 82 230<br />
Spain 186 109 98 101 112 59x - 96x 7<br />
Sri Lanka 136 106 94 98 111 66 81 94 140<br />
Sudan 42 106 60 79 79 8 44 69 660<br />
Suriname 104 107 96 97x 116x - 99x 91x -<br />
Swaziland 53 109 97 95 96 21x 65 55x 560<br />
Sweden 189 107 - 100 101 78x - 100x 7<br />
Switzerland 186 109 - 102 96 71x - 99x 6<br />
Syria 100 108 65 90 82 36 78 67 180<br />
Tajikistan 61 109 100 97 90 - - - 130<br />
Tanzania 29 106 72 97 83 16 92 53 770<br />
TFYR Macedonia 108 106 - 99 102 - 91x - -<br />
Thailand 93 109 96 99 97 74 88 71x 200<br />
Togo 38 106 55 66 35 12x 43 54x 640<br />
Tonga 123 93 - - - 39 88 92 -<br />
Maternal<br />
mortality<br />
rate<br />
1990<br />
120
…Table 7<br />
Under-5<br />
mortality<br />
rank<br />
Life expectancy<br />
females as a<br />
% of males<br />
1996<br />
Adult literacy rate<br />
females as a<br />
% of males<br />
1995<br />
Enrolment ratios<br />
females as a % of males<br />
1990-95<br />
primary school<br />
secondary school<br />
Contraceptive<br />
prevalence<br />
(%)<br />
1990-97<br />
% of<br />
pregnant women<br />
immunized against<br />
tetanus<br />
1995-96<br />
% of births<br />
attended<br />
by trained<br />
health<br />
personnel<br />
1990-96<br />
Trinidad and Tobago 143 107 98 100 105 53x 19x 98x 90<br />
Tunisia 97 103 70 92 91 60 80 69x 170<br />
Turkey 82 108 78 93 66 63 32 76 180<br />
Turkmenistan 58 111 98x - - - - - 55<br />
Tuvalu 74 - - - - - 53 - -<br />
Uganda 30 105 68 80 57 15 55 38 1200<br />
Ukraine 121 116 101 100 108 - - 100x 50<br />
United Arab Emirates 139 103 101 96 110 - - 96x 26<br />
United Kingdom 164 108 - 100 102 82 - 100x 9<br />
United States 163 110 - 99 99 74x - 99x 12<br />
Uruguay 127 109 101 99 119 84 13x 96x 85<br />
Uzbekistan 71 111 100 97 88 56 - - 55<br />
Vanuatu 77 106 84x 102 78 15 15 86x 280<br />
Venezuela 115 107 98 103 141 49x 60 69x 120<br />
Viet Nam 85 108 94 94x 93x 65 82 95x 160<br />
Yemen 50 102 49x 40 24 7 55 16 1400<br />
Yugoslavia, Fed. Rep. 127 107 98 104 103 - - - -<br />
Zambia 13 102 83 93 61 15 48 51 940<br />
Zimbabwe 65 104 89 93 80 48 65 69 570<br />
Maternal<br />
mortality<br />
rate<br />
1990<br />
Regional summaries<br />
Sub-Saharan Africa 106 71 82 80 15 38 37 980<br />
Middle East and North Africa 104 67 86 82 46 57 62 320<br />
South Asia 101 57 77 63 38 71 29 610<br />
East Asia and Pacific 105 84 97 88 74 35 75 210<br />
Latin America and Caribbean 109 97 97 109 64 58 78 190<br />
CEE/CIS and Baltic States 113 97 98 98 64 - 90 85<br />
Industrialized countries 109 98 100 101 72 - 99 13<br />
Developing countries 104 78 88 81 54 51 53 470<br />
Least developed countries 104 63 79 59 19 48 29 1100<br />
World 105 81 90 86 57 51 57 430<br />
Countries in each region are listed on page 122.<br />
Definitions of the indicators<br />
Life expectancy at birth – The number of years newborn children would live if subject<br />
to the mortality risks prevailing for the cross-section of population at the time of their birth.<br />
Adult literacy rate – Percentage of persons aged 15 and over who can read and write.<br />
Primary or secondary enrolment ratios – The number of children enrolled in a<br />
schooling level (primary or secondary), regardless of age, divided by the population of the<br />
age group which officially corresponds to that level.<br />
Contraceptive prevalence – Percentage of married women aged 15-49 years currently<br />
using contraception.<br />
Births attended – Percentage of births attended by physicians, nurses, midwives, or<br />
primary health care workers trained in midwifery skills.<br />
Maternal mortality rate – Annual number of deaths of women from pregnancy-related<br />
causes per 100,000 live births. Several of the maternal mortality rates in table 7 are<br />
substantially different from official government estimates. These and other rates are being<br />
reviewed by WHO and UNICEF and will be revised where necessary, as part of the ongoing<br />
process of improving maternal mortality estimates.<br />
Main data sources<br />
Life expectancy – United Nations Population Division.<br />
Adult literacy – United Nations Educational, Scientific and Cultural Organization<br />
(UNESCO).<br />
School enrolment – United Nations Educational, Scientific and Cultural Organization<br />
(UNESCO) and Demographic and Health Surveys.<br />
Immunization – World Health Organization (WHO), UNICEF, Multiple Indicator Cluster<br />
Surveys (MICS) and Demographic and Health Surveys (DHS).<br />
Contraceptive prevalence – United Nations Population Division and Demographic and<br />
Health Surveys.<br />
Births attended – World Health Organization (WHO).<br />
Maternal mortality – World Health Organization (WHO) and UNICEF.<br />
Notes - Data not available.<br />
x Indicates data that refer to years or periods other than those specified in the column heading, differ from the standard definition, or refer to only part of a country.<br />
121
Regional summaries country list<br />
Regional averages given at the end of each<br />
table are calculated using data from the<br />
countries as grouped below.<br />
Sub-Saharan Africa<br />
Angola; Benin; Botswana; Burkina Faso;<br />
Burundi; Cameroon; Cape Verde; Central<br />
African Rep.; Chad; Comoros; Congo; Congo,<br />
Dem. Rep.; Côte d’Ivoire; Equatorial Guinea;<br />
Eritrea; Ethiopia; Gabon; Gambia; Ghana;<br />
Guinea; Guinea-Bissau; Kenya; Lesotho;<br />
Liberia; Madagascar; Malawi; Mali; Mauritania;<br />
Mauritius; Mozambique; Namibia; Niger;<br />
Nigeria; Rwanda; Sao Tome and Principe;<br />
Senegal; Seychelles; Sierra Leone; Somalia;<br />
South Africa; Swaziland; Tanzania; Togo;<br />
Uganda; Zambia; Zimbabwe.<br />
Middle East and North Africa<br />
Algeria; Bahrain; Cyprus; Djibouti; Egypt; Iran;<br />
Iraq; Jordan; Kuwait; Lebanon; Libya; Morocco;<br />
Oman; Qatar; Saudi Arabia; Sudan; Syria;<br />
Tunisia; United Arab Emirates; Yemen.<br />
South Asia<br />
Afghanistan; Bangladesh; Bhutan; India;<br />
Maldives; Nepal; Pakistan; Sri Lanka.<br />
East Asia and Pacific<br />
Brunei Darussalam; Cambodia; China; Cook<br />
Islands; Fiji; Indonesia; Kiribati; Korea, Dem.<br />
People’s Rep.; Korea, Rep. of; Lao People’s<br />
Dem. Rep.; Malaysia; Marshall Islands;<br />
Micronesia, Fed. States of; Mongolia;<br />
Myanmar; Nauru; Niue; Palau; Papua New<br />
Guinea; Philippines; Samoa; Singapore;<br />
Solomon Islands; Thailand; Tonga; Tuvalu;<br />
Vanuatu; Viet Nam.<br />
Latin America and Caribbean<br />
Antigua and Barbuda; Argentina; Bahamas;<br />
Barbados; Belize; Bolivia; Brazil; Chile;<br />
Colombia; Costa Rica; Cuba; Dominica;<br />
Dominican Rep.; Ecuador; El Salvador;<br />
Grenada; Guatemala; Guyana; Haiti; Honduras;<br />
Jamaica; Mexico; Nicaragua; Panama;<br />
Paraguay; Peru; Saint Kitts and Nevis; Saint<br />
Lucia; Saint Vincent/Grenadines; Suriname;<br />
Trinidad and Tobago; Uruguay; Venezuela.<br />
CEE/CIS and Baltic States<br />
Albania; Armenia; Azerbaijan; Belarus; Bosnia<br />
and Herzegovina; Bulgaria; Croatia; Czech<br />
Rep.; Estonia; Georgia; Hungary; Kazakstan;<br />
Kyrgyzstan; Latvia; Lithuania; Moldova, Rep.<br />
of; Poland; Romania; Russian Federation;<br />
Slovakia; Tajikistan; TFYR Macedonia; Turkey;<br />
Turkmenistan; Ukraine; Uzbekistan; Yugoslavia,<br />
Fed. Rep.<br />
Industrialized countries<br />
Andorra; Australia; Austria; Belgium; Canada;<br />
Denmark; Finland; France; Germany; Greece;<br />
Holy See; Iceland; Ireland; Israel; Italy; Japan;<br />
Liechtenstein; Luxembourg; Malta; Monaco;<br />
Netherlands; New Zealand; Norway; Portugal;<br />
San Marino; Slovenia; Spain; Sweden;<br />
Switzerland; United Kingdom; United States.<br />
Developing countries<br />
Afghanistan; Algeria; Angola; Antigua and<br />
Barbuda; Argentina; Armenia; Azerbaijan;<br />
Bahamas; Bahrain; Bangladesh; Barbados;<br />
Belize; Benin; Bhutan; Bolivia; Botswana;<br />
Brazil; Brunei Darussalam; Burkina Faso;<br />
Burundi; Cambodia; Cameroon; Cape Verde;<br />
Central African Rep.; Chad; Chile; China;<br />
Colombia; Comoros; Congo; Congo, Dem. Rep.;<br />
Cook Islands; Costa Rica; Côte d’Ivoire; Cuba;<br />
Cyprus; Djibouti; Dominica; Dominican Rep.;<br />
Ecuador; Egypt; El Salvador; Equatorial Guinea;<br />
Eritrea; Ethiopia; Fiji; Gabon; Gambia; Georgia;<br />
Ghana; Grenada; Guatemala; Guinea; Guinea-<br />
Bissau; Guyana; Haiti; Honduras; India;<br />
Indonesia; Iran; Iraq; Israel; Jamaica; Jordan;<br />
Kazakstan; Kenya; Kiribati; Korea, Dem.<br />
People’s Rep.; Korea, Rep. of; Kuwait;<br />
Kyrgyzstan; Lao People’s Dem. Rep.; Lebanon;<br />
Lesotho; Liberia; Libya; Madagascar; Malawi;<br />
Malaysia; Maldives; Mali; Marshall Islands;<br />
Mauritania; Mauritius; Mexico; Micronesia,<br />
Fed. States of; Mongolia; Morocco;<br />
Mozambique; Myanmar; Namibia; Nauru;<br />
Nepal; Nicaragua; Niger; Nigeria; Niue; Oman;<br />
Pakistan; Palau; Panama; Papua New Guinea;<br />
Paraguay; Peru; Philippines; Qatar; Rwanda;<br />
Saint Kitts and Nevis; Saint Lucia; Saint<br />
Vincent/Grenadines; Samoa; Sao Tome and<br />
Principe; Saudi Arabia; Senegal; Seychelles;<br />
Sierra Leone; Singapore; Solomon Islands;<br />
Somalia; South Africa; Sri Lanka; Sudan;<br />
Suriname; Swaziland; Syria; Tajikistan; Tanzania;<br />
Thailand; Togo; Tonga; Trinidad and Tobago;<br />
Tunisia; Turkey; Turkmenistan; Tuvalu; Uganda;<br />
United Arab Emirates; Uruguay; Uzbekistan;<br />
Vanuatu; Venezuela; Viet Nam; Yemen; Zambia;<br />
Zimbabwe.<br />
Least developed countries<br />
Afghanistan; Angola; Bangladesh; Benin;<br />
Bhutan; Burkina Faso; Burundi; Cambodia;<br />
Cape Verde; Central African Rep.; Chad; Comoros;<br />
Congo, Dem. Rep.; Djibouti; Equatorial Guinea;<br />
Eritrea; Ethiopia; Gambia; Guinea; Guinea-<br />
Bissau; Haiti; Kiribati; Lao People’s Dem. Rep.;<br />
Lesotho; Liberia; Madagascar; Malawi; Maldives;<br />
Mali; Mauritania; Mozambique; Myanmar;<br />
Nepal; Niger; Rwanda; Samoa; Sao Tome and<br />
Principe; Sierra Leone; Solomon Islands;<br />
Somalia; Sudan; Tanzania; Togo; Tuvalu;<br />
Uganda; Vanuatu; Yemen; Zambia.<br />
122
Measuring human development<br />
An introduction to table 8<br />
If development in the 1990s is to assume a<br />
more human face then there arises a corresponding<br />
need for a means of measuring<br />
human as well as economic progress. From<br />
UNICEF’s point of view, in particular, there is a<br />
need for an agreed method of measuring the<br />
level of child well-being and its rate of<br />
change.<br />
The under-five mortality rate (U5MR) is<br />
used in table 8 (next page) as the principal indicator<br />
of such progress.<br />
The U5MR has several advantages. First,<br />
it measures an end result of the development<br />
process rather than an ‘input’ such as school<br />
enrolment level, per capita calorie availability,<br />
or the number of doctors per thousand population<br />
— all of which are means to an end.<br />
Second, the U5MR is known to be the result<br />
of a wide variety of inputs: the nutritional<br />
health and the health knowledge of mothers;<br />
the level of immunization and ORT use; the<br />
availability of maternal and child health services<br />
(including prenatal care); income and<br />
food availability in the family; the availability<br />
of clean water and safe sanitation; and the<br />
overall safety of the child’s environment.<br />
Third, the U5MR is less susceptible than,<br />
say, per capita GNP to the fallacy of the average.<br />
This is because the natural scale does<br />
not allow the children of the rich to be one<br />
thousand times as likely to survive, even if the<br />
man-made scale does permit them to have<br />
one thousand times as much income. In other<br />
words, it is much more difficult for a wealthy<br />
minority to affect a nation’s U5MR, and it<br />
therefore presents a more accurate, if far from<br />
perfect, picture of the health status of the majority<br />
of children (and of society as a whole).<br />
For these reasons, the U5MR is chosen by<br />
UNICEF as its single most important indicator<br />
of the state of a nation’s children. That is why<br />
the tables rank the nations of the world not in<br />
ascending order of their per capita GNP but in<br />
descending order of their under-five mortality<br />
rates.<br />
The speed of progress in reducing the<br />
U5MR can be measured by calculating its average<br />
annual reduction rate (AARR). Unlike<br />
the comparison of absolute changes, the<br />
AARR reflects the fact that the lower limits to<br />
U5MR are approached only with increasing<br />
difficulty. As lower levels of under-five mortality<br />
are reached, for example, the same absolute<br />
reduction obviously represents a<br />
greater percentage of reduction. The AARR<br />
therefore shows a higher rate of progress for,<br />
say, a 10-point reduction if that reduction happens<br />
at a lower level of under-five mortality.<br />
(A fall in U5MR of 10 points from 100 to 90<br />
represents a reduction of 10 per cent, whereas<br />
the same 10-point fall from 20 to 10 represents<br />
a reduction of 50 per cent).<br />
When used in conjunction with GNP<br />
growth rates, the U5MR and its reduction rate<br />
can therefore give a picture of the progress<br />
being made by any country or region, and over<br />
any period of time, towards the satisfaction of<br />
some of the most essential of human needs.<br />
As table 8 shows, there is no fixed relationship<br />
between the annual reduction rate of<br />
the U5MR and the annual rate of growth in<br />
per capita GNP. Such comparisons help to<br />
throw the emphasis on to the policies, priorities,<br />
and other factors which determine the<br />
ratio between economic and social progress.<br />
Finally, the table gives the total fertility<br />
rate for each country and its average annual<br />
rate of reduction. It will be seen that many of<br />
the nations that have achieved significant reductions<br />
in their U5MR have also achieved<br />
significant reductions in fertility.<br />
123
Table 8: The rate of progress<br />
Under-5<br />
mortality<br />
rank<br />
Under-5<br />
mortality<br />
rate<br />
1960 1980 1996<br />
Average annual<br />
rate of reduction (%)<br />
required<br />
1960-80 1980-96 1996-2000<br />
GNP per capita<br />
average annual<br />
growth rate (%)<br />
1965-80 1985-95<br />
Total<br />
fertility rate<br />
1960 1980 1996<br />
Average annual<br />
rate of reduction (%)<br />
1960-80 1980-96<br />
Afghanistan 4 360 280 257 1.3 0.5 32.5 0.6 - 6.9 7.1 6.9 -0.1 0.2<br />
Albania 88 151 57 40 4.9 2.2 9.6 - -6.0x 5.9 3.8 2.7 2.2 2.1<br />
Algeria 92 255 139 39 3.0 7.9 4.9 4.2 -2.4 7.3 6.8 4.0 0.4 3.3<br />
Andorra 175 - - 6 - - - - - - - - - -<br />
Angola 2 345 261 292 1.4 -0.7 35.7 - -6.1 6.4 6.9 6.8 -0.4 0.1<br />
Antigua and Barbuda 127 - - 22 - - - - 2.7 - - - - -<br />
Argentina 117 72 38 25 3.2 2.6 7.3 1.7 1.8 3.1 3.3 2.7 -0.3 1.3<br />
Armenia 108 48 28 30 2.7 -0.4 9.3 - -15.1 4.5 2.4 1.8 3.1 1.8<br />
Australia 175 24 13 6 3.0 4.7 0.0 2.2 1.4 3.3 2.0 1.9 2.5 0.3<br />
Austria 175 43 17 6 4.6 7.1 -3.4 4.0 1.9 2.7 1.6 1.4 2.6 0.8<br />
Azerbaijan 85 75 52 45 1.8 0.9 10.7 - -16.3 5.5 3.3 2.4 2.6 2.0<br />
Bahamas 123 68 35 23 3.3 2.6 4.4 - -0.8 3.8 2.8 2.0 1.5 2.1<br />
Bahrain 127 203 42 22 7.9 4.0 9.1 - 0.2 7.1 4.9 3.1 1.9 2.9<br />
Bangladesh 44 247 211 112 0.8 4.0 11.8 -0.3 2.1 6.7 6.4 3.2 0.2 4.3<br />
Barbados 152 90 29 12 5.7 5.5 9.2 - 0.8 4.5 2.1 1.7 3.8 1.3<br />
Belarus 139 47 26 18 3.0 2.3 7.6 - -5.2 2.7 2.1 1.5 1.3 2.1<br />
Belgium 164 35 15 7 4.3 5.0 1.5 3.6 2.2 2.6 1.6 1.6 2.4 0.0<br />
Belize 85 104 70 44 2.0 2.9 7.4 - 3.9 6.5 5.8 3.8 0.6 2.6<br />
Benin 31 310 176 140 2.8 1.4 17.3 -0.3 -0.3 6.9 7.1 6.0 -0.1 1.1<br />
Bhutan 36 300 227 127 1.4 3.6 14.9 - 4.9 5.9 5.9 5.9 0.0 0.0<br />
Bolivia 51 252 170 102 2.0 3.2 9.4 1.7 1.8 6.7 5.6 4.5 0.9 1.4<br />
Bosnia and Herzegovina 143 155 38 17 7.0 5.0 6.1 - - 4.0 2.1 1.4 3.2 2.5<br />
Botswana 80 170 94 50 3.0 3.9 4.8 9.9 6.1 6.8 6.1 4.6 0.5 1.8<br />
Brazil 79 177 92 52 3.3 3.6 6.6 6.3 -0.8 6.2 4.0 2.3 2.2 3.5<br />
Brunei Darussalam 154 87 22 11 6.9 4.3 10.9 - - 6.9 4.1 2.8 2.6 2.4<br />
Bulgaria 136 70 25 19 5.1 1.7 11.5 - -2.6 2.2 2.1 1.5 0.2 2.1<br />
Burkina Faso 23 318 246 158 1.3 2.8 20.4 1.7 -0.2 6.7 7.8 6.7 -0.8 1.0<br />
Burundi 17 255 193 176 1.4 0.6 23.0 2.4 -1.3 6.8 6.8 6.4 0.0 0.4<br />
Cambodia 19 217 330 170 -2.1 4.1 22.2 - 2.0 6.3 4.6 4.6 1.6 0.0<br />
Cameroon 51 264 173 102 2.1 3.3 9.4 2.4 -6.6 5.8 6.4 5.4 -0.5 1.1<br />
Canada 164 33 13 7 4.8 4.0 4.0 3.3 0.4 3.8 1.7 1.6 4.0 0.4<br />
Cape Verde 65 164 95 73 2.7 1.7 10.1 - 2.1 7.0 6.5 3.7 0.4 3.5<br />
Central African Rep. 21 343 180 164 3.2 0.6 21.3 0.8 -2.4 5.6 5.8 5.1 -0.2 0.8<br />
Chad 27 325 206 149 2.3 2.0 18.9 -1.9 0.6 6.0 5.9 5.6 0.1 0.3<br />
Chile 149 138 35 13 6.9 6.2 -0.9 0.0 6.1 5.3 2.8 2.5 3.2 0.7<br />
China 82 209 65 47 5.9 2.0 10.2 4.1 8.3 5.7 2.9 1.8 3.4 3.0<br />
Colombia 104 130 58 31 4.0 3.9 3.7 3.7 2.6 6.8 3.8 2.8 2.9 1.9<br />
Comoros 39 248 167 122 2.0 2.0 13.9 - -1.4 6.8 7.1 5.7 -0.2 1.4<br />
Congo 48 220 125 108 2.8 0.9 10.8 2.7 -3.2 5.9 6.3 6.0 -0.3 0.3<br />
Congo, Dem. Rep. 12 302 210 207 1.8 0.1 27.1 -1.3 -8.5 6.0 6.6 6.4 -0.5 0.2<br />
Cook Islands 108 - 37 30 - 1.3 8.6 - - - - - - -<br />
Costa Rica 146 112 29 15 6.8 4.0 8.7 3.3 2.8 7.0 3.7 3.0 3.2 1.3<br />
Côte d’Ivoire 25 300 170 150 2.8 0.8 19.1 2.8 -4.3 7.2 7.4 5.3 -0.1 2.1<br />
Croatia 154 98 23 11 7.2 4.6 5.9 - - 2.3 2.0 1.6 0.7 1.4<br />
Cuba 159 54 22 10 4.5 4.7 4.5 - - 4.2 2.0 1.6 3.7 1.4<br />
Cyprus 159 36 20 10 2.9 4.7 4.6 - 4.6 3.5 2.4 2.3 1.9 0.3<br />
Czech Rep. 164 25 19 7 1.4 6.6 -2.9 - -1.8 2.3 2.2 1.5 0.2 2.4<br />
Denmark 175 25 10 6 4.4 3.1 1.2 2.2 1.5 2.6 1.6 1.8 2.4 -0.7<br />
Djibouti 24 289 199 157 1.9 1.5 20.2 - - 7.0 6.6 5.5 0.3 1.1<br />
Dominica 133 - - 20 - - 6.7 - 4.1 - - - - -<br />
Dominican Rep. 74 149 92 56 2.4 3.1 6.4 3.8 2.1 7.4 4.3 2.9 2.7 2.5<br />
Ecuador 88 180 101 40 2.9 5.8 4.6 5.4 0.8 6.7 5.1 3.2 1.4 2.9<br />
Egypt 58 282 175 78 2.4 5.1 2.7 2.8 1.1 7.0 5.2 3.5 1.5 2.5<br />
El Salvador 88 210 120 40 2.8 6.9 2.6 1.5 2.8 6.8 5.1 3.2 1.4 2.9<br />
Equatorial Guinea 18 316 243 173 1.3 2.1 22.6 - 2.3 5.5 5.7 5.6 -0.2 0.1<br />
Eritrea 41 250 195 120 1.2 3.0 13.5 - - 6.6 6.1 5.5 0.4 0.6<br />
Estonia 145 52 25 16 3.7 2.8 3.3 - -4.3 2.0 2.1 1.4 -0.2 2.5<br />
Ethiopia 16 280 213 177 1.4 1.2 23.2 0.4 -0.3 6.9 6.9 7.0 0.0 -0.1<br />
124
…Table 8<br />
Under-5<br />
mortality<br />
rank<br />
Under-5<br />
mortality<br />
rate<br />
1960 1980 1996<br />
Average annual<br />
rate of reduction (%)<br />
required<br />
1960-80 1980-96 1996-2000<br />
GNP per capita<br />
average annual<br />
growth rate (%)<br />
1965-80 1985-95<br />
Total<br />
fertility rate<br />
1960 1980 1996<br />
Average annual<br />
rate of reduction (%)<br />
1960-80 1980-96<br />
Fiji 121 97 42 24 4.2 3.5 3.6 - 2.0 6.4 3.9 2.8 2.5 2.1<br />
Finland 189 28 9 4 5.9 4.4 -1.1 3.6 -0.2 2.7 1.7 1.8 2.3 -0.4<br />
France 175 34 13 6 4.9 5.2 -2.6 3.7 1.5 2.8 1.9 1.7 1.9 0.7<br />
Gabon 28 287 194 145 2.0 1.8 18.2 5.6 -8.2 4.1 4.4 5.3 -0.4 -1.2<br />
Gambia 49 375 250 107 2.0 5.3 10.6 - 0.3 6.4 6.5 5.3 -0.1 1.3<br />
Georgia 113 70 44 29 2.3 2.6 8.4 - -17.0 2.9 2.3 2.0 1.2 0.9<br />
Germany 175 40 16 6 4.7 6.2 -0.4 3.0x 1.9x 2.4 1.5 1.3 2.4 0.9<br />
Ghana 47 213 155 110 1.6 2.1 11.3 -0.8 1.4 6.9 6.5 5.4 0.3 1.2<br />
Greece 161 64 23 9 5.2 5.9 4.6 4.8 1.3 2.2 2.1 1.4 0.2 2.5<br />
Grenada 104 - - 31 - - 5.7 - - - - - - -<br />
Guatemala 74 204 140 56 1.9 5.7 1.2 3.0 0.3 6.9 6.3 5.0 0.5 1.4<br />
Guinea 11 380 300 210 1.2 2.2 27.5 1.3 1.4 7.0 7.0 6.7 0.0 0.3<br />
Guinea-Bissau 6 336 290 223 0.7 1.7 29.0 -2.7 2.0 5.1 5.7 5.5 -0.6 0.2<br />
Guyana 56 126 90 83 1.7 0.5 8.1 - 0.6 6.5 3.6 2.4 3.0 2.5<br />
Haiti 34 260 200 134 1.3 2.5 16.2 0.9 -5.2 6.3 5.3 4.7 0.9 0.8<br />
Holy See - - - - - - - - - - - - - -<br />
Honduras 97 204 101 35 3.5 6.6 0.7 1.1 0.1 7.5 6.3 4.5 0.9 2.1<br />
Hungary 152 57 26 12 3.9 4.8 2.4 5.1 -1.0 2.0 2.0 1.5 0.0 1.8<br />
Iceland 186 22 9 5 4.5 3.3 12.6 - 1.0 4.0 2.3 2.2 2.8 0.3<br />
India 46 236 177 111 1.4 2.9 11.5 1.5 3.2 5.9 4.7 3.2 1.1 2.4<br />
Indonesia 67 216 128 71 2.6 3.7 2.9 5.2 6.0 5.5 4.4 2.7 1.1 3.1<br />
Iran 96 233 126 37 3.1 7.7 -1.5 2.9 -1.5 7.2 6.7 4.9 0.4 2.0<br />
Iraq 39 171 83 122 3.6 -2.4 33.5 - - 7.2 6.5 5.4 0.5 1.2<br />
Ireland 164 36 14 7 4.6 4.4 4.2 2.8 5.2 3.8 3.2 1.9 0.9 3.3<br />
Israel 161 39 19 9 3.6 5.0 2.8 3.7 2.5 3.9 3.3 2.8 0.8 1.0<br />
Italy 164 50 17 7 5.3 5.7 1.5 3.2 1.8 2.5 1.7 1.2 1.9 2.2<br />
Jamaica 154 76 39 11 3.4 7.8 0.9 -0.1 3.6 5.4 3.8 2.5 1.8 2.6<br />
Japan 175 40 11 6 6.6 3.5 9.5 5.1 2.9 2.0 1.8 1.5 0.5 1.1<br />
Jordan 117 139 64 25 3.9 5.9 1.0 5.8x -4.5 7.7 7.1 5.3 0.4 1.8<br />
Kazakstan 84 74 57 45 1.3 1.5 8.5 - -8.6 4.5 3.0 2.4 2.0 1.4<br />
Kenya 55 202 112 90 2.9 1.4 10.1 3.1 0.1 8.0 7.8 5.0 0.1 2.8<br />
Kiribati 61 - - 76 - - 6.5 - -0.6 - - - - -<br />
Korea, Dem. People’s Rep. 108 120 43 30 5.1 2.3 6.3 - - 5.8 2.8 2.1 3.6 1.8<br />
Korea, Rep. of 164 127 18 7 9.8 5.9 3.9 7.3 7.7 6.0 2.7 1.7 4.0 2.9<br />
Kuwait 147 128 35 14 6.6 5.6 6.4 0.6x 1.1 7.3 5.4 2.9 1.5 3.9<br />
Kyrgyzstan 80 115 73 50 2.3 2.4 7.7 - -6.9 5.1 4.1 3.3 1.1 1.4<br />
Lao People’s Dem. Rep. 35 235 200 128 0.8 2.8 15.1 - 2.7 6.2 6.7 6.7 -0.4 0.0<br />
Latvia 133 44 26 20 2.6 1.6 10.2 - -6.6 1.9 2.0 1.5 -0.3 1.8<br />
Lebanon 88 85 40 40 3.8 0.0 10.1 - 2.7 6.3 4.0 2.9 2.3 2.0<br />
Lesotho 32 203 168 139 0.9 1.2 17.1 6.8 1.2 5.8 5.7 5.0 0.1 0.8<br />
Liberia 5 288 235 235 1.0 0.0 30.3 0.5 - 6.6 6.8 6.5 -0.1 0.3<br />
Libya 70 269 118 61 4.1 4.1 4.0 0.0 - 7.1 7.3 6.1 -0.1 1.1<br />
Liechtenstein 164 - - 7 - - - - - - - - - -<br />
Lithuania 139 70 25 18 5.1 2.1 7.6 - -11.7 2.5 2.1 1.6 0.9 1.7<br />
Luxembourg 164 41 16 7 4.6 4.8 6.5 - 0.9 2.3 1.5 1.7 2.1 -0.8<br />
Madagascar 21 364 216 164 2.6 1.7 21.3 -0.4 -2.2 6.6 6.6 5.8 0.0 0.8<br />
Malawi 8 365 290 217 1.1 1.8 28.3 3.2 -0.7 6.9 7.6 6.8 -0.5 0.7<br />
Malaysia 149 105 42 13 4.6 7.3 -1.3 4.7 5.7 6.8 4.2 3.4 2.4 1.3<br />
Maldives 61 258 129 76 3.5 3.3 7.6 - 5.9 7.0 6.9 6.8 0.1 0.1<br />
Mali 7 500 300 220 2.6 1.9 28.6 2.1x 0.8 7.1 7.1 6.8 0.0 0.3<br />
Malta 154 42 17 11 4.6 2.8 4.3 - 5.1 3.4 2.0 2.1 2.7 -0.3<br />
Marshall Islands 54 - - 92 - - 10.2 - - - - - - -<br />
Mauritania 15 330 175 183 3.2 -0.3 24.0 -0.1 0.5 6.5 6.3 5.1 0.2 1.3<br />
Mauritius 123 84 42 23 3.4 3.9 6.9 3.7 5.4 5.8 2.8 2.3 3.6 1.2<br />
Mexico 102 148 87 32 2.7 6.3 5.3 3.6 0.1 6.9 4.8 2.9 1.8 3.1<br />
Micronesia, Fed. States of 116 - - 27 - - 6.6 - - - - - - -<br />
Moldova, Rep. of 102 88 52 32 2.6 3.0 6.5 - -8.2 3.3 2.5 1.9 1.4 1.7<br />
Monaco 175 - - 6 - - - - - - - - - -<br />
125
Table 8: The rate of progress<br />
Under-5<br />
mortality<br />
rank<br />
Under-5<br />
mortality<br />
rate<br />
1960 1980 1996<br />
Average annual<br />
rate of reduction (%)<br />
required<br />
1960-80 1980-96 1996-2000<br />
GNP per capita<br />
average annual<br />
growth rate (%)<br />
1965-80 1985-95<br />
Total<br />
fertility rate<br />
1960 1980 1996<br />
Average annual<br />
rate of reduction (%)<br />
1960-80 1980-96<br />
Mongolia 67 185 112 71 2.5 2.8 5.8 - -3.8 6.0 6.2 3.4 -0.2 3.8<br />
Morocco 64 220 152 74 1.8 4.5 7.3 2.7 0.9 7.2 5.5 3.3 1.3 3.2<br />
Mozambique 9 280 280 214 0.0 1.7 27.9 - 3.6 6.3 6.5 6.2 -0.2 0.3<br />
Myanmar 25 237 146 150 2.4 -0.2 19.1 1.6 0.4 6.0 5.1 3.4 0.8 2.5<br />
Namibia 60 206 114 77 3.0 2.5 8.1 - 2.9 6.0 5.9 5.0 0.1 1.0<br />
Nauru 104 - - 31 - - - - - - - - - -<br />
Nepal 42 315 195 116 2.4 3.2 12.6 - 2.4 5.8 6.2 5.1 -0.3 1.2<br />
Netherlands 175 22 11 6 3.4 3.8 3.2 2.7 1.9 3.1 1.5 1.6 3.6 -0.4<br />
New Zealand 164 26 16 7 2.5 4.7 -0.3 1.7 0.8 3.9 2.1 2.1 3.1 0.0<br />
Nicaragua 73 209 143 57 1.9 5.7 3.3 -0.7 -5.4 7.3 6.2 4.0 0.8 2.7<br />
Niger 1 320 320 320 0.0 0.0 38.0 -2.5 -2.1 7.3 8.1 7.2 -0.5 0.7<br />
Nigeria 14 204 196 191 0.2 0.1 25.1 4.2 1.2 6.5 6.5 6.1 0.0 0.4<br />
Niue - - - - - - - - - - - - - -<br />
Norway 175 23 11 6 3.8 4.1 -0.9 3.6 1.7 2.9 1.8 1.9 2.4 -0.3<br />
Oman 139 280 95 18 5.4 10.4 -2.6 9.0 0.3 7.2 7.2 7.2 0.0 0.0<br />
Pakistan 33 226 161 136 1.7 1.1 16.6 1.8 1.2 6.9 6.8 5.2 0.1 1.7<br />
Palau 97 - 39 35 - 0.7 10.2 - - - - - - -<br />
Panama 133 104 31 20 6.0 2.7 9.1 2.8 -0.4 5.9 3.8 2.7 2.2 2.1<br />
Papua New Guinea 44 204 112 112 3.0 0.0 11.8 - 2.3 6.3 5.6 4.8 0.6 1.0<br />
Paraguay 100 90 61 34 1.9 3.7 8.0 4.1 1.2 6.5 5.2 4.3 1.1 1.2<br />
Peru 72 234 126 58 3.1 4.8 3.7 0.8 -1.6 6.9 5.0 3.1 1.6 3.0<br />
Philippines 93 107 69 38 2.2 3.7 2.3 3.2 1.5 6.9 4.9 3.7 1.7 1.8<br />
Poland 147 70 24 14 5.3 3.6 3.3 - 1.2 3.0 2.3 1.7 1.3 1.9<br />
Portugal 164 112 31 7 6.4 9.1 -9.9 4.6 3.6 3.1 2.2 1.5 1.7 2.4<br />
Qatar 132 239 55 21 7.3 6.0 -3.4 - -4.2 7.0 5.8 3.9 0.9 2.5<br />
Romania 117 82 36 25 4.1 2.2 4.2 - -3.8 2.3 2.4 1.4 -0.2 3.4<br />
Russian Federation 117 65 36 25 3.0 2.3 5.6 - -5.1 2.6 2.0 1.4 1.3 2.2<br />
Rwanda 19 210 218 170 -0.2 1.6 22.2 1.6 -5.4 7.5 8.3 6.2 -0.5 1.8<br />
Saint Kitts and Nevis 93 - - 38 - - 6.5 - 4.8 - - - - -<br />
Saint Lucia 127 - - 22 - - 10.1 - 3.9 - - - - -<br />
Saint Vincent/Grenadines 123 - - 23 - - 7.1 - 3.8 - - - - -<br />
Samoa 77 210 100 53 3.7 4.0 6.2 - 0.2 8.3 5.9 3.9 1.7 2.6<br />
San Marino 149 - - 13 - - - - - - - - - -<br />
Sao Tome and Principe 57 - - 80 - - 7.2 - -2.1 - - - - -<br />
Saudi Arabia 108 292 85 30 6.2 6.5 0.0 4.0x -1.9 7.2 7.3 6.0 -0.1 1.2<br />
Senegal 36 300 218 127 1.6 3.4 14.9 -0.5 -1.2 7.0 6.9 5.8 0.1 1.1<br />
Seychelles 136 - - 19 - - 7.6 - 4.2 - - - - -<br />
Sierra Leone 3 385 301 284 1.2 0.4 35.0 0.7 -3.6 6.2 6.5 6.2 -0.2 0.3<br />
Singapore 189 40 13 4 5.6 7.1 -5.8 8.3 6.2 5.5 1.8 1.8 5.6 0.0<br />
Slovakia 154 40 23 11 2.7 4.7 1.9 - -2.8 3.1 2.4 1.6 1.3 2.5<br />
Slovenia 175 45 18 6 4.6 6.8 -2.3 - - 2.4 2.1 1.3 0.7 3.0<br />
Solomon Islands 113 185 56 29 6.0 4.1 4.7 - 3.2 6.4 6.7 5.1 -0.2 1.7<br />
Somalia 10 294 246 211 0.9 1.0 27.6 -0.1 -2.3x 7.0 7.0 7.0 0.0 0.0<br />
South Africa 69 126 91 66 1.6 2.0 7.6 3.2 -1.1 6.5 4.9 3.9 1.4 1.4<br />
Spain 186 57 16 5 6.2 7.1 -2.3 4.1 2.6 2.8 2.2 1.2 1.2 3.8<br />
Sri Lanka 136 130 52 19 4.6 6.3 9.3 2.8 2.6 5.3 3.5 2.1 2.1 3.2<br />
Sudan 42 210 145 116 1.9 1.4 12.6 0.8 0.6 6.7 6.5 4.7 0.2 2.0<br />
Suriname 104 96 52 31 3.0 3.3 4.8 - 3.5 6.6 3.8 2.5 2.8 2.6<br />
Swaziland 53 233 151 97 2.2 2.7 8.2 - -1.4 6.5 6.3 4.6 0.2 2.0<br />
Sweden 189 20 9 4 4.1 5.1 -1.3 2.0 -0.1 2.3 1.6 1.9 1.8 -1.1<br />
Switzerland 186 27 11 5 4.5 4.5 0.5 1.5 0.2 2.4 1.5 1.5 2.4 0.0<br />
Syria 100 201 73 34 5.1 4.8 3.5 5.1 0.9 7.3 7.4 4.2 -0.1 3.5<br />
Tajikistan 61 140 94 76 2.0 1.3 9.5 - -13.0 6.3 5.7 4.0 0.5 2.2<br />
Tanzania 29 240 176 144 1.6 1.3 18.0 0.8 1.0 6.8 6.8 5.6 0.0 1.2<br />
TFYR Macedonia 108 177 69 30 4.7 5.2 2.4 - - 4.2 2.6 2.0 2.4 1.6<br />
Thailand 93 148 58 38 4.7 2.6 8.3 4.4 8.4 6.4 3.6 1.8 2.9 4.3<br />
Togo 38 267 175 125 2.1 2.1 14.5 1.7 -2.7 6.6 6.6 6.2 0.0 0.4<br />
Tonga 123 - - 23 - - 6.1 - 0.5 - - - - -<br />
126
…Table 8<br />
Under-5<br />
mortality<br />
rank<br />
Under-5<br />
mortality<br />
rate<br />
1960 1980 1996<br />
Average annual<br />
rate of reduction (%)<br />
required<br />
1960-80 1980-96 1996-2000<br />
GNP per capita<br />
average annual<br />
growth rate (%)<br />
1965-80 1985-95<br />
Total<br />
fertility rate<br />
1960 1980 1996<br />
Average annual<br />
rate of reduction (%)<br />
1960-80 1980-96<br />
Trinidad and Tobago 143 73 40 17 3.0 5.3 1.4 3.1 -1.7 5.1 3.3 2.2 2.2 2.5<br />
Tunisia 97 254 100 35 4.7 6.6 0.2 4.7 1.9 7.1 5.3 3.0 1.5 3.6<br />
Turkey 82 219 133 47 2.5 6.5 0.2 3.6 2.2 6.3 4.3 2.6 1.9 3.1<br />
Turkmenistan 58 150 95 78 2.3 1.2 9.5 - -9.6 6.4 5.1 3.7 1.1 2.0<br />
Tuvalu 74 - 77 56 - 2.0 10.2 - - - - - - -<br />
Uganda 30 224 180 141 1.1 1.5 17.5 -2.2 2.7 6.9 7.0 7.1 -0.1 -0.1<br />
Ukraine 121 53 28 24 3.2 1.0 10.1 - -9.2 2.2 2.0 1.5 0.5 1.8<br />
United Arab Emirates 139 240 64 18 6.6 7.9 2.9 - -2.8 6.9 5.4 3.6 1.2 2.5<br />
United Kingdom 164 27 14 7 3.1 4.6 4.0 2.0 1.4 2.7 1.8 1.7 2.0 0.4<br />
United States 163 30 15 8 3.3 3.8 5.4 1.8 1.3 3.5 1.8 2.0 3.3 -0.7<br />
Uruguay 127 56 43 22 1.3 4.1 8.4 2.5 3.1 2.9 2.7 2.3 0.4 1.0<br />
Uzbekistan 71 122 78 60 2.2 1.6 8.9 - -3.9 6.3 4.9 3.6 1.3 1.9<br />
Vanuatu 77 225 110 53 3.6 4.6 3.2 - -1.1 7.2 5.4 4.5 1.4 1.1<br />
Venezuela 115 70 42 28 2.6 2.6 12.2 2.3 0.5 6.6 4.2 3.1 2.3 1.9<br />
Viet Nam 85 219 105 44 3.7 5.4 4.7 - 4.2 6.1 5.1 3.1 0.9 3.1<br />
Yemen 50 340 198 105 2.7 4.0 10.1 - - 7.6 7.6 7.6 0.0 0.0<br />
Yugoslavia, Fed. Rep. 127 120 44 22 5.0 4.3 2.4 - - 2.7 2.3 1.8 0.8 1.5<br />
Zambia 13 213 149 202 1.8 -1.9 26.5 -1.2 -0.8 6.6 7.1 5.6 -0.4 1.5<br />
Zimbabwe 65 181 125 73 1.8 3.4 7.9 1.7 -0.6 7.5 6.4 4.8 0.8 1.8<br />
Regional summaries<br />
Sub-Saharan Africa 257 197 171 1.3 0.9 23.0 2.8 -0.9 6.6 6.6 5.9 0.0 0.7<br />
Middle East and North Africa 241 134 65 2.9 4.6 7.6 3.1 -0.9 7.1 6.2 4.5 0.7 2.0<br />
South Asia 239 181 119 1.4 2.6 13.4 1.4 2.8 6.1 5.1 3.5 0.9 2.4<br />
East Asia and Pacific 201 80 54 4.6 2.5 8.8 4.9 7.4 5.8 3.3 2.1 2.8 2.8<br />
Latin America and Caribbean 157 87 43 3.0 4.4 6.2 4.0 0.5 6.0 4.2 2.8 1.8 2.6<br />
CEE/CIS and Baltic States 101 56 36 2.9 2.8 5.2 - -3.3 3.0 2.5 1.9 0.9 1.9<br />
Industrialized countries 37 14 7 4.7 4.6 3.5 2.9 1.8 2.8 1.8 1.7 2.2 0.4<br />
Developing countries 216 136 97 2.3 2.1 14.5 3.7 2.9 6.0 4.4 3.2 1.6 2.0<br />
Least developed countries 280 214 171 1.4 1.4 22.3 -0.1 0.0 6.6 6.5 5.3 0.0 1.3<br />
World 192 121 88 2.3 2.0 14.2 3.1 1.9 5.0 3.8 2.9 1.4 1.7<br />
Countries in each region are listed on page 122.<br />
Definitions of the indicators<br />
Under-five mortality rate — Probability of dying between birth and exactly five years<br />
of age expressed per 1,000 live births.<br />
GNP per capita— Gross national product (GNP) is the sum of gross value added by all<br />
resident producers, plus any taxes that are not included in the valuation of output, plus net<br />
receipts of primary income from non-resident sources. GNP per capita is the gross national<br />
product, converted to United States dollars using the World Bank Atlas method, divided by<br />
the mid-year population.<br />
Main data sources<br />
Under-five mortality — UNICEF, United Nations Population Division and United Nations<br />
Statistics Division.<br />
GNP per capita — World Bank.<br />
Fertility — United Nations Population Division.<br />
Total fertility rate — The number of children that would be born per woman if she were<br />
to live to the end of her childbearing years and bear children at each age in accordance with<br />
prevailing age-specific fertility rates.<br />
Average annual rate of reduction required 1996-2000 — The average annual<br />
reduction rate required, for the period 1996-2000, to achieve an under-five mortality rate in<br />
the year 2000 of 70 per 1,000 live births or two thirds the 1990 rate, whichever is less.<br />
Notes - Data not available.<br />
x Indicates data that refer to years or periods other than those specified in the column heading, differ from the standard definition, or refer to only part of a country.<br />
127
Index<br />
A<br />
Adair, Linda S., 16<br />
adolescent pregnancy, 31<br />
advertising of infant formula, 47–48<br />
Africa, 10, 15<br />
Bamako Initiative in, 25–27, 65–66<br />
children with HIV in, 19, 73<br />
early marriage by girls in, 31<br />
economic resources in, 35<br />
sanitation and stunting in, 26<br />
underweight women in, 17<br />
agriculture, 82–83<br />
AIDS (acquired immune deficiency<br />
syndrome), 17, 31, 71, 73<br />
see also HIV<br />
anaemia, 10, 11, 15, 61–63, 72, 78<br />
maternal deaths from, 75<br />
programme to control, 66<br />
tests for, 82<br />
vitamin A supplements and, 12<br />
Arns, Zilda, 42<br />
Asia, 18<br />
B<br />
Baby-Friendly Hospital Initiative<br />
(BFHI), 48–51, 67, 77<br />
Bamako Initiative (Africa), 25–27, 65–66<br />
Bangladesh, 13, 29, 52–53, 56, 59, 60, 72<br />
Barker, David, 77<br />
Begum, Marium, 52<br />
beta-carotene, 12<br />
birthweight, 78<br />
see also low-birthweight babies<br />
Black, Robert, 72<br />
Bolivia, 64, 65<br />
Bosnia and Herzegovina, 80<br />
brain, development of, 21–23, 53<br />
Brazil, 17, 42–43, 49, 64<br />
breastfeeding, 28–29, 77<br />
Baby-Friendly Hospital Initiative (BFHI)<br />
and, 48–51<br />
complementary feeding and, 49–51<br />
during crises, 80<br />
HIV and, 30, 73<br />
IQ scores and, 13<br />
nutrition and, 22–23<br />
stimulation in, 29<br />
vitamin A and, 60, 72<br />
C<br />
calcium, 14, 76<br />
Canada, 54–57, 68<br />
Caribbean, 18<br />
caring practices, 27–31<br />
carotene, 61<br />
Cebu (Philippines), 16<br />
Ceesay, Sana, 32<br />
Central Asian republics, 17<br />
Central Europe, 17<br />
child mortality<br />
breastfeeding and, 22<br />
Convention on the Rights of the Child on, 21<br />
from malaria, 74<br />
in Oman, 40<br />
linked to malnutrition, 9, 11<br />
vitamin A supplements to reduce, 72<br />
Child Pastorate (Brazil), 42–43<br />
Child Survival and Development (CSD)<br />
Programme (Tanzania), 41–43, 51, 67<br />
Chile, 50, 65<br />
China, 50–51<br />
chronic diseases, 10, 13, 77–78<br />
cognitive development, 11, 16, 29<br />
community involvement, 41–45, 69, 85<br />
in Bangladesh, 52–53<br />
in Niger programme, 46–47<br />
in Oman, Triple A approach, 40<br />
in South African health services, 86<br />
through schools and education, 66<br />
Consultative Group on International Agricultural<br />
Research, 83<br />
Convention on the Elimination of All Forms of<br />
Discrimination against Women (1979), 21<br />
Convention on the Rights of the Child (1989), 20,<br />
21, 69<br />
cretinism, 15, 54, 56<br />
Cuba, 50<br />
D<br />
dark adaptometry, 81<br />
David, Jorge, 65<br />
deaths<br />
chronic disease as cause of, 77<br />
from malaria, 74<br />
from malnutrition, 9, 78–79<br />
of mothers, 11, 12, 71–76<br />
see also child mortality<br />
Declaration of the Rights of the Child<br />
(1924; 1959), 19–21<br />
Declaration on the Right to Development<br />
(1986), 20<br />
development (physical), 11, 21–22, 26<br />
diabetes, 77, 78<br />
diarrhoea, 22, 28, 42, 58, 65, 72<br />
diarrhoeal dehydration, 11<br />
diet<br />
boosting vitamin A in, 60–61<br />
enrichment of, 82–83<br />
see also nutrition<br />
discrimination against women, 11, 29, 39<br />
disease, 10, 77–78<br />
E<br />
Eastern Europe, 17<br />
eclampsia, 75<br />
economic growth, nutrition and, 17, 19, 37–39<br />
economic resources, 34–35<br />
Ecuador, 73<br />
education, 15, 66<br />
eggs, 61<br />
Egypt, 72<br />
F<br />
F-100 milk, 79<br />
Fall, Caroline, 78<br />
families, impact of malnutrition on, 13<br />
feeding of children, 28<br />
flour, iron supplementation in, 61–65<br />
foetal development, 21–22<br />
folate deficiency, 10, 76, 83<br />
foods<br />
during crises, 80<br />
enrichment of, 64–65, 82–83<br />
household food security and, 23–25, 37–39<br />
iron supplementation in, 61–63<br />
production, 68<br />
vitamin A in, 60–63<br />
fortification of foods, 59–65, 82<br />
G<br />
Gabon, 49<br />
Gambia, 31, 32<br />
gardening, 59–61<br />
Georgia (republic of), 15<br />
girls, early marriage by, 31<br />
government policies, 69, 87<br />
growth (physical)<br />
iodine needed for, 53<br />
monitoring of, 41, 45–47<br />
stunting and, 15, 16, 26<br />
Triple A approach to, in Oman, 40<br />
see also development<br />
growth failure, 14, 34<br />
Guatemala, 15, 60, 64, 75<br />
Guinea, 66<br />
H<br />
Haiti, 60, 80<br />
Health and Nutrition District Support (HANDS)<br />
project (Tanzania), 44–45<br />
health of children, protection of, 28–29<br />
health services, 25–27, 63–66<br />
during crises, 80–81<br />
in South Africa, 86–87<br />
heart disease, 77<br />
Heavily Indebted Poor Countries (HIPC)<br />
Debt Initiative, 35<br />
128
height, 14–16<br />
see also stunting<br />
Helen Keller International, 60–62<br />
helminth (worm) infections, 84<br />
HIV (human immunodeficiency virus), 19, 23, 30,<br />
31, 71, 73–75<br />
hookworms, 63, 75, 84<br />
hospitals, Baby-Friendly Hospital Initiative<br />
(BFHI) and, 48–51, 77<br />
household food security, 23–25, 37–39<br />
hygiene, 27, 65<br />
I<br />
immune system<br />
AIDS and, 31, 71, 73, 75<br />
malaria and, 74<br />
nutritionally acquired immune deficiency<br />
and, 71–73<br />
zinc and, 72, 77<br />
immunizations, 28, 59, 63<br />
India, 59, 78, 85<br />
Indonesia, 31, 37, 57, 61–64<br />
infant formula, 47–48, 80<br />
infant mortality, see child mortality<br />
infants<br />
Baby-Friendly Hospital Initiative (BFHI)<br />
and, 48–51<br />
breastfeeding of, 22–23, 47–48, 77<br />
HIV transferred to, 30<br />
infections, 19, 71<br />
intellectual development, 16–19<br />
see also cognitive development<br />
International Code of Marketing of Breastmilk<br />
Substitutes (1981), 48<br />
International Council for Control of Iodine<br />
Deficiency Disorders (ICCIDD), 54<br />
International Covenant on Economic, Social<br />
and Cultural Rights (1966), 20<br />
international human rights instruments, 20<br />
International Monetary Fund (IMF), 35<br />
intestinal worms, 83–85<br />
iodine, 14, 64, 79<br />
iodine deficiency disorders (IDD), 10, 14, 15,<br />
51–58, 79<br />
eliminated in Bolivia, 65<br />
in pregnant women, 76<br />
iodized salt for, 17<br />
testing for, 81–82<br />
IQ scores, 11–13, 15, 22–23<br />
Iran, 51<br />
Iringa (Tanzania), 45<br />
iron, 78<br />
iron deficiency anaemia, 11, 14, 15, 61–63,<br />
66, 72, 78<br />
iron supplements, 61<br />
J<br />
Jebb, Eglantyne, 20<br />
K<br />
Kazakstan, 17<br />
Kenya, 73, 84<br />
Kiwanis International, 54, 56–57<br />
kwashiorkor, 14<br />
L<br />
Lao People’s Democratic Republic, 66<br />
Latin America, 18<br />
legislation, on food fortification, 64<br />
low-birthweight babies, 22, 42<br />
adult chronic diseases and, 77–78<br />
IQ scores of, 11<br />
nutritional intervention and, 32–33<br />
M<br />
malaria, 10, 63, 66, 72, 74–75, 83<br />
Malawi, 73<br />
Malaysia, 61<br />
malnutrition, 9–17, 23–35, 83–87<br />
Child Pastorate programme on, 42–43<br />
Health and Nutrition District Support (Hands)<br />
project (Tanzania) on, 44–45<br />
in Bangladesh, 52–53<br />
in Thailand, 45<br />
intellectual development linked to, 16<br />
measurement of, 14, 79–82<br />
Niger programme on, 46–47<br />
nutritionally acquired immune deficiency<br />
and, 71–73<br />
reducing deaths in emergency, 78–79<br />
research in, 68<br />
reversal of effects of, 17–19<br />
marasmus (severe wasting), 14<br />
Martorell, Reynaldo, 26<br />
maternal height, 75<br />
maternal mortality, 11–13, 75–76<br />
measles, 63<br />
vitamin A and, 58, 72<br />
Mebendazole (drug), 84<br />
mental impairments, 53, 54, 56<br />
Micronutrient Initiative, 54, 61, 62<br />
micronutrients, 10, 14<br />
immune system and, 71–73<br />
in foods, 64–65, 82–83<br />
maternal deaths and, 76<br />
Middle East, 18<br />
milk, 79<br />
minerals, 14<br />
miscarriages, 54<br />
Moldova, Republic of, 49<br />
mothers, 29–31<br />
breastfeeding and health of, 77<br />
HIV transferred to children from, 73<br />
vitamin A supplementation for, 60<br />
N<br />
Nepal, 12–13<br />
newborns<br />
breastfeeding of, 47–51<br />
head circumference, 31<br />
low-birthweight babies, 22, 32–33, 78<br />
see also breastfeeding<br />
Niger, 31, 45–47, 61, 66<br />
night-blindness, 12, 58–59<br />
nutrition, 17–19, 20<br />
action for improvement in, 83–87<br />
adult chronic disease and maternal, 78<br />
AIDS and, 73<br />
as right, 19–21, 68–69<br />
boosting vitamin A in diet, 60–61<br />
breastfeeding and, 22–23, 47–48<br />
child development and, 21–22<br />
combined approach to, 67–68<br />
during crises, 80–81<br />
economic growth and improved, 37–39<br />
enrichment of foods for, 64–65, 82–83<br />
for pregnant women, 21, 29, 32–33<br />
immune system and, 71–73<br />
iodine deficiency disorders and, 51–58<br />
maternal deaths reduced by, 75–76<br />
social-sector spending and, 39<br />
status of women and, 39<br />
Tanzanian programmes on, 41–45<br />
Triple A approach to, in Oman, 40<br />
nutritionally acquired immune deficiency, 71–73<br />
O<br />
obstructed labour, 15, 75<br />
Oman, 40, 64<br />
oral rehydration salts (ORS), 79<br />
oral rehydration therapy (ORT), 65<br />
P<br />
Pakistan, 39<br />
Panama, 49<br />
Papua New Guinea, 74<br />
parasite-induced anaemia, 66<br />
Peru, 72, 75<br />
Philippines, 16, 60, 64<br />
poverty, 10, 34–35<br />
as cause of malnutrition, 33–35<br />
chronic diseases and, 77<br />
household food security and, 25<br />
in Latin America and Caribbean, 19<br />
in South Africa, 86<br />
in United States, 15–17<br />
129
pregnant women<br />
in Bangladesh, malnutrition among, 52<br />
care received by, 31<br />
consequences of iodine deficiency disorders<br />
in, 54<br />
deaths of, 75–76<br />
foetal development and weight gain by, 22<br />
impact of malnutrition on, 11<br />
iron deficiency anaemia in, 61, 78<br />
malaria among, 10<br />
nutrition for, 21, 29, 32–33<br />
vitamin A supplements for, 12–13<br />
with HIV, 73<br />
prenatal care, 12–13<br />
preventive health care, 27<br />
protein-energy malnutrition (PEM), 14<br />
in Bangladesh, 52<br />
R<br />
Rio de Janeiro (Brazil), 42<br />
roundworms, 84<br />
rural areas, 25<br />
Russian Federation, 17<br />
S<br />
salt, iodized, 17, 53, 54, 55, 56, 57, 64, 67, 79, 82<br />
sanitation, 26, 27, 65<br />
schistosomes, 84<br />
Senegal, 31<br />
Shankar, Anuraj, 74<br />
social services, 39<br />
Solomons, Noel, 26<br />
South Africa, 64, 86–87<br />
South Asia, 10, 17, 26, 35, 39<br />
South-East Asia, 17<br />
Sri Lanka, 39<br />
stunting, 15, 16, 26, 75<br />
sanitation and, 26<br />
sub-Saharan Africa, see Africa<br />
sugar, 60<br />
Sullivan, Kathleen, 57<br />
T<br />
Tanzania, 41–45, 51, 66, 67<br />
Thailand, 39, 45–47<br />
Triple A approach, 40, 41, 53, 67, 80<br />
20-20 Initiative, 39<br />
U<br />
UNICEF<br />
Baby-Friendly Hospital Initiative (BFHI) and, 50<br />
Child Pastorate (Brazil) and, 43<br />
iron supplements supplied by, 61<br />
on food fortified with vitamin A, 64<br />
on malaria control, 66<br />
salt iodization and, 54<br />
20-20 Initiative of, 39<br />
vitamin A supplementation by, 59, 62<br />
United Kingdom, 17<br />
United Nations, 20, 81<br />
United Nations Development Programme<br />
(UNDP), 25<br />
United States, 15–17, 49, 76<br />
Universal Declaration of Human Rights (1948), 20<br />
urban areas, 25, 78<br />
V<br />
Venezuela, 63–65<br />
Viet Nam, 31<br />
vitamin A, 71–73, 76<br />
HIV and, 19, 73, 75<br />
in resistance to malaria, 74–75<br />
measurement of, 81<br />
vitamin A deficiency, 10–14, 46, 58–59, 72–73, 76<br />
HIV and, 19, 73, 75<br />
improving diet for, 60–61<br />
in Indonesia, 61–63<br />
vitamin A supplements, 12–13, 29, 58–60, 62–63,<br />
67, 76<br />
child deaths reduced by, 59–60, 72<br />
during crises, 80<br />
food fortified with, 64<br />
maternal deaths reduced by, 12–13<br />
vitamin B, 83<br />
vitamin D, 14<br />
vitamin D deficiency, 10, 14<br />
vitamin and mineral deficiencies, 13, 14<br />
W<br />
water, 25, 26, 65<br />
weight<br />
gained by pregnant women, 22, 31<br />
in assessment of malnutrition, 14<br />
in Tanzanian child nutrition programme, 41<br />
severe underweight in children, 15<br />
whipworms, 84<br />
Wildman, Bob, 56–57<br />
women<br />
anaemia among, 10, 11, 61, 78<br />
care and, 27–28<br />
discrimination against, 11, 29, 39<br />
empowerment of, 37<br />
household food security and, 25<br />
in Niger, 46–47<br />
in Tanzanian child nutrition programme, 43<br />
malnutrition and, 17<br />
nutrition and status of, 39<br />
pregnancy-related deaths of, 12, 75–76<br />
right to nutrition of, 21<br />
stunting among, 15<br />
see also pregnant women<br />
work, during pregnancy, 31<br />
World Alliance for Breastfeeding Action<br />
(WABA), 49<br />
World Bank, 35<br />
World Declaration and Plan of Action on the<br />
Survival, Protection and Development of<br />
Children (1990), 20<br />
World Health Assembly, 48<br />
World Health Organization, 11, 15, 48, 51, 54, 63,<br />
66, 71, 75, 79<br />
World Summit for Children (1990), 14, 20, 21, 51, 53<br />
World Vision of South Africa, 86<br />
worms, intestinal, 83–85<br />
Y<br />
Yajnik, Ranjan, 78<br />
Z<br />
Zidovudine (drug), 73<br />
Zimbabwe, 39<br />
zinc, 72–75, 77<br />
zinc deficiency, 72, 76, 77<br />
130
Glossary<br />
ACC/SCN<br />
Administrative Committee on Coordination/<br />
Subcommittee on Nutrition<br />
AIDS<br />
acquired immune deficiency syndrome<br />
ALIM<br />
Latin American Millers Association<br />
ARI<br />
acute respiratory infections<br />
BFHI<br />
Baby-Friendly Hospital Initiative<br />
BRAC<br />
Bangladesh Rural Advancement<br />
Committee<br />
CSD<br />
Child Survival and Development<br />
Programme (Tanzania)<br />
ECLAC<br />
Economic Commission for Latin America<br />
and the Caribbean<br />
FAO<br />
Food and Agriculture Organization of the<br />
United Nations<br />
GDP<br />
gross domestic product<br />
GMP<br />
growth monitoring and promotion<br />
GNP<br />
gross national product<br />
HANDS<br />
Health and Nutrition District Support<br />
(Tanzania)<br />
HIV<br />
human immunodeficiency virus<br />
ICCIDD<br />
International Council for the Control of<br />
Iodine Deficiency Disorders<br />
IDD<br />
iodine deficiency disorders<br />
IFAD<br />
International Fund for Agricultural<br />
Development<br />
IMF<br />
International Monetary Fund<br />
INCAP<br />
Institute of Nutrition of Central America<br />
and Panama<br />
IQ<br />
intelligence quotient<br />
MCR<br />
Medical Research Council (UK)<br />
MI<br />
Micronutrient Initiative (Canada)<br />
NCHS<br />
National Center for Health Statistics<br />
NGO<br />
non-governmental organization<br />
ODA<br />
official development assistance<br />
ORS<br />
oral rehydration salts<br />
ORT<br />
oral rehydration therapy<br />
PEM<br />
protein-energy malnutrition<br />
U5MR<br />
under-five mortality rate<br />
UN<br />
United Nations<br />
UNAIDS<br />
Joint United Nations Programme on<br />
HIV/AIDS<br />
UNDP<br />
United Nations Development Programme<br />
UNHCR<br />
Office of the United Nations High<br />
Commissioner for Refugees<br />
UNICEF<br />
United Nations Children’s Fund<br />
USAID<br />
United States Agency for International<br />
Development<br />
WABA<br />
World Alliance for Breastfeeding Action<br />
WFP<br />
World Food Programme<br />
WHO<br />
World Health Organization<br />
Note: All dollars are US dollars.<br />
131
UNICEF Headquarters<br />
3 UN Plaza<br />
New York, NY 10017, USA<br />
UNICEF Regional Office for Europe<br />
Palais des Nations<br />
CH-1211 Geneva 10, Switzerland<br />
UNICEF Regional Office for<br />
Central and Eastern Europe,<br />
Commonwealth of Independent States,<br />
and Baltic States<br />
Palais des Nations<br />
CH-1211 Geneva 10, Switzerland<br />
UNICEF Regional Office for<br />
Eastern and Southern Africa<br />
P.O. Box 44145<br />
Nairobi, Kenya<br />
UNICEF Regional Office for<br />
West and Central Africa<br />
P.O. Box 443<br />
Abidjan 04, Côte d’Ivoire<br />
UNICEF Regional Office for<br />
East Asia and the Pacific<br />
P.O. Box 2-154<br />
Bangkok 10200, Thailand<br />
UNICEF Regional Office for the<br />
Middle East and North Africa<br />
P.O. Box 811721<br />
11181 Amman, Jordan<br />
UNICEF Regional Office<br />
for South Asia<br />
P.O. Box 5815<br />
Lekhnath Marg<br />
Kathmandu, Nepal<br />
UNICEF Office for Japan<br />
UN Headquarters Building<br />
8th floor<br />
53-70, Jingumae 5-chome<br />
Shibuya-ku<br />
Tokyo 150, Japan<br />
UNICEF Regional Office for the<br />
Americas and the Caribbean<br />
Apartado 7555<br />
Santa Fe de Bogotá, Colombia
OXFORD UNIVERSITY PRESS<br />
£6.95 net in UK $12.95 in USA<br />
ISBN 0–19–829401-8<br />
Malnutrition is largely a silent and invisible emergency, exacting a terrible toll<br />
on children and their families. The result of multiple causes, including a lack<br />
of food, common and preventable infections, inadequate care and unsafe water,<br />
it plays a role in more than half of the nearly 12 million deaths each year of<br />
children under five in developing countries, a proportion unmatched since the<br />
Black Death ravaged Europe in the 14th century. Malnutrition blunts intellects<br />
and saps the productivity and potential of entire societies. Poverty, one of the<br />
causes of malnutrition, is also a consequence, a tragic bequest by malnourished<br />
parents to the next generation.<br />
The State of the World’s Children <strong>1998</strong> report details the scale of the<br />
loss and the steps being taken to stem it. Sentinels of progress are lighting the<br />
way: Nearly 60 per cent of the world’s salt is now iodized, and millions of children<br />
every year are spared mental retardation as a result. Vitamin A supplementation<br />
is helping bolster disease resistance in children and may soon<br />
become an important measure in helping reduce maternal deaths around the<br />
world. Communities are working together to identify their problems, decide on<br />
their options and take action, with women emerging to play leadership roles<br />
that spark numerous other changes in people’s lives.<br />
Children have the right, recognized in international law, to good nutrition.<br />
The world has the obligation to protect that right, building on both the<br />
great experience gained and the scientific knowledge achieved. Action is both<br />
possible and imperative.