Modelling Coastal Vulnerability and Adaptation to Sea Level Rise
Modelling Coastal Vulnerability and Adaptation to Sea Level Rise
Modelling Coastal Vulnerability and Adaptation to Sea Level Rise

You also want an ePaper? Increase the reach of your titles
YUMPU automatically turns print PDFs into web optimized ePapers that Google loves.
International Environmental <strong>Modelling</strong> <strong>and</strong> Software Society (iEMSs)<br />
2012 International Congress on Environmental <strong>Modelling</strong> <strong>and</strong> Software<br />
Managing Resources of a Limited Planet, Sixth Biennial Meeting, Leipzig, Germany<br />
R. Seppelt, A.A. Voinov, S. Lange, D. Bankamp (Eds.)<br />
http://www.iemss.org/society/index.php/iemss-2012-proceedings<br />
<strong>Modelling</strong> <strong>Coastal</strong> <strong>Vulnerability</strong> <strong>and</strong><br />
<strong>Adaptation</strong> <strong>to</strong> <strong>Sea</strong> <strong>Level</strong> <strong>Rise</strong><br />
Oz Sahin a,b <strong>and</strong> Sherif Mohamed a<br />
a<br />
Centre for Infrastructure Engineering <strong>and</strong> Management, Griffith School of<br />
Engineering, Griffith University, QLD, Australia (o.sahin@griffith.edu.au)<br />
b Griffith Climate Change Response Program, QLD, Australia<br />
Abstract: <strong>Coastal</strong> regions are highly vulnerable <strong>to</strong> sea-level rise (SLR) therefore<br />
developing <strong>and</strong> implementing effective adaptation alternatives is crucial for their<br />
future development. However, there is uncertainty in the timing, duration, spatial<br />
location <strong>and</strong> extent of SLR <strong>and</strong> s<strong>to</strong>rms. The complexity that arises from climate,<br />
coastal systems <strong>and</strong> their interactions in space <strong>and</strong> time can easily become<br />
overwhelming for decision makers <strong>to</strong> investigate the aspects of adaptation<br />
alternatives thoroughly. Dilemmas confronting decision makers are: how <strong>to</strong> adapt<br />
<strong>and</strong> when <strong>to</strong> adapt <strong>to</strong> SLR?<br />
Considering the complexity <strong>and</strong> dynamic nature of coastal systems interacting <strong>and</strong><br />
changing over time, this paper introduces a new Spatial Temporal Decision (STD)<br />
framework <strong>to</strong> assess coastal vulnerability, <strong>and</strong> the adaptation alternatives <strong>to</strong> SLR.<br />
The STM is based upon a combination of: System Dynamics (SD) modelling;<br />
Geographical Information Systems (GIS) modelling; <strong>and</strong> multi-criteria analyses of<br />
stakeholders’ views using the Analytical Hierarchy Process (AHP).<br />
The results of the vulnerability assessment indicate that, at the end of a 100 year<br />
simulation period, approximately 6 % of the l<strong>and</strong>scape in the study area will be<br />
gradually inundated over time, with 0.5 cm SLR per year. However, this situation<br />
dramatically changes with scenarios 2 <strong>and</strong> 3, which represent 1 cm <strong>and</strong> 1.5 cm<br />
SLR per year. Indeed, the percentage of the vulnerable area leapt <strong>to</strong> about 34 % for<br />
Scenario 2, <strong>and</strong> 56 % for Scenario 3.<br />
Using the information obtained from vulnerability assessments, three stakeholder<br />
groups (Politicians, Technical Experts <strong>and</strong> Residents) were consulted <strong>to</strong> determine<br />
the goal, criteria <strong>and</strong> adaptation alternatives required for the AHP analysis.<br />
Analyses of survey data reveal that across the three stakeholder groups,<br />
Effectiveness <strong>and</strong> Sustainability are the criteria of highest priority.<br />
Keywords: Decision Making; Dynamic <strong>Modelling</strong>; <strong>Sea</strong> <strong>Level</strong> <strong>Rise</strong>; <strong>Vulnerability</strong>.<br />
1 INTRODUCTION<br />
There is overwhelming scientific consensus over the causes <strong>and</strong> impacts of climate<br />
change (IPCC, 2007). <strong>Sea</strong> level rise (SLR) is one of the most recognized possible<br />
impacts of changing climate. <strong>Coastal</strong> areas are economically productive <strong>and</strong> three<br />
times more densely populated than the global average (Small <strong>and</strong> Nicholls, 2003).<br />
Clearly, while communities have benefitted from the many advantage of living in<br />
these areas, inevitably they also face the threat of natural disasters <strong>and</strong> specifically<br />
from SLR via permanent inundation of low-lying regions, inl<strong>and</strong> extension of<br />
episodic flooding, increased beach erosion <strong>and</strong> saline intrusion of aquifers (McLean<br />
et al., 2001). <strong>Coastal</strong> communities have been adapting <strong>to</strong> changing conditions<br />
throughout his<strong>to</strong>ry. However, faced with increased threats due <strong>to</strong> SLR, coastal<br />
communities must act faster <strong>to</strong> develop more effective management policies.<br />
Moreover, the impacts of SLR are not expected <strong>to</strong> be spatially uniform across the
Sahin <strong>and</strong> Mohamed/ <strong>Modelling</strong> <strong>Coastal</strong> <strong>Vulnerability</strong> <strong>and</strong> <strong>Adaptation</strong> <strong>to</strong> <strong>Sea</strong> <strong>Level</strong> <strong>Rise</strong><br />
world. It is therefore essential for decision makers (DM) <strong>to</strong> consider the dynamic<br />
<strong>and</strong> spatial characteristics of these changes in assessing the impacts of SLR when<br />
making decisions about the future. There is a range of analytical <strong>to</strong>ols are available<br />
<strong>to</strong> improve decision makers’ (DM) ability <strong>to</strong> underst<strong>and</strong> <strong>and</strong> evaluate environmental<br />
management problems such as simulation models, GIS, experts systems, etc.<br />
However, although these <strong>to</strong>ols provide invaluable information for decision making,<br />
each <strong>to</strong>ol addresses only one aspect of a management problem. Therefore,<br />
effective decision making, in a dynamic complex environment, requires the<br />
expansion of the mental modelling boundaries <strong>and</strong> the development of additional<br />
<strong>to</strong>ols <strong>to</strong> help DMs better underst<strong>and</strong> how complex systems behave. Thus, DMs<br />
need <strong>to</strong> integrate each <strong>to</strong>ols’ analytical results in<strong>to</strong> a rational choice about what <strong>to</strong><br />
do, where <strong>to</strong> do it, <strong>and</strong> when <strong>to</strong> do it (Schmoldt, 2001). Considering the complex<br />
<strong>and</strong> dynamic nature of coastal systems interacting <strong>and</strong> changing over time, this<br />
paper introduces a Spatial Temporal Decision (STD) framework <strong>to</strong> assess coastal<br />
vulnerability, <strong>and</strong> the adaptation alternatives <strong>to</strong> SLR.<br />
2 METHODOLOGY<br />
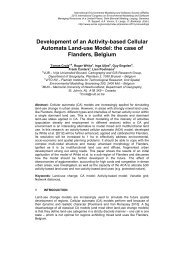
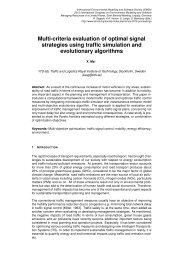
The STD approach takes in<strong>to</strong> account five dimensions of the decision process in<br />
coastal dynamics (Figure 1). Space (x,y,z) <strong>and</strong> time (t) constitute the first four<br />
dimensions, <strong>and</strong> provide a common base where all natural <strong>and</strong> human processes<br />
occur. This approach is crucial in generating adequate information from which DMs<br />
can devise realistic adaptation strategies. For this reason, it is essential <strong>to</strong><br />
incorporate the first four dimensions in<strong>to</strong> the fifth dimension, the element of human<br />
decision making (h). Thus, developing STD is based upon a combination of:<br />
System Dynamics (SD) modelling; Geographical Information Systems (GIS)<br />
modelling; <strong>and</strong> multi-criteria analyses of stakeholders’ views using the Analytical<br />
Hierarchy Process (AHP). As illustrated in Figure 1, the cyclic STD process<br />
consists of: 1) Identification of the problem; 2) <strong>Vulnerability</strong> assessment by using<br />
Dynamic Spatial<br />
Model (DSM),<br />
which combines a<br />
spatial model (GIS)<br />
<strong>and</strong> a temporal<br />
model (SD); 3)<br />
Evaluating potential<br />
adaptation<br />
strategies by using<br />
an MCDA<br />
approach, based<br />
on information<br />
obtained from the<br />
previous step.<br />
Figure 1. Five dimensional STD framework.<br />
2.1 Model Development<br />
To model <strong>and</strong> simulate changes in coastal zones, a number of researchers have<br />
proposed the use of a versatile approach, which considers many aspects of the<br />
problem by combining GIS with SD (Grossmann <strong>and</strong> Eberhardt, 1992, Ruth <strong>and</strong><br />
Pieper, 1994, Ahmad <strong>and</strong> Simonovic, 2004, Gharib, 2008, Zhang, 2008). GIS <strong>and</strong><br />
SD originated in different domains of expertise. In the proposed approach, while<br />
GIS h<strong>and</strong>les spatial data, dynamic modelling processes the dynamics of the<br />
complex system, revealing its causal structure <strong>and</strong> the relations of the system<br />
components. The DSM consists of three components: SD (temporal) model, GIS<br />
(spatial) model, <strong>and</strong> the data conver<strong>to</strong>r. The DSM captures the changes in time <strong>and</strong><br />
space by obtaining <strong>and</strong> processing the temporal data from the SD <strong>and</strong> the spatial<br />
data from the GIS by exchanging data through the data conver<strong>to</strong>r.
Sahin <strong>and</strong> Mohamed/ <strong>Modelling</strong> <strong>Coastal</strong> <strong>Vulnerability</strong> <strong>and</strong> <strong>Adaptation</strong> <strong>to</strong> <strong>Sea</strong> <strong>Level</strong> <strong>Rise</strong><br />
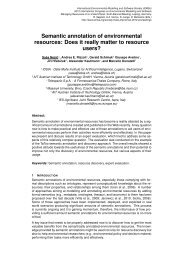
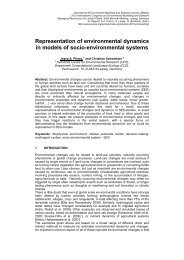
Temporal Model Component: When building the temporal model, the Vensim DSS<br />
(Decision Support System) software was chosen because of its flexibility when<br />
representing continuous or discrete time, a graphical interface, or performing<br />
causal tracing, optimization, <strong>and</strong> sensitivity analysis (Ventana Systems, 2009).<br />
Figure 2 shows the model structure containing three state variables: <strong>Sea</strong> <strong>Level</strong>,<br />
Elevation, <strong>and</strong> Cell Cover. The <strong>Sea</strong> level is the main driver causing inundation <strong>and</strong>,<br />
therefore, puts people <strong>and</strong> properties at risk. Elevation defines changes in cell<br />
elevation. Cell Cover defines l<strong>and</strong> use type which change over time.<br />
<strong>Rise</strong> Rate<br />
Initial <strong>Sea</strong> <strong>Level</strong><br />
<strong>Sea</strong> <strong>Level</strong><br />
<strong>Rise</strong><br />
<br />
<br />
<br />
<br />
<br />
<br />
Increase<br />
Initial Cover<br />
Elevation<br />
Decrease<br />
<br />
Cell Elevation<br />
<br />
<br />
<br />
<br />
Change<br />
<br />
<br />
Cell Cover<br />
Change Previous<br />
<br />
<br />
Initial Elevation<br />
<br />
Figure 2. Inundation model based on cell elevation <strong>and</strong> cover types.<br />
To capture the fundamental dynamic processes of inundation the area under<br />
consideration is subdivided in<strong>to</strong> a cellular (i x j) grid <strong>to</strong> simulate how flood water<br />
spreads between adjacent cells. Each cell represents a specific area corresponding<br />
<strong>to</strong> one of four cover types: <strong>Sea</strong>, Waterways, Pond, or L<strong>and</strong>. Based on the following<br />
equation, the flood water diffusion from one cell <strong>to</strong> another is predicted:<br />
(1)<br />
Where, F is, either flooded (1) or not flooded (0); CE is the cell elevation; CT (x i,j ) is<br />
the cover type, either inundated L or not inundated W; CT (x n,m ) is the adjacent cells<br />
cover types, either L l<strong>and</strong> (or other cover types other than sea) or W sea (or<br />
became sea due <strong>to</strong> inundation); (n,m) refers <strong>to</strong> all adjacent cells <strong>to</strong> i,j (i.e.: i,j-1,<br />
i,j+1, i+1,j <strong>and</strong> i-1,j).<br />
For coastal areas, along with SLR rate, Elevation <strong>and</strong> Cell Cover are the most<br />
critical fac<strong>to</strong>rs in assessing the potential impacts. At each simulation step, as the<br />
sea level rises, the elevation of a cell is determined by its condition at the previous<br />
time step, its border conditions with its four neighbours, <strong>and</strong> the cover type of its<br />
neighbours. The elevation of a cell is determined by adjusting the elevation, at<br />
previous time steps, by the flow-in (increase) <strong>and</strong> the flow-out (decrease) of the<br />
cell, according <strong>to</strong> the properties of the adjacent cells. The Elevation is the integral of<br />
the net flow of Increase <strong>and</strong> Decrease calculated by the following equation:<br />
(2)<br />
Where, E t (x,y): Cell elevation at location (x,y) at a given time; E 0 (x,y): Initial cell<br />
elevation at location (x,y); I t (x,y): Rate of elevation increase at location (x,y); D t<br />
(x,y): Rate of elevation decrease at location (x,y).<br />
The changes in cell elevation occur when only the Cover Type of a cell is L<strong>and</strong>,<br />
Waterways, or Pond, at time step t n , <strong>and</strong> it is transformed in<strong>to</strong> <strong>Sea</strong> at the next time
Sahin <strong>and</strong> Mohamed/ <strong>Modelling</strong> <strong>Coastal</strong> <strong>Vulnerability</strong> <strong>and</strong> <strong>Adaptation</strong> <strong>to</strong> <strong>Sea</strong> <strong>Level</strong> <strong>Rise</strong><br />
step, t n+1 . Here, the cell is assumed <strong>to</strong> be inundated from the SLR <strong>and</strong>, therefore,<br />
the elevation of the cell is updated, <strong>and</strong> said <strong>to</strong> be equal <strong>to</strong> the <strong>Sea</strong> <strong>Level</strong> at the<br />
time period t n+1 . As the model runs, the state of the each cell is assessed<br />
simultaneously. This is necessary <strong>to</strong> assign only one Cover Type value <strong>to</strong> the cell<br />
for each time step. For example, if the Change alters the Cover Type of a cell from<br />
L<strong>and</strong> <strong>to</strong> Water at time step (t 1 ), then Change Previous discards the previous cover<br />
type value (L<strong>and</strong>) from the cell. The Cell Cover is determined based on the<br />
following equation:<br />
(3)<br />
Where, CT t (x,y): Cell Cover type at location (x,y) at a given time; CT 0 (x,y): Initial<br />
Cell Cover type at location (x,y); C t (x,y): Rate of cell cover type change at location<br />
(x,y); CP t (x,y): Rate of previous cell cover type change at location (x,y)<br />
Spatial Model Component: GIS, ArcInfo 9.3.1 (ESRI, 2009), is a key <strong>to</strong>ol used in<br />
the spatial model construction, which is later connected <strong>to</strong> the temporal model<br />
through the data conver<strong>to</strong>r. Since SD can easily use array variables for data<br />
manipulation, aggregation, <strong>and</strong> analysis, the Raster data model using a regular grid<br />
<strong>to</strong> cover the space is used. A variety of data from different sources was required as<br />
inputs <strong>to</strong> the spatial model. The spatial data on l<strong>and</strong> cover, elevation, Digital<br />
Cadastral Database DCDB, study area boundaries <strong>and</strong> waterways were acquired<br />
from public sources <strong>and</strong> processed in<strong>to</strong> GIS format. To obtain accurate result, high<br />
resolution elevation data (5 m DEM with 0.1 m vertical accuracy) was used. All the<br />
data layers were converted <strong>to</strong> raster format, with a resolution of 5 x 5 m cell size <strong>to</strong><br />
match the DEM data. The attribute assignments were based on the centroid of the<br />
cell. Australian Bureau of Statistic (ABS) 2001 data on dwellings, <strong>and</strong> the Digital<br />
Cadastral Database (DCDB), represented, spatially, every parcel of l<strong>and</strong> <strong>and</strong><br />
provided l<strong>and</strong> related information that was converted <strong>to</strong> a raster format.<br />
Data Conver<strong>to</strong>r: The data converter au<strong>to</strong>mates the format transition between the<br />
ArcGIS <strong>and</strong> SD data formats. First, it converts the ArcGIS text (ASCII) files <strong>to</strong> SD<br />
text files (.cin), then it converts the files from the SD .tab files back <strong>to</strong> the ArcGIS<br />
.txt files. All code for the data converter was written in C++ under Visual Studio<br />
2008, using the Microsoft.NET framework version 2.0.<br />
Decision Model: Decision making is a process of selecting from among several<br />
alternatives, based on various (usually conflicting) criteria. Information on priority<br />
alternatives is vital in aiding DMs <strong>to</strong> design more effective adaptation options <strong>and</strong><br />
better management plans <strong>to</strong> reduce the adverse effects of SLR. The current study<br />
uses the MCDA technique because it is the most suitable approach by which <strong>to</strong><br />
identify the priority of adaptation alternatives. Several multi-criteria decision aid<br />
techniques are suitable for comparing multiple criteria, simultaneously, <strong>and</strong> for<br />
providing a solution <strong>to</strong> a given problem. While there are no better or worse<br />
techniques, some techniques are better suited <strong>to</strong> a particular decision problem<br />
(Haralambopoulos <strong>and</strong> Polatidis, 2003). The AHP technique, despite some<br />
criticisms, has been selected for the current study because of a number of<br />
desirable attributes. The AHP is set apart from other MCDA techniques because of<br />
the unique utilisation of a hierarchy structure <strong>to</strong> represent a problem in the form of a<br />
goal, criteria <strong>and</strong> alternatives (Saaty <strong>and</strong> Kearns, 1985). This allows for breakdown<br />
of the problem in<strong>to</strong> various parts for pair wise comparisons, which uses a single<br />
judgement scale. The underlying concept of the AHP technique is <strong>to</strong> convert<br />
subjective assessments of relative importance <strong>to</strong> a set of overall scores or weights<br />
(Saaty, 1980). Stakeholder consultation is one <strong>to</strong>ol among the range of participative<br />
techniques for involving stakeholders throughout evaluation process. This approach<br />
allows them <strong>to</strong> contribute <strong>to</strong> model development <strong>and</strong> ongoing improvement.Thus,<br />
the platform on which <strong>to</strong> formulate the goal, criteria <strong>and</strong> alternatives for the<br />
evaluation in the study area is derived, <strong>and</strong> based upon, the existing adaptation<br />
works by local government, an extensive literature review regarding adaptation<br />
techniques, <strong>and</strong> most importantly involving the regional stakeholders through
Sahin <strong>and</strong> Mohamed/ <strong>Modelling</strong> <strong>Coastal</strong> <strong>Vulnerability</strong> <strong>and</strong> <strong>Adaptation</strong> <strong>to</strong> <strong>Sea</strong> <strong>Level</strong> <strong>Rise</strong><br />
interviews <strong>and</strong> consultations during structuring hierarchical model, <strong>and</strong> later for<br />
identifying decision criteria <strong>and</strong> alternatives. The stakeholders are classified in<strong>to</strong><br />
three groups: Residents, Experts, <strong>and</strong> Politicians.<br />
The specific goal used in the AHP structure is <strong>to</strong> reduce SLR vulnerability. To clarify<br />
further, this goal implies the identification <strong>and</strong> evaluation of adaptation alternatives<br />
in an attempt <strong>to</strong> reduce the negative impacts from SLR. It encompasses the idea<br />
behind the entire effort <strong>to</strong> reduce the negative impacts from climate change,<br />
specifically SLR.<br />
3 IMPLEMENTING THE APPROACH: PROOF OF CONCEPT<br />
For testing the proposed approach, the City of the Gold Coast located in South-East<br />
Queensl<strong>and</strong>, Australia has been selected. The area encompasses a diverse range<br />
of features including s<strong>and</strong>y beaches, estuaries, coastal lagoons <strong>and</strong> artificial<br />
waterways <strong>and</strong> is highly vulnerable <strong>to</strong> SLR. In this region, the maximum tidal range<br />
is 1.8m, <strong>and</strong> on average, the coast is affected by 1.5 cyclones each year (Boak et<br />
al., 2001). Many of the residential areas in the city are filled <strong>to</strong> the 1:100 year flood<br />
level (Betts, 2002).<br />
Its purpose is <strong>to</strong> examine the timing <strong>and</strong> extent of inundation from SLR, over time.<br />
Currently, our underst<strong>and</strong>ing <strong>and</strong> prediction of the timing <strong>and</strong> magnitude of this<br />
process is limited, specifically due <strong>to</strong> the uncertainties in sea level rise projections.<br />
Thus, a range of SLR scenarios, ranging from 0.5 m <strong>to</strong> 1.5 m, are used <strong>to</strong> address<br />
the uncertainty issues. A one-hundred year time horizon is considered from 2010<br />
through <strong>to</strong> 2110, which is consistent with most SLR scenarios developed by the<br />
Intergovernmental Panel on Climate Change (IPCC, 2007).<br />
3.1 Results<br />
<strong>Vulnerability</strong> Assessment: To determine the effect of changes in vulnerable<br />
populations <strong>and</strong> l<strong>and</strong> areas over time, the Cover Type <strong>and</strong> Elevation data were<br />
simulated under a number of SLR. The changes were captured in a SD <strong>and</strong><br />
exported <strong>to</strong> GIS for visualisation. The inundation layer was overlayed with the 2001<br />
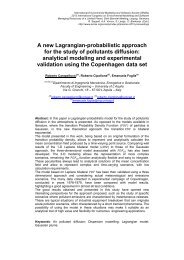
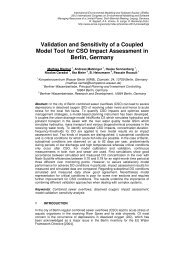
ABS census data, which was aggregated by census parcel for the area. Figure 3<br />
shows the flood maps of the areas at risk due <strong>to</strong> rising sea level, over a period of<br />
100 years. Clearly, as inundation occurs at the water – l<strong>and</strong> interface, the l<strong>and</strong> area<br />
in close proximity <strong>to</strong> the sea, <strong>and</strong> around water bodies, were identified as the most<br />
vulnerable areas. The rising sea quickly penetrates inl<strong>and</strong> through waterways <strong>and</strong><br />
submerges the vulnerable areas around them, thus, putting the people currently<br />
living in those areas at risk.<br />
Table 1. Area at Risk <strong>and</strong> Population at Risk under three SLR scenarios<br />
As shown in Table 1, at the end of a 100 year simulation period, approximately 6 %<br />
of the l<strong>and</strong>scape in the study area will be gradually inundated over time, with 0.5 cm
Sahin <strong>and</strong> Mohamed/ <strong>Modelling</strong> <strong>Coastal</strong> <strong>Vulnerability</strong> <strong>and</strong> <strong>Adaptation</strong> <strong>to</strong> <strong>Sea</strong> <strong>Level</strong> <strong>Rise</strong><br />
SLR per year. Importantly, a 0.5 cm SLR does not pose any significant threats <strong>to</strong><br />
the local population. However, this situation dramatically changes with scenarios 2<br />
<strong>and</strong> 3, which represent 1 cm <strong>and</strong> 1.5 cm SLR per year. Indeed, the percentage of<br />
the vulnerable area leapt <strong>to</strong> about 34 % for Scenario 2, <strong>and</strong> 56 % for Scenario 3.<br />
The most noticeable changes occur after the first 25 years. Further, the rate of<br />
inundation becomes much higher after the first 50 years of the simulation period for<br />
both scenario2 <strong>and</strong> scenario3.<br />
Figure 3. Flood maps generated by the model<br />
Although a substantial<br />
fraction of the<br />
l<strong>and</strong>scape is threatened<br />
by the rising SLR, the<br />
percentage of the<br />
population that can be<br />
classified as vulnerable<br />
is relatively low for<br />
Scn2 <strong>and</strong> Scn3<br />
scenarios, only 0.5 %<br />
<strong>and</strong> 7 %, respectively.<br />
The answer lies with<br />
most of the population<br />
residing at high<br />
altitudes. Nevertheless,<br />
the population located<br />
near waterways <strong>and</strong><br />
coastal strips was<br />
especially vulnerable.<br />
Indeed, about 6% of the<br />
study area l<strong>and</strong>scape<br />
will be submerged if the<br />
sea level rises a 0.5 m<br />
by 2110 (Table<br />
1).Hence, the area at<br />
significant risk will be<br />
increased, up <strong>to</strong> 34%<br />
<strong>and</strong> 56% with a 1 m<br />
<strong>and</strong> 1.5 m rise in sea<br />
level, respectively.<br />
However, the inundation will, generally, be restricted <strong>to</strong> fringing shorelines <strong>and</strong><br />
finger waterways margins (Figure 3). Additionally, although, up <strong>to</strong> 56% of the l<strong>and</strong><br />
area will be facing the risk of inundation, the impacts of the same SLR scenarios on<br />
the residential areas are much smaller.<br />
Multi-Criteria Decision Analysis for <strong>Adaptation</strong> options: The fifth component of the<br />
current framework focuses on linking vulnerability assessment with the evaluation<br />
of adaptation alternatives through the use of AHP <strong>and</strong> multi-stakeholder<br />
consultation. The implementation of the MCDM models involved: assigning weights<br />
<strong>and</strong> priorities <strong>to</strong> the criteria by stakeholders; the normalisation of the raw scores <strong>to</strong><br />
create a common scale of measurement; <strong>and</strong> the calculation of the decision scores<br />
used <strong>to</strong> generate the final output from the models.<br />
To achieve <strong>and</strong> facilitate a workable process <strong>to</strong> reduce the vulnerability of an area<br />
<strong>and</strong> a population <strong>to</strong> SLR, a hierarchical (AHP) structure was developed. The goal:<br />
To Reduce <strong>Vulnerability</strong> <strong>to</strong> SLR. The evaluation criteria were: Applicability,<br />
Effectiveness, Sustainability, Flexibility, <strong>and</strong> Cost. The five adaptation alternatives<br />
were: Retreat, Improve Building Design, Improve Public Awareness, Build<br />
Protective Structures, <strong>and</strong> Take No Action. Three key stakeholder groups were:<br />
Expert, Residents <strong>and</strong> Politicians. By using the questionnaire, the participants were<br />
asked <strong>to</strong> compare the relative importance of the decision alternatives pair-wise,<br />
with respect <strong>to</strong> criteria <strong>and</strong> the goal. The results were obtained through the use of
Sahin <strong>and</strong> Mohamed/ <strong>Modelling</strong> <strong>Coastal</strong> <strong>Vulnerability</strong> <strong>and</strong> <strong>Adaptation</strong> <strong>to</strong> <strong>Sea</strong> <strong>Level</strong> <strong>Rise</strong><br />
Expert Choice-11 package for computing relative weights, consistency ratio <strong>and</strong><br />
local <strong>and</strong> global priorities (Expert Choice, 2008). Additionally, the MS Excel 2007<br />
was also been employed for some calculations <strong>and</strong> data plotting.<br />
The AHP allows the inconsistency of every participant’s survey responses <strong>to</strong> be<br />
represented by the consistency ratio (CR). The resulting CRs are 0.02 for<br />
Residents, 0.02 for Experts <strong>and</strong> 0.06 for Politicians – all less than the 10% limit.<br />
The result indicates that stakeholder groups’ judgements with respect <strong>to</strong> each<br />
criterion <strong>and</strong> with respect <strong>to</strong> the goal are expected <strong>to</strong> be highly consistent. As seen<br />
in Figure 4, regarding the Residents, from the five different adaptation alternatives<br />
presented in the survey questionnaire, the highest priority alternative was Improve<br />
Building Design (0.325 priority), closely followed by Build Protective Structures<br />
(0.285 priority).<br />
Figure 4 Global criteria <strong>and</strong> alternative priorities for stakeholders<br />
The least preferred alternative was Take No Action, followed by Retreat, with<br />
priorities of 0.061 <strong>and</strong> 0.102 respectively. In contrast, the Experts gave their highest<br />
priority <strong>to</strong> Improve Public Awareness with priority of 0.289, while Improve Building<br />
Design <strong>and</strong> Retreat were deemed the next most important alternatives with<br />
priorities of 0.278 <strong>and</strong> 0.203, respectively. While in accord with the Residents<br />
judgements for their least preferred alternative (Take No Action had a 0.089), the<br />
experts next least preferred alternative was Build Protective Structures (0.141<br />
priority). The Politicians <strong>to</strong>p two preferred adaptation alternatives were Improve<br />
Building Design with a priority of 0.457 (the Residents had this alternative as their<br />
<strong>to</strong>p priority, while the Experts rated it as their second priority), <strong>and</strong> Retreat with a<br />
priority of 0.254, which was one of the Residents least preferred alternatives, but<br />
the Experts third <strong>to</strong>p priority (Refer <strong>to</strong> the Politicians’ row in Figure 5). Once again,<br />
the least preferred option for all three groups was Take No Action; however, the<br />
Politicians rated, as second <strong>to</strong> last, the alternative <strong>to</strong> Build Protective Structures,<br />
which disagreed with the Residents judgement, but agreed with the Experts<br />
judgement.<br />
The criteria priorities were obtained in the same way as the alternative priorities<br />
(Figure 4). From the combined results for each stakeholder group, the two most<br />
important criteria <strong>to</strong> consider when making a judgement <strong>to</strong> reduce the negative<br />
impacts of SLR are Effectiveness <strong>and</strong> Sustainability. It appears that the three<br />
stakeholder groups uniformly agree about the importance of the criteria. For<br />
example, Applicability <strong>and</strong> Flexibility generally rank next highest (with Politicians the<br />
exception), while Cost ranks the lowest (with Politicians the exception ranking<br />
Flexibility last).<br />
4 CONCLUSION<br />
The STD framework provides a critical <strong>to</strong>ol for obtaining quantitative information for<br />
managing <strong>and</strong> making choices with the aim of effective decisions. This integrated<br />
approach has the capability <strong>to</strong>: (1) Generate important spatial-temporal information<br />
required by decision makers (DMs); (2) Provide new insights in<strong>to</strong> complex coastal<br />
systems; (3) Address multi-criteria decision problems involving multiple
Sahin <strong>and</strong> Mohamed/ <strong>Modelling</strong> <strong>Coastal</strong> <strong>Vulnerability</strong> <strong>and</strong> <strong>Adaptation</strong> <strong>to</strong> <strong>Sea</strong> <strong>Level</strong> <strong>Rise</strong><br />
stakeholders; (4) Enable DMs <strong>to</strong> examine decision alternatives through the use of<br />
the Dynamic Spatial Model; <strong>and</strong> (5) Address uncertainties <strong>and</strong> generate alternative<br />
scenarios, based on different user inputs.<br />
ACKNOWLEDGMENTS<br />
The authors gratefully acknowledge the funding from the Griffith Climate Change<br />
Response Program (GCCRP) <strong>and</strong> the Centre for Infrastructure Engineering <strong>and</strong><br />
Management (CIEM) – Griffith School of Engineering.<br />
REFERENCES<br />
Ahmad, S. & Simonovic, S. P. 2004. Spatial System Dynamics: New Approach for<br />
Simulation of Water Resources Systems. Journal of Computing in Civil<br />
Engineering, ASCE, 18, 331-340.<br />
Betts, H. 2002. Flood damage analysis using GIS at Gold Coast Council. Australian<br />
Journal of Emergency Management 17, 33-37.<br />
Boak, L., McGrath, J. & Jackson, L. A. A Case Study: The Northern Gold Coast<br />
Beach Protection Strategy. In: Edge, B. L., ed. 27th International<br />
Conference on <strong>Coastal</strong> Engineering, 2001 Sydney, Australia. American<br />
Society of Civil Engineers, 3710-3717.<br />
ESRI 2009. ArcInfo. Redl<strong>and</strong>s, CA: ESRI.<br />
Expert Choice 2008. Expert Choice 11. Arling<strong>to</strong>n , VA.<br />
Gharib, S. 2008. Synthesizing System Dynamics <strong>and</strong> Geographic Information<br />
Systems in a new method <strong>to</strong> Model <strong>and</strong> Simulate Environmental Systems.<br />
PhD, University of Bergen.<br />
Grossmann, W. D. & Eberhardt, S. 1992. Geographical information systems <strong>and</strong><br />
dynamic modelling:Potentials of a new approach. Annals of Regional<br />
Science, 26, 53-66.<br />
Haralambopoulos, D. A. & Polatidis, H. 2003. Renewable energy projects:<br />
structuring a multi-criteria group decision-making framework. Renewable<br />
Energy, 28, 961-973.<br />
IPCC 2007. Summary for Policymakers. In: Solomon, S., D. Qin, M. Manning, Z.<br />
Chen, M. Marquis, K.B. Averyt, M.Tignor <strong>and</strong> H.L. Miller (ed.) Climate<br />
Change 2007: The Physical Science Basis. Contribution of Working Group<br />
I <strong>to</strong> the Fourth Assessment Report of the Intergovernmental Panel on<br />
Climate Change. Cambridge, UK <strong>and</strong> New York, NY, USA.<br />
McLean, R. F., Tsyban, A., Burkett, V., Codignot<strong>to</strong>, J. O., Forbes, D. L., Mimura, N.,<br />
Beamish, R. J. & Ittekkot, V. 2001. <strong>Coastal</strong> Zones <strong>and</strong> Marine Ecosystems.<br />
Climate Change 2001: Impacts, <strong>Adaptation</strong>, <strong>and</strong> <strong>Vulnerability</strong> Cambridge,<br />
UK <strong>and</strong> NY, USA.<br />
Ruth, M. & Pieper, F. 1994. Modeling spatial dynamics of sea-level rise in a coastal<br />
area. System Dynamics Review, 10, 375-389.<br />
Saaty, T. L. 1980. The Analytic Hierarchy Process, New York, NY, McGraw-Hill.<br />
Saaty, T. L. & Kearns, K. P. 1985. Analytical Planning : The Organization of<br />
Systems Oxford, New york, Pergamon Press.<br />
Schmoldt, D. L. 2001. The analytic hierarchy process in natural resource <strong>and</strong><br />
environmental decision making, Dordrecht ; Bos<strong>to</strong>n, Kluwer Academic<br />
Publishers.<br />
Small, C. & Nicholls, R. J. 2003. A Global Analysis of Human Settlement in <strong>Coastal</strong><br />
Zones. Journal of <strong>Coastal</strong> Research, 19, 584-599.<br />
Ventana Systems 2009. Vensim DSS. 10d ed. Harvard, MA: Ventana Systems, Inc.<br />
Zhang, B. 2008. A Study of GIS-SD Based Temporal-Spatial <strong>Modelling</strong> Of Water<br />
Quality In Water Pollution Accidents. ISPRS Congress Beijing 2008,<br />
Proceedings of Commission II. Beijing Reed Business - Geo.