- Page 3 and 4: Complexity and Integrated Resources
- Page 5 and 6: IEMSs 2004 - 14-17 June 2004, Unive
- Page 7 and 8: TABLE OF CONTENTS iEMSs 2004 sessio
- Page 9 and 10: Some Methodological Concepts to Ana
- Page 11 and 12: A Model of the Biocomplexity of Def
- Page 13: River Basin Management The Utility
- Page 16 and 17: detail [Ghosh], [Shah], [Lerner 200
- Page 18 and 19: of the APNEE regional server was ba
- Page 20 and 21: European Parliament, European Counc
- Page 22 and 23: 2 BACKGROUND 2.1 Environmental Mana
- Page 24 and 25: Domain Knowledge Application Domain
- Page 26 and 27: sible for suppling the O 3 RTAA wit
- Page 28 and 29: 1.2 Bridging the knowledge gap It i
- Page 30 and 31: schools in the Bedfordshire area. A
- Page 32 and 33: the respondents did not feel confid
- Page 34 and 35: • To control the effects on the e
- Page 36 and 37: A001 7:00:00 150 Figure 3. Web
- Page 38 and 39: Figure 6. Air information measures
- Page 40 and 41: Concepts of Decision Support for Ri
- Page 42 and 43: 4. PREDICTION OF OUTCOMES The outco
- Page 44 and 45: Number of nat. tributaries p.r.l. D
- Page 46 and 47: Decision Making under Uncertainty i
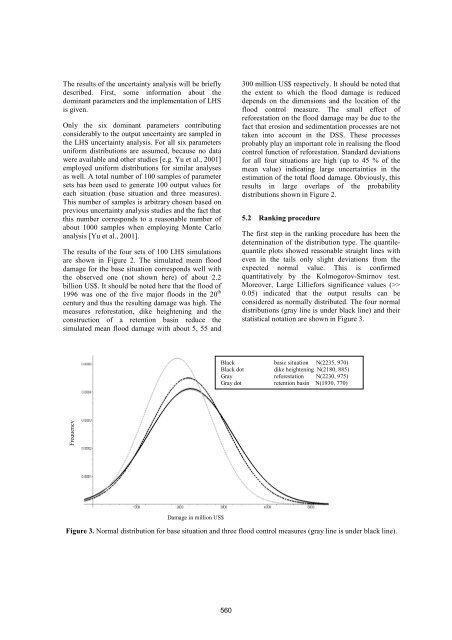
- Page 48 and 49: Reforestation is a sustainable floo
- Page 52 and 53: Development of a GIS-based Decision
- Page 54 and 55: distributed hydrological model, the
- Page 56 and 57: Fig. 5 Water availability/deficienc
- Page 58 and 59: Possible Courses: Multi-Objective M
- Page 60 and 61: arrows or arcs, with conditional pr
- Page 62 and 63: of that result, productive years re
- Page 64 and 65: A Spatial DSS for South Australia's
- Page 66 and 67: framework to be developed, however,
- Page 68 and 69: • efficiency and • comprehensiv
- Page 70 and 71: Optimum Sustainable Water Managemen
- Page 72 and 73: factors in the basin, each model th
- Page 74 and 75: Treated wastewater from households
- Page 76 and 77: Application of a GIS-based Simulati
- Page 78 and 79: 3. THE TUGAI SIMULATION TOOL The TU
- Page 80 and 81: Figure 3 depicts the results of the
- Page 82 and 83: Schlüter M., Savitsky A.G., McKinn
- Page 84 and 85: temporal scale for a large river ba
- Page 86 and 87: Some model components such as proce
- Page 88 and 89: In the next step all indented measu
- Page 90 and 91: states to conduct a disaggregate an
- Page 92 and 93: • Water demand is quantified by p
- Page 94 and 95: much higher, confirming the intensi
- Page 96 and 97: - the optimization module, defining
- Page 98 and 99: 2.3 A proposal of dynamic risk defi
- Page 100 and 101:
heavily interested by hazmat traffi
- Page 102 and 103:
2. APPROPRIATENESS FRAMEWORK Figure
- Page 104 and 105:
inputs and parameters are arbitrari
- Page 106 and 107:
wrong decision and have counteracti
- Page 108 and 109:
community of the 2002 World Summit
- Page 110 and 111:
framework (Driving Force - Pressure
- Page 112 and 113:
are assessed in terms of their sust
- Page 114 and 115:
scales are required to identify con
- Page 116 and 117:
consumption requirements, limits on
- Page 118 and 119:
possibilities to adoption of sustai
- Page 120 and 121:
Several attempts in this direction
- Page 122 and 123:
With concern to the technologies se
- Page 124 and 125:
also political and economic impact
- Page 126 and 127:
Submit interim report on the implem
- Page 128 and 129:
ies within the river basin district
- Page 130 and 131:
complexity of WFD Decision Support
- Page 132 and 133:
7. REFERENCES [1] CIS (Common Strat
- Page 134 and 135:
tion of the pricing policies. 1.2 A
- Page 136 and 137:
3 DAWN MODELS 3.1 Econometric model
- Page 138 and 139:
5 DEMONSTRATION The DAWN platform h
- Page 140 and 141:
2001]. A combined definition of ver
- Page 142 and 143:
decision support system. When one v
- Page 144 and 145:
model evaluation. F. D’Erchia pro
- Page 146 and 147:
An integrated modelling approach to
- Page 148 and 149:
2.1 Framework requirements The fram
- Page 150 and 151:
patterns). Outputs also need to ind
- Page 152 and 153:
Some Methodological Concepts to Ana
- Page 154 and 155:
The term “communication” can be
- Page 156 and 157:
The stake is to convince all partic
- Page 158 and 159:
Tools to Think With? Towards Unders
- Page 160 and 161:
expected to prevent our knowledge a
- Page 162 and 163:
1. What impact at the work-package
- Page 164 and 165:
Uncertainty in the Water Framework
- Page 166 and 167:
asin without any additional provisi
- Page 168 and 169:
3.3 Uncertainty due to Prediction -
- Page 170 and 171:
. An Interactive Spatial Optimisati
- Page 172 and 173:
those available in BIOCLIM (variabl
- Page 174 and 175:
study area and any scale to solve u
- Page 176 and 177:
Assessing the Feasibility of Using
- Page 178 and 179:
sense but in an geographical sense.
- Page 180 and 181:
misclassifications can cause supply
- Page 182 and 183:
6. REFERENCES [1] Leuven, R.S.E.W.
- Page 184 and 185:
algorithms (GAs) to find optimal so
- Page 186 and 187:
demand dissatisfaction, minimizatio
- Page 188 and 189:
1 10 C 8 0 [mg/l] 5 0 3 0 1 0 0 Fig
- Page 190 and 191:
In other words, given that the only
- Page 192 and 193:
£ male have only 40% of chance of
- Page 194 and 195:
1 0.9 0.8 0.7 0.6 0.5 0.4 0.3 0.2 0
- Page 196 and 197:
dissolution of rock salt in the Mah
- Page 198 and 199:
YIELD PRICE RECEIPTS AREA CASH COST
- Page 200 and 201:
4. DISCUSSION AND CONCLUSIONS ICHAM
- Page 202 and 203:
Management Strategies for Cities an
- Page 204 and 205:
generated is very similar in these
- Page 206 and 207:
elationship between the average hou
- Page 208 and 209:
− the representation of resources
- Page 210 and 211:
dr j is the spread speed of the fir
- Page 212 and 213:
Referring to Scenario 1 (see figure
- Page 214 and 215:
to evaluate field scale environment
- Page 216 and 217:
An increase in LFA support is assum
- Page 218 and 219:
oilseeds and winter cereals with hi
- Page 220 and 221:
Simulation of Water and Carbon Flux
- Page 222 and 223:
latter is separated into 5 fraction
- Page 224 and 225:
is accounted for through the separa
- Page 226 and 227:
An integrated geomorphological and
- Page 228 and 229:
The recession coefficient of the sl
- Page 230 and 231:
etween modeled and observed dischar
- Page 232 and 233:
Anticipated Effects of Re-Allocatio
- Page 234 and 235:
Shrinkage in livestock was 11% (exp
- Page 236 and 237:
3.3. Integration in other spatial p
- Page 238 and 239:
An Integrated System for the Forest
- Page 240 and 241:
Topography and territorial data (GI
- Page 242 and 243:
The first information on which the
- Page 244 and 245:
Linking Narrative Storylines and Qu
- Page 246 and 247:
and structured for each of these th
- Page 248 and 249:
Figure 3. Examples of maps of the G
- Page 250 and 251:
Integrated Assessment of Water Stre
- Page 252 and 253:
1999). This can easily lead to inco
- Page 254 and 255:
influence on the regional vulnerabi
- Page 256 and 257:
methodological guidelines for a suc
- Page 258 and 259:
The next item—illustrating a part
- Page 260 and 261:
eflects a knowledge of the relevant
- Page 262 and 263:
management and in Hoyland and Walla
- Page 264 and 265:
that scenario g will occur, he coul
- Page 266 and 267:
period t and the value x b , identi
- Page 268 and 269:
2 MATERIAL 3 METHODS The basis for
- Page 270 and 271:
Figure 1 Distance between scenarios
- Page 272 and 273:
Therefore the proposed approach see
- Page 274 and 275:
system dynamics allow studying inte
- Page 276 and 277:
the IPCC marker scenarios and the c
- Page 278 and 279:
Essential elements of the storyline
- Page 280 and 281:
ise and water availability. This st
- Page 282 and 283:
how legal or economic restrictions
- Page 284 and 285:
into environmental quality (from th
- Page 286 and 287:
control were carried out as they id
- Page 288 and 289:
5) by number of years since HIV inf
- Page 290 and 291:
upon the incidence of diarrhea, whe
- Page 292 and 293:
Yates, D.N. 1996. WatBal: an integr
- Page 294 and 295:
equires not so much better understa
- Page 296 and 297:
1.2.2 Present opportunities Chronic
- Page 298 and 299:
progress in application of Conceptu
- Page 300 and 301:
Linking Hydrologic Modeling and Eco
- Page 302 and 303:
25°25´ 80°50´ 80° 45´ 80° 40
- Page 304 and 305:
Figure 7: Hydrology of dwarf mangro
- Page 306 and 307:
On the Local Coexistence of Species
- Page 308 and 309:
(1) Initially, we randomly distribu
- Page 310 and 311:
Figure 4. A snapshot of typical sta
- Page 312 and 313:
Ecosystems as Evolutionary Complex
- Page 314 and 315:
network such as predation, mutualis
- Page 316 and 317:
Table 2. Example of 2 connectance m
- Page 318 and 319:
Benthic Macroinvertebrates Modellin
- Page 320 and 321:
the error being calculated for the
- Page 322 and 323:
the percentage of success and the c
- Page 324 and 325:
Interspecific Segregation and Phase
- Page 326 and 327:
The equations (4a) and (4b) are cal
- Page 328 and 329:
when the steady-state densities app
- Page 330 and 331:
A Model of the biocomplexity of def
- Page 332 and 333:
1. The Government neither interacts
- Page 334 and 335:
software integrates simulation tech
- Page 336 and 337:
Developing Tools for Adaptive Integ
- Page 338 and 339:
stability are contested (e.g. see P
- Page 340 and 341:
formed to manage the resource more
- Page 342 and 343:
as Stability Analyses of the 50/50
- Page 344 and 345:
e The parameter m represents the mo
- Page 346 and 347:
Figure 4. Same as Fig .2 , but the
- Page 348 and 349:
Reproductive Strategies of Marine G
- Page 350 and 351:
studies on gamete size and swimming
- Page 352 and 353:
ecause they often possess mechanism
- Page 354 and 355:
Predicting predation efficiency of
- Page 356 and 357:
where Γ(k ) is a gamma function [K
- Page 358 and 359:
pupate at an earlier age [Tenhumber
- Page 360 and 361:
The Coexistence of Plankton Species
- Page 362 and 363:
Figure 1. A typical result of popul
- Page 364 and 365:
Figure 3. Snapshots of a temporal p
- Page 366 and 367:
ÅØÑØÐ ÑÓÐÐÒ Ó ÖÑÙÐ
- Page 368 and 369:
878
- Page 370 and 371:
880
- Page 372 and 373:
882
- Page 374 and 375:
and these differences are categoris
- Page 376 and 377:
2a) a) subsurface flow. This can be
- Page 378 and 379:
kindly provided by the Finnish Mete
- Page 380 and 381:
2 MODEL APPROACHES In this section
- Page 382 and 383:
vival of individuals and seeds in t
- Page 384 and 385:
Shannon diversity index 2.2 2.4 2.6
- Page 386 and 387:
and Amblyomma limbatum are ectopara
- Page 388 and 389:
Predation on ticks within refuges b
- Page 390 and 391:
Relative width of overlap zone [km]
- Page 392 and 393:
How to Compare Different Conceptual
- Page 394 and 395:
¥ ¥ ¡ ¥ tions are assumed to oc
- Page 396 and 397:
Table 2. Relative errors [variation
- Page 398 and 399:
Simulation of Dynamic Tree Species
- Page 400 and 401:
Lotter et al., 2003]. The species w
- Page 402 and 403:
4. DISCUSSION The large-scale spati
- Page 404 and 405:
Aphid Population Dynamics in Agricu
- Page 406 and 407:
3.3 Reproduction Aphid agents becom
- Page 408 and 409:
peaked around 40 days later. Therea
- Page 410 and 411:
Integrating Wetlands and Riparian Z
- Page 412 and 413:
is can has is α = 10 * T S * L 2 (
- Page 414 and 415:
Q [m 3 /s] basin is strongly influe
- Page 416 and 417:
Williams, J.R., Renard, K.G., Dyke,
- Page 418 and 419:
are mapped as areas that have disti
- Page 420 and 421:
A general approach for implementing
- Page 422 and 423:
fit mixture models to the existing
- Page 424 and 425:
conditions and biotic response have
- Page 426 and 427:
these maps may be transformed to ma
- Page 428 and 429:
variable in space and time, Verhand
- Page 430 and 431:
͌ single 2. MODEL DESCRIPTION The
- Page 432 and 433:
wavelengths and low sun, where the
- Page 434 and 435:
Solar Energy Center, Rep. FSEC-PF-2
- Page 436 and 437:
¥ ¢ £ ¤ s , ¡ parameter of the
- Page 438 and 439:
A N ( φ ) f φ N 0.15 0.1 0.05 A N
- Page 440 and 441:
A 160 180 200 220 0.02 0.015 0.01 0
- Page 442 and 443:
Genuchten and Wierenga, 1976] is of
- Page 444 and 445:
Cum. Flux [mm] 600 400 200 Pot. ET
- Page 446 and 447:
¢ ¡ The influence of the averagin
- Page 448 and 449:
Month Hour Hourly averages ten min
- Page 450 and 451:
4 CONCLUSIONS The differences in ca
- Page 452 and 453:
Interaction Between Hydrodynamics a
- Page 454 and 455:
˽ [2002]). Also, this interface is
- Page 456 and 457:
Reynolds number Re*=1200. The S-H m
- Page 458 and 459:
0.5 Sh = c2 Re* Sc (15) where c 2 i
- Page 460 and 461:
A Spatially-Distributed Conceptual
- Page 462 and 463:
saturated hydraulic conductivity of
- Page 464 and 465:
For routing of the channel water, t
- Page 466 and 467:
Bouraoui, F. and T.A. Dillaha, ANSW
- Page 468 and 469:
analyst to understand the main cont
- Page 470 and 471:
- the annual maximum discharge of t
- Page 472 and 473:
The approach is therefore very well
- Page 474 and 475:
Parameters Estimation Using Some An
- Page 476 and 477:
typical numerical errors of the PDE
- Page 478 and 479:
In Table 2 the results of the param
- Page 480 and 481:
Soil Hydraulics Properties Estimati
- Page 482 and 483:
¥¤££ ©© ¨ § ¢ ¡ ¥¤££
- Page 484 and 485:
Soil sample 1 2 3 4 5 6 7 8 Bulk de
- Page 486 and 487:
An Approach for Calculating the Tur
- Page 488 and 489:
˻ ̌ ̌ ˻ ˻ ̌ ̌ ̌ ̌ that wil
- Page 490 and 491:
[2004]. Using the above parameter v
- Page 492 and 493:
The Utility of GIS Delivered Enviro
- Page 494 and 495:
water body of groundwater abstracti
- Page 496 and 497:
100 pressures and the quality of me
- Page 498 and 499:
A Tool for Evaluating Risk to Surfa
- Page 500 and 501:
and Binley 1992). However, WaterRAT
- Page 502 and 503:
Figure 2 shows the same for P load
- Page 504 and 505:
Spatially Distributed Investment Pr
- Page 506 and 507:
mapping of the controlling environm
- Page 508 and 509:
Total Cost ( Millions $ ) Total Cos
- Page 510 and 511:
erosion source rates can potentiall
- Page 512 and 513:
River Basin Catchment Module urban
- Page 514 and 515:
R 2 = 1 N N tot ∑ t tot t = 1 1
- Page 516 and 517:
Fuchs E., Giebel H., Hettrich A., H
- Page 518 and 519:
connected to unusual events. The me
- Page 520 and 521:
Criteria Analysis functionalities s
- Page 522 and 523:
price, thus experiencing the implem
- Page 524 and 525:
The final product of the study is a
- Page 526 and 527:
Summing the scores for each variabl
- Page 528 and 529:
Florence Impact from the QUAL2E mod
- Page 530 and 531:
loads. CatchMODS links several comp
- Page 532 and 533:
N 1 C hi S hi g = ( − ). gG hi +
- Page 534 and 535:
4. DISCUSSION AND CONCLUSIONS This
- Page 536 and 537:
additional sources of uncertainty b
- Page 538 and 539:
unbiased simulations included in th
- Page 540 and 541:
major source of predictive uncertai
- Page 542 and 543:
contributing over 50% of the phosph
- Page 544 and 545:
(snow pack temperature lag factor).
- Page 546 and 547:
increase the understanding of proce
- Page 548 and 549:
Lake Simojärvi . 4 Water quality m
- Page 550 and 551:
Table 1. Used max. N fertilization
- Page 552 and 553:
4. CONCLUSIONS This study shows tha
- Page 554 and 555:
Implications of Complexity and Unce
- Page 556 and 557:
for regional applications). They ar
- Page 558 and 559:
Elbe basin and its four subregions:
- Page 560 and 561:
esources in a large irrigation dist
- Page 562 and 563:
0.55 0.5 0.45 a 0.4 0.35 0.3 0.25 1
- Page 564 and 565:
5. CONCLUDING REMARKS In the paper
- Page 566 and 567:
e used to compare an observation wi
- Page 568 and 569:
4. COMPARISON DEMONSTRATION This se
- Page 570 and 571:
IMSE pixel values for observed and
- Page 572 and 573:
2. THE INCA-N MODEL The INCA-N is a
- Page 574 and 575:
include any transformation or immob
- Page 576 and 577:
Moreover, we found that, almost reg
- Page 578 and 579:
3. METHODS To reduce the overall un
- Page 580 and 581:
literature ranges. The ranges for t
- Page 582 and 583:
first one being ‘exploring’, wh
- Page 584 and 585:
Granlund K. .......................
- Page 586:
Tymoshevska L. ................III


