A Time-Dependent Enhanced Support Vector Machine For Time ...
A Time-Dependent Enhanced Support Vector Machine For Time ...
A Time-Dependent Enhanced Support Vector Machine For Time ...

You also want an ePaper? Increase the reach of your titles
YUMPU automatically turns print PDFs into web optimized ePapers that Google loves.
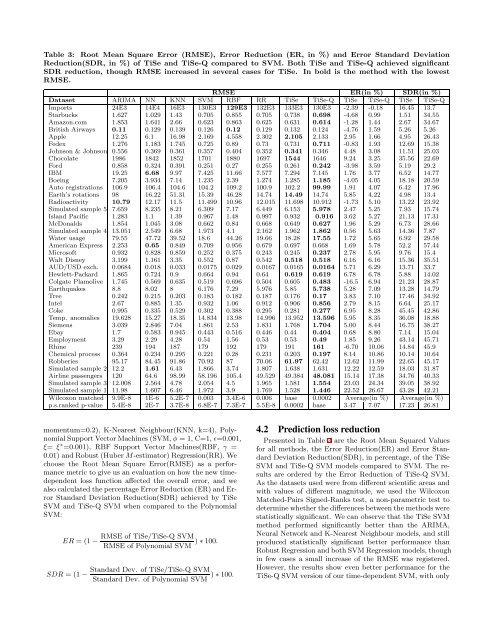
Table 3: Root Mean Square Error (RMSE), Error Reduction (ER, in %) and Error Standard Deviation<br />
Reduction(SDR, in %) of TiSe and TiSe-Q compared to SVM. Both TiSe and TiSe-Q achieved significant<br />
SDR reduction, though RMSE increased in several cases for TiSe. In bold is the method with the lowest<br />
RMSE.<br />
RMSE ER(in %) SDR(in %)<br />
Dataset ARIMA NN KNN SVM RBF RR TiSe TiSe-Q TiSe TiSe-Q TiSe TiSe-Q<br />
Imports 24E3 14E4 16E3 130E3 129E3 132E3 133E3 130E3 -2.39 -0.18 16.45 13.7<br />
Starbucks 1.627 1.029 1.43 0.705 0.855 0.705 0.738 0.698 -4.68 0.99 1.51 34.55<br />
Amazon.com 1.853 1.641 2.66 0.623 0.863 0.625 0.631 0.614 -1.28 1.44 2.67 34.67<br />
British Airways 0.11 0.129 0.139 0.126 0.12 0.129 0.132 0.124 -4.76 1.59 5.26 5.26<br />
Apple 12.25 6.1 16.98 2.169 4.558 2.302 2.105 2.133 2.95 1.66 4.95 26.43<br />
Fedex 1.276 1.183 1.745 0.725 0.89 0.73 0.731 0.711 -0.83 1.93 12.69 15.38<br />
Johnson & Johnson 0.556 0.369 0.361 0.357 0.404 0.352 0.341 0.346 4.48 3.08 11.51 25.03<br />
Chocolate 1986 1842 1852 1701 1880 1697 1544 1646 9.24 3.25 35.56 22.69<br />
<strong>For</strong>d 0.858 0.324 0.391 0.251 0.27 0.255 0.261 0.242 -3.98 3.59 5.19 29.2<br />
IBM 19.25 6.68 9.97 7.425 11.66 7.577 7.294 7.145 1.76 3.77 6.52 14.77<br />
Boeing 7.205 3.934 7.14 1.235 2.39 1.274 1.285 1.185 -4.05 4.05 18.18 20.59<br />
Auto registrations 106.9 106.4 104.6 104.2 109.2 100.9 102.2 99.99 1.91 4.07 6.42 17.96<br />
Earth’s rotations 98 16.22 51.31 15.39 46.28 14.74 14.49 14.74 5.85 4.22 4.98 13.4<br />
Radioactivity 10.79 12.17 11.5 11.499 10.96 12.015 11.698 10.912 -1.73 5.10 13.22 23.92<br />
Simulated sample 5 7.659 8.235 8.21 6.309 7.17 6.449 6.153 5.978 2.47 5.25 7.93 15.74<br />
Island Pacific 1.283 1.1 1.39 0.967 1.48 0.997 0.932 0.916 3.62 5.27 21.13 17.31<br />
McDonalds 1.854 1.045 3.08 0.662 0.84 0.668 0.649 0.627 1.96 5.29 6.73 28.66<br />
Simulated sample 4 13.051 2.549 6.68 1.973 4.1 2.162 1.962 1.862 0.56 5.63 14.36 7.87<br />
Water usage 79.55 47.72 39.52 18.6 44.26 19.66 18.28 17.55 1.72 5.65 6.92 29.58<br />
American Express 2.253 0.65 0.849 0.709 0.956 0.679 0.697 0.668 1.69 5.78 52.2 57.44<br />
Microsoft 0.932 0.828 0.859 0.252 0.375 0.243 0.245 0.237 2.78 5.95 9.76 15.4<br />
Walt Disney 3.199 1.161 3.35 0.552 0.87 0.542 0.518 0.518 6.16 6.16 15.36 35.51<br />
AUD/USD exch. 0.0684 0.018 0.033 0.0175 0.029 0.0167 0.0165 0.0164 5.71 6.29 13.71 33.7<br />
Hewlett-Packard 1.865 0.724 0.9 0.664 0.94 0.64 0.619 0.619 6.78 6.78 5.88 14.02<br />
Colgate Plamolive 1.745 0.569 0.635 0.519 0.696 0.504 0.605 0.483 -16.5 6.94 21.23 28.87<br />
Earthquakes 8.8 8.02 8 6.176 7.29 5.976 5.85 5.738 5.28 7.09 13.28 14.79<br />
Tree 0.242 0.215 0.203 0.183 0.182 0.187 0.176 0.17 3.83 7.10 17.46 34.92<br />
Intel 2.67 0.885 1.35 0.932 1.06 0.912 0.906 0.856 2.79 8.15 6.64 25.17<br />
Coke 0.995 0.335 0.529 0.302 0.388 0.295 0.281 0.277 6.95 8.28 45.45 42.86<br />
Temp. anomalies 19.628 15.27 18.35 14.834 13.98 14.996 13.952 13.596 5.95 8.35 36.08 18.88<br />
Siemens 3.039 2.846 7.04 1.861 2.53 1.831 1.768 1.704 5.00 8.44 16.75 38.27<br />
Ebay 1.7 0.583 0.945 0.443 0.516 0.446 0.44 0.404 0.68 8.80 7.14 15.04<br />
Employment 3.29 2.29 4.28 0.54 1.56 0.53 0.53 0.49 1.85 9.26 43.14 45.71<br />
Rhine 239 194 187 179 192 179 191 161 -6.70 10.06 14.84 45.9<br />
Chemical process 0.364 0.234 0.295 0.221 0.28 0.231 0.203 0.197 8.14 10.86 10.14 10.64<br />
Robberies 95.17 84.45 91.86 70.92 87 70.06 61.97 62.42 12.62 11.99 22.65 45.17<br />
Simulated sample 2 12.2 1.61 6.43 1.866 3.74 1.807 1.638 1.631 12.22 12.59 18.03 31.87<br />
Airline passengers 120 64.6 98.99 58.196 105.4 49.529 49.384 48.081 15.14 17.38 34.76 40.33<br />
Simulated sample 3 12.008 2.564 4.78 2.054 4.5 1.965 1.581 1.554 23.03 24.34 39.05 38.92<br />
Simulated sample 1 11.98 1.607 6.46 1.972 3.9 1.769 1.528 1.446 22.52 26.67 43.28 42.21<br />
Wilcoxon matched 9.9E-8 1E-6 5.2E-7 0.003 3.4E-6 0.006 base 0.0002 Average(in %) Average(in %)<br />
p.s.ranked p-value 5.4E-8 2E-7 3.7E-8 6.8E-7 7.3E-7 5.5E-8 0.0002 base 3.47 7.07 17.23 26.81<br />
momentum=0.2), K-Nearest Neighbour(KNN, k=4), Polynomial<strong>Support</strong><strong>Vector</strong><strong>Machine</strong>s(SVM,φ<br />
= 1, C=1, ǫ=0.001,<br />
ξ= ξ ∗ =0.001), RBF <strong>Support</strong> <strong>Vector</strong> <strong>Machine</strong>s(RBF, γ =<br />
0.01) andRobust(HuberM-estimator) Regression(RR). We<br />
choose the Root Mean Square Error(RMSE) as a performance<br />
metric to give us an evaluation on how the new timedependent<br />
loss function affected the overall error, and we<br />
alsocalculatedthepercentageErrorReduction(ER)andError<br />
Standard Deviation Reduction(SDR) achieved by TiSe<br />
SVM and TiSe-Q SVM when compared to the Polynomial<br />
SVM:<br />
RMSE of TiSe/TiSe-Q SVM<br />
ER = (1−<br />
RMSE of Polynomial SVM )∗100.<br />
Standard Dev. of TiSe/TiSe-Q SVM<br />
SDR = (1−<br />
Presented in Table 3 are the Root Mean Squared Values<br />
for all methods, the Error Reduction(ER) and Error Standard<br />
Deviation Reduction(SDR), in percentage, of the TiSe<br />
SVM and TiSe-Q SVM models compared to SVM. The results<br />
are ordered by the Error Reduction of TiSe-Q SVM.<br />
As the datasets used were from different scientific areas and<br />
with values of different magnitude, we used the Wilcoxon<br />
Matched-Pairs Signed-Ranks test, a non-parametric test to<br />
determinewhetherthedifferencesbetweenthemethodswere<br />
statistically significant. We can observe that the TiSe SVM<br />
method performed significantly better than the ARIMA,<br />
Neural Network and K-Nearest Neighbour models, and still<br />
produced statistically significant better performance than<br />
RobustRegressionandbothSVMRegressionmodels, though<br />
in few cases a small increase of the RMSE was registered.<br />
However, the results show even better performance for the<br />
TiSe-Q SVM version of our time-dependent SVM, with only<br />
Standard Dev. of Polynomial SVM )∗100. 4.2 Prediction loss reduction