Consistent Measurement of Fiscal Deficit and Debt of States in India
Consistent Measurement of Fiscal Deficit and Debt of States in India
Consistent Measurement of Fiscal Deficit and Debt of States in India

You also want an ePaper? Increase the reach of your titles
YUMPU automatically turns print PDFs into web optimized ePapers that Google loves.
<strong>Consistent</strong> <strong>Measurement</strong> <strong>of</strong> <strong>Fiscal</strong> <strong>Deficit</strong> <strong>and</strong> <strong>Debt</strong> <strong>of</strong> <strong>States</strong><br />
<strong>in</strong> <strong>India</strong><br />
- Rav<strong>in</strong>dra H. Dholakia<br />
Navendu Karan<br />
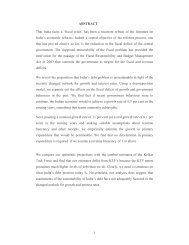
ABSTRACT<br />
[ There are differences <strong>in</strong> the def<strong>in</strong>ition <strong>of</strong> debt used by different bodies like the state<br />
governments, Reserve Bank <strong>of</strong> <strong>India</strong>, the Office <strong>of</strong> Comptroller <strong>and</strong> Auditor General <strong>of</strong><br />
<strong>India</strong> <strong>and</strong> the Eleventh F<strong>in</strong>ance Commission. Moreover, none <strong>of</strong> these def<strong>in</strong>itions satisfy<br />
the criterion that fiscal deficit <strong>in</strong> a given year should equal the sum <strong>of</strong> <strong>in</strong>crease <strong>in</strong> debt<br />
<strong>and</strong> monetisation. This paper attempts to estimate debt <strong>in</strong> a theoretically consistent <strong>and</strong><br />
appropriate manner for 15 non special category states <strong>and</strong> 10 special category states<br />
for the period 1989-90 to 2003-04, which are then used to obta<strong>in</strong> effective <strong>in</strong>terest rates<br />
for these states. We observe that non-special category states have a significantly<br />
greater probability <strong>of</strong> fiscal susta<strong>in</strong>ability than the special category states. Moreover,<br />
when the trends <strong>in</strong> the proportion <strong>of</strong> debt <strong>of</strong> each state <strong>in</strong> the aggregate <strong>of</strong> all states is<br />
compared with trends <strong>in</strong> similar proportions <strong>of</strong> fiscal transfers from the centre <strong>and</strong> that <strong>in</strong><br />
primary deficit on own account, we f<strong>in</strong>d that certa<strong>in</strong> states have benefited by largesse<br />
from the centre despite a consistent bad performance while certa<strong>in</strong> perform<strong>in</strong>g states<br />
have been penalized by reduced fiscal transfers.]<br />
1. Introduction<br />
By now, policymakers <strong>in</strong> <strong>India</strong> have well recognized that the theoretically consistent<br />
measurement <strong>of</strong> relevant aggregates is a pre-condition for proper diagnosis <strong>and</strong><br />
effective policy <strong>in</strong>tervention. Regard<strong>in</strong>g the fiscal deficit <strong>and</strong> debt, similar concerns were<br />
expressed first at the state level (Shr<strong>of</strong>f et al., 2000; <strong>and</strong> Dholakia, 2003) <strong>and</strong> then, at<br />
the central level (Rangarajan & Srivastava, 2003). After the mid-n<strong>in</strong>eties, the debt<br />
problem <strong>in</strong> the nation, particularly <strong>in</strong> several states has considerably worsened.<br />
Increas<strong>in</strong>g budget deficits <strong>and</strong> borrow<strong>in</strong>gs to f<strong>in</strong>ance the same have given rise to<br />
serious concerns over susta<strong>in</strong>ability <strong>of</strong> fiscal situation. The government has <strong>in</strong>cluded<br />
1
exam<strong>in</strong>ation <strong>of</strong> the fiscal susta<strong>in</strong>ability <strong>of</strong> debt <strong>of</strong> states as one <strong>of</strong> the terms <strong>of</strong> reference<br />
<strong>of</strong> the Twelfth F<strong>in</strong>ance Commission. Susta<strong>in</strong>ability is usually exam<strong>in</strong>ed by compar<strong>in</strong>g<br />
the growth rate <strong>of</strong> <strong>in</strong>come <strong>and</strong> effective average <strong>in</strong>terest rate on the debt. It is here that<br />
proper measurement <strong>of</strong> the debt <strong>and</strong> deficits plays an important or almost a determ<strong>in</strong><strong>in</strong>g<br />
role (see, Dholakia, 2003). This happens because, while the growth rate <strong>of</strong> <strong>in</strong>come is<br />
<strong>in</strong>dependent <strong>of</strong> the measurement <strong>of</strong> debt, the effective average rate <strong>of</strong> <strong>in</strong>terest is not.<br />
Out <strong>of</strong> the various components <strong>of</strong> the total liabilities <strong>of</strong> states, different measures <strong>of</strong> debt<br />
do not consider some components, giv<strong>in</strong>g rise to anomalies <strong>and</strong> mislead<strong>in</strong>g conclusions<br />
about the susta<strong>in</strong>ability <strong>of</strong> debt. For correct diagnosis <strong>and</strong> credible solutions, it is<br />
necessary to exam<strong>in</strong>e the def<strong>in</strong>ition <strong>and</strong> the estimates <strong>of</strong> fiscal deficit at the state level<br />
<strong>and</strong> then derive a consistent measure <strong>of</strong> debt. Such an estimate <strong>of</strong> debt at the state<br />
level <strong>in</strong> <strong>India</strong> has not been attempted so far. In the present short paper, we attempt to<br />
derive such an estimate for all states <strong>in</strong> <strong>India</strong> over the years 1989-90 to 2003-04. We<br />
hope to fill <strong>in</strong> an important data gap for policy analysis thereby.<br />
The paper is organized <strong>in</strong> 5 sections. The next section discusses measurement<br />
<strong>of</strong> fiscal deficit at the state level. In the third section, we discuss the components <strong>of</strong><br />
fiscal deficit <strong>and</strong> a consistent measure <strong>of</strong> liabilities <strong>of</strong> the state government. The fourth<br />
section presents estimates <strong>of</strong> debt <strong>of</strong> states <strong>and</strong> the effective average <strong>in</strong>terest rates <strong>in</strong><br />
states over the years, 1989-90 to 2003-04. Trends <strong>in</strong> the relative debt position <strong>of</strong> the<br />
states are compared with the trends <strong>in</strong> the deficit on own account <strong>and</strong> central transfers<br />
to states. In the f<strong>in</strong>al section, we present summary <strong>and</strong> conclusion.<br />
2. <strong>Measurement</strong> <strong>of</strong> <strong>Fiscal</strong> <strong>Deficit</strong> at State Level<br />
There is a consensus on the broad def<strong>in</strong>ition <strong>of</strong> fiscal deficit <strong>in</strong> <strong>India</strong> both at the central<br />
<strong>and</strong> state level. RBI def<strong>in</strong>es Gross <strong>Fiscal</strong> <strong>Deficit</strong> (GFD) 1 as ‘the difference between<br />
aggregate disbursements net <strong>of</strong> debt repayments <strong>and</strong> recovery <strong>of</strong> loans <strong>and</strong> revenue<br />
receipts <strong>and</strong> non-debt creat<strong>in</strong>g capital receipts’ , that is<br />
1 GFD is referred to as fiscal deficit <strong>in</strong> the government <strong>of</strong> <strong>India</strong>’s budget documents. The Net <strong>Fiscal</strong> <strong>Deficit</strong><br />
(NFD) is a concept relevant for calculat<strong>in</strong>g comb<strong>in</strong>ed fiscal deficit for the centre <strong>and</strong> the states. Thus, for<br />
calculat<strong>in</strong>g GFD, we consider total expenditure less recovery <strong>of</strong> loans & advances, while for NFD, we<br />
consider total expenditure reduced by loans & advances net <strong>of</strong> recoveries (see, Pattnaik, Pillai <strong>and</strong> Das,<br />
1999; p.13 ).<br />
2
GFD = Total Expenditure – Recovery <strong>of</strong> Loans <strong>and</strong> Advances – Revenue<br />
Receipts – Non-<strong>Debt</strong> Capital Receipts - Repayment <strong>of</strong> debt<br />
= Revenue Expenditure + Capital Expenditure - Recovery <strong>of</strong> Loans<br />
<strong>and</strong> Advances – Revenue Receipts – Non-<strong>Debt</strong> Capital Receipts –<br />
Repayment <strong>of</strong> debt<br />
= Revenue Expenditure + Capital Outlay + Repayment <strong>of</strong> <strong>Debt</strong> +<br />
Loans <strong>and</strong> Advances- Recovery <strong>of</strong> Loans <strong>and</strong> Advances –<br />
Revenue Receipts – Non-<strong>Debt</strong> Capital Receipts - Repayment <strong>of</strong><br />
<strong>Debt</strong><br />
= Revenue Expenditure + Capital Outlay + Loans <strong>and</strong> Advances-<br />
Recovery <strong>of</strong> Loans <strong>and</strong> Advances – Revenue Receipts –<br />
Non-<strong>Debt</strong> Capital Receipts<br />
= (Revenue Expenditure – Revenue Receipts) + Capital Outlay +<br />
(Loans <strong>and</strong> Advances- Recovery <strong>of</strong> Loans <strong>and</strong> Advances) –<br />
Non-<strong>Debt</strong> Capital Receipts<br />
= Revenue <strong>Deficit</strong> - Non-debt Capital Receipts + Capital Outlay + Net Lend<strong>in</strong>g<br />
The primary source <strong>of</strong> the data required for all these calculations is the F<strong>in</strong>ance<br />
Accounts <strong>of</strong> the state governments. RBI <strong>and</strong> the <strong>India</strong>n Audit <strong>and</strong> Accounts Department<br />
(IAAD) have direct access to these data. Therefore, there should not be any ambiguity<br />
<strong>in</strong> the calculation <strong>of</strong> GFD by these two <strong>in</strong>stitutions, if they are us<strong>in</strong>g the same def<strong>in</strong>ition.<br />
We compare the GFD figures for 25 states dur<strong>in</strong>g the period 1996-97 to 2000-01 (Table<br />
1) given by RBI <strong>in</strong> its h<strong>and</strong>book on state f<strong>in</strong>ances (2004), <strong>and</strong> the Office <strong>of</strong> the<br />
Comptroller <strong>and</strong> Auditor General <strong>of</strong> <strong>India</strong> (CAG, 2003, Study). We see that the figures<br />
match <strong>in</strong> most cases, imply<strong>in</strong>g that both publications have followed the same def<strong>in</strong>ition.<br />
There are, however, many <strong>in</strong>stances where the difference between the two sets is quite<br />
significant. These <strong>in</strong>stances have been shown <strong>in</strong> bold <strong>in</strong> the table.<br />
[Table 1 around here]<br />
If we take Gujarat as an illustration, we f<strong>in</strong>d that GFD figures <strong>of</strong> RBI <strong>and</strong> CAG<br />
study differ by Rs.71 Crores <strong>in</strong> the year 1999-2000. Accord<strong>in</strong>g to RBI, GFD <strong>in</strong> 1999-<br />
2000 for Gujarat was 6792 Crores while the correspond<strong>in</strong>g figure <strong>in</strong> CAG-study figure is<br />
Rs 6721 Crores.A closer <strong>in</strong>spection <strong>of</strong> RBI <strong>and</strong> F<strong>in</strong>ance Accounts Data shows that the<br />
disparity arises due to the head ‘Sale <strong>of</strong> l<strong>and</strong> <strong>and</strong> property’ which had been ignored by<br />
3
RBI while F<strong>in</strong>ance Accounts had <strong>in</strong>cluded this under the head ‘Non-tax revenue’. While<br />
RBI has committed an error <strong>of</strong> omission, CAG <strong>of</strong>fice has made an error <strong>of</strong> commission<br />
by mak<strong>in</strong>g the entry not <strong>in</strong> ‘Capital Receipts (Miscellaneous)’ but under ‘Non-tax<br />
revenue’. It is likely that difference between the two estimates <strong>in</strong> other cases is also due<br />
to such errors <strong>and</strong> not due to any fundamental change <strong>in</strong> the concept <strong>of</strong> GFD followed<br />
by them.<br />
The case <strong>of</strong> Bihar <strong>and</strong> Nagal<strong>and</strong>, however, is more <strong>in</strong>terest<strong>in</strong>g. The GFD figures<br />
do not match even <strong>in</strong> a s<strong>in</strong>gle year for these two states. The difference arises because<br />
RBI has given ‘revised estimates’ while CAG-study has taken ‘actuals’. Similar<br />
difference arises for Arunachal Pradesh, J&K <strong>and</strong> Mizoram for the years where RBI has<br />
given revised estimates <strong>and</strong> not accounts data 2 . The large differences <strong>in</strong> most <strong>of</strong> these<br />
cases arise because <strong>of</strong> poor marksmanship at the state level. It is a matter <strong>of</strong> serious<br />
concern that we cannot put enough confidence on revised estimates, for their use <strong>in</strong><br />
policymak<strong>in</strong>g.<br />
In some <strong>in</strong>stances, there are discrepancies between RBI(2004) data <strong>and</strong><br />
government budget data. For example, RBI figures for 2002-03 (RE) <strong>and</strong> 2003-04 (BE)<br />
for Karnataka do not match the correspond<strong>in</strong>g values shown on the government website<br />
http://www.kar.nic.<strong>in</strong>/f<strong>in</strong>ance/bud2004/bglan2004.htm<br />
Another question still rema<strong>in</strong>s. Do the figures given <strong>in</strong> the Table 1, at least when<br />
they match for the two <strong>in</strong>stitutions, mean that they are correct as per the RBI def<strong>in</strong>ition?<br />
Certa<strong>in</strong>ly not <strong>in</strong> all cases! Aga<strong>in</strong> tak<strong>in</strong>g Gujarat as an illustration, we f<strong>in</strong>d that RBI has<br />
not followed its own def<strong>in</strong>ition <strong>in</strong> its entirety. The head ‘Non-<strong>Debt</strong> Capital Receipts<br />
(NDCR)’ or ‘Miscellaneous Capital Receipts (MCR)’ has been ignored. The same is true<br />
for CAG-study. GFD figures are, therefore, higher by this factor for both the studies. It<br />
has <strong>in</strong>troduced an error <strong>in</strong> four <strong>of</strong> the last five years. Similar analysis on two other states<br />
viz. Assam <strong>and</strong> Kerala corroborates the f<strong>in</strong>d<strong>in</strong>g. Only <strong>in</strong> the case <strong>of</strong> Orissa do RBI<br />
actuals <strong>and</strong> RBI def<strong>in</strong>ition figures match, <strong>in</strong>dicat<strong>in</strong>g that MCR is <strong>in</strong>cluded <strong>in</strong> the GFD<br />
calculation for Orissa. This <strong>in</strong>troduces another dimension to this problem. If MCR<br />
2 RBI(2004) h<strong>and</strong>book on state f<strong>in</strong>ances is a compilation <strong>of</strong> previous volumes <strong>of</strong> ‘State F<strong>in</strong>ances- A study <strong>of</strong><br />
budgets’ s<strong>in</strong>ce 1998 <strong>and</strong> special supplements <strong>of</strong> RBI Bullet<strong>in</strong> prior to that. In many <strong>in</strong>stances, the data available is <strong>in</strong><br />
terms <strong>of</strong> revised estimates, as had been given <strong>in</strong> the previous volumes, <strong>and</strong> a revision to update these estimates to<br />
actuals has not been attempted. Examples <strong>in</strong>clude data for Bihar between 1990-91 <strong>and</strong> 1994-95; <strong>and</strong> 1999-2000 to<br />
2001-02, J&K from 1990-91 to 1997-98 <strong>and</strong> 2001-02.<br />
4
<strong>in</strong>clusion or exclusion is not consistent across all states, comparison <strong>of</strong> GFD across<br />
states on this criterion could be erroneous sometimes to a large extent. For example,<br />
the value <strong>of</strong> MCR for Orissa <strong>in</strong> the year 1998-99 is Rs.500 crores which is about 17% <strong>of</strong><br />
the correct GFD figure. In order to ensure comparability <strong>and</strong> consistency, we have,<br />
therefore, recalculated GFD for all states us<strong>in</strong>g the RBI def<strong>in</strong>ition given above. We<br />
report these estimates <strong>in</strong> Table 2.<br />
[Table 2 around here]<br />
Before we discuss measurement <strong>of</strong> debt consistent with the measure <strong>of</strong> fiscal<br />
deficit at the state level <strong>in</strong> the next section, we should consider the problem <strong>of</strong> the <strong>of</strong>fbudget<br />
borrow<strong>in</strong>g by several states through their Special Purpose Vehicles (SPVs).<br />
The states have borrowed heavily from the non-RBI, non-government sources through<br />
their SPVs without show<strong>in</strong>g such borrow<strong>in</strong>gs <strong>in</strong> their state budgets (GoI, 2003). S<strong>in</strong>ce<br />
these SPVs have no <strong>in</strong>dependent means to repay the debt all these liabilities are<br />
ultimately transferred to the respective states. Conceptually, the fiscal deficit <strong>in</strong> the year<br />
<strong>in</strong> which the SPV borrow<strong>in</strong>g occurs should rise by the same amount so that the liabilities<br />
are automatically adjusted. However, <strong>in</strong> practice, different states are follow<strong>in</strong>g their own<br />
account<strong>in</strong>g systems ultimately to br<strong>in</strong>g the matter <strong>in</strong>to the state budget over time. In<br />
several cases, states have started mak<strong>in</strong>g provisions <strong>in</strong> their budgets or started <strong>in</strong>ject<strong>in</strong>g<br />
equities <strong>in</strong>to the SPVs to take care <strong>of</strong> the future liabilities. All this would <strong>in</strong>crease the<br />
fiscal deficits <strong>in</strong> the current years. Thus, if we make adjustment <strong>in</strong> the upward direction<br />
<strong>in</strong> the past fiscal deficits, we must adjust the current <strong>and</strong> the future deficits downwards.<br />
S<strong>in</strong>ce all such details <strong>of</strong> provisions <strong>and</strong> transactions are not readily available, it is safer<br />
to ignore adjustments <strong>in</strong> the fiscal deficits <strong>of</strong> the past.<br />
3. <strong>Measurement</strong> <strong>of</strong> Total Liabilities or <strong>Debt</strong> <strong>of</strong> <strong>States</strong><br />
<strong>Fiscal</strong> <strong>Deficit</strong> is the overall gap <strong>in</strong> the expenditure <strong>and</strong> revenue <strong>of</strong> the government <strong>and</strong>,<br />
therefore, represents a liability that can be covered either by borrow<strong>in</strong>g or through<br />
monetization. Thus,<br />
1) GFD = DFD + MFD<br />
Where DFD: <strong>Deficit</strong> F<strong>in</strong>anced by <strong>Debt</strong> i.e., <strong>Debt</strong>-F<strong>in</strong>anced <strong>Deficit</strong>; <strong>and</strong><br />
5
MFD: <strong>Deficit</strong> f<strong>in</strong>anced by <strong>in</strong>creased liquidity, i.e., Money-F<strong>in</strong>anced <strong>Deficit</strong><br />
or Quasi-Money-F<strong>in</strong>anced <strong>Deficit</strong>.<br />
The central government has both the options available with it while a state government<br />
is constra<strong>in</strong>ed with respect to the latter because it does not have access to seigniorage.<br />
However, it does not mean that MFD is nil for state governments. Suri (2000) contends<br />
that the money f<strong>in</strong>anc<strong>in</strong>g <strong>in</strong> the context <strong>of</strong> states would comprise changes <strong>in</strong> the<br />
follow<strong>in</strong>g elements: 1) Cash balances; 2) WMA <strong>and</strong> overdrafts from RBI; 3) Net sale <strong>of</strong><br />
securities held by states <strong>in</strong> their <strong>in</strong>vestment account; <strong>and</strong> 4) Encashment <strong>of</strong> securities<br />
held <strong>in</strong> revenue funds. There are ‘<strong>in</strong>vestment accounts’ appear<strong>in</strong>g as sub-heads <strong>in</strong><br />
F<strong>in</strong>ance Accounts statements <strong>of</strong> state governments as part <strong>of</strong> the reserve fund, deposits<br />
& advances, s<strong>in</strong>k<strong>in</strong>g fund <strong>and</strong> as ‘cash balance <strong>in</strong>vestment account’ under suspense &<br />
miscellaneous head. These <strong>in</strong>vestments are generally <strong>in</strong> statutory corporations,<br />
government companies, cooperative <strong>in</strong>stitutions, etc. <strong>and</strong> not <strong>in</strong> Government <strong>of</strong> <strong>India</strong><br />
securities. It is the sale <strong>of</strong> only Government <strong>of</strong> <strong>India</strong> securities held by RBI on behalf <strong>of</strong><br />
the state governments that would qualify as monetization. This sale comes <strong>in</strong>to effect<br />
automatically once the general cash balance <strong>of</strong> a state government falls below the<br />
stipulated m<strong>in</strong>imum 3 . Thus, changes <strong>in</strong> general cash balance would reflect items 3 & 4<br />
given above. Thus, what rema<strong>in</strong>s under MFD at state level is reduction <strong>in</strong> cash<br />
balances <strong>and</strong> WMA <strong>and</strong> overdrafts from RBI 4 .<br />
[Table 3 around here]<br />
Our next step will be to exam<strong>in</strong>e how significant is MFD <strong>in</strong> f<strong>in</strong>anc<strong>in</strong>g state<br />
government deficits. We need to def<strong>in</strong>e ‘<strong>Fiscal</strong> Liabilities’ for this purpose. Here aga<strong>in</strong><br />
we f<strong>in</strong>d marked differences <strong>in</strong> the def<strong>in</strong>itions <strong>of</strong> ‘fiscal liabilities’ as followed by State<br />
Governments, CAG study (2003), RBI <strong>and</strong> the Eleventh F<strong>in</strong>ance Commission (11 th F.C).<br />
Table 3 provides an illustration for Gujarat. We can see that <strong>in</strong>cremental fiscal liabilities<br />
do not match with GFD figures (given by RBI <strong>and</strong> CAG Office) for any <strong>of</strong> the years.<br />
Among these sources, the figure under ‘net provision <strong>of</strong> funds’ as given <strong>in</strong> the<br />
Statement 15 <strong>of</strong> F<strong>in</strong>ance Accounts is the closest to the GFD value. The mismatch<br />
3 See, Explanatory Notes, Statement No. 7, F<strong>in</strong>ance Accounts, CAG Office publication.<br />
4<br />
That is precisely what the RBI Staff Study, Pattnaik et al. (1999) has stated <strong>in</strong> note 11 p.33.<br />
6
could be either due to an <strong>in</strong>correct def<strong>in</strong>ition <strong>of</strong> deficit <strong>and</strong> debt or if there was a<br />
component <strong>of</strong> money f<strong>in</strong>ance <strong>in</strong> the deficit. We exam<strong>in</strong>ed the data closely for all these<br />
possibilities <strong>and</strong> after correct<strong>in</strong>g for the erroneous exclusion <strong>of</strong> MCR <strong>in</strong> GFD calculation<br />
by RBI, found that the follow<strong>in</strong>g sources f<strong>in</strong>anced GFD:<br />
Statement 1: Provision <strong>of</strong> funds (RBI data)<br />
A Add (From Appendix III)<br />
1. Internal debt (receipts)<br />
2. Loans from the centre (receipts)<br />
3. Increase <strong>in</strong> WMA <strong>and</strong> overdrafts from RBI 5<br />
4. Cont<strong>in</strong>gency fund (net)<br />
5. Small sav<strong>in</strong>gs, provident fund etc. (net)<br />
6. Reserve funds (net)<br />
7. Deposits <strong>and</strong> advances (net)<br />
8. Suspense <strong>and</strong> misc. (net) 6<br />
9. Remittances (net)<br />
B Subtract (From Appendix IV)<br />
10. Repayment <strong>of</strong> <strong>in</strong>ternal debt<br />
11 Discharge <strong>of</strong> central loans<br />
Total <strong>Debt</strong> <strong>and</strong> other obligations<br />
C Subtract (From Appendix IV)<br />
1. Increase <strong>in</strong> cash<br />
2. Increase <strong>in</strong> cash <strong>in</strong>vestment balance<br />
Net Provision <strong>of</strong> Funds<br />
D Add 7 (From Appendix III)<br />
1. Inter-state settlement<br />
2. Appropriation to cont<strong>in</strong>gency fund<br />
=> Provision <strong>of</strong> funds = Gross <strong>Fiscal</strong> <strong>Deficit</strong><br />
5 Item 3 is required to be added if we are us<strong>in</strong>g RBI data. CAG data already <strong>in</strong>cludes WMA <strong>and</strong><br />
overdrafts, hence this step is not required. RBI gives this <strong>in</strong>formation <strong>in</strong> Annexure IV (last item)<br />
6 We may note that RBI figure <strong>in</strong>cludes Cash Investment Balance already. It is subtracted later when<br />
calculat<strong>in</strong>g fiscal deficit. Thus, <strong>in</strong>vestment balance has no effect on fiscal deficit<br />
7 Items 1 & 2 under ‘D’ are a part <strong>of</strong> the Consolidated Fund Statement 16: Part1 <strong>of</strong> F<strong>in</strong>ance Accounts.<br />
Items 1 & 2 under ‘D’ are ‘closed to government accounts’. Accord<strong>in</strong>g to explanatory note 4, statement 8,<br />
F<strong>in</strong>ance Accounts, Gujarat 1997-98, ‘the amounts booked under revenue <strong>and</strong> capital heads <strong>and</strong> other<br />
transactions <strong>of</strong> government, the balances <strong>of</strong> which are not carried forward from year to year <strong>in</strong> the<br />
accounts are closed to a s<strong>in</strong>gle account called ‘Government Accounts’’. Amount appropriated to the<br />
cont<strong>in</strong>gency fund is closed by a net credit entry <strong>in</strong> the cont<strong>in</strong>gency fund. This transfer implies an <strong>in</strong>crease<br />
<strong>in</strong> the clos<strong>in</strong>g balance <strong>of</strong> cont<strong>in</strong>gency fund <strong>and</strong>, therefore, is reflected as an additional liability. For the<br />
state <strong>of</strong> Gujarat, Item 1 under ‘C’ comprises recoveries from/payments to Maharashtra aris<strong>in</strong>g out <strong>of</strong> the<br />
Bombay Reorganization Act, 1960 adjusted under the head “Inter State Settlement” <strong>and</strong> is shown under<br />
“E – Miscellaneous” <strong>of</strong> F<strong>in</strong>ance Accounts for the purpose <strong>of</strong> clos<strong>in</strong>g. While it does form a part <strong>of</strong> the fiscal<br />
deficit, it does not <strong>in</strong>duce additional liability on the government. Thus, both the items under ‘C’ would not<br />
classify as additional debt for the subsequent years but would be added to bridge the GFD <strong>in</strong> the current<br />
year.<br />
7
The above statement has been applied to 25 states for a 15 year period (1989-90 to<br />
2003-04). It can be seen that there is an almost exact match between the ‘Provision <strong>of</strong><br />
funds’ as given by Statement 1 <strong>and</strong> Gross <strong>Fiscal</strong> <strong>Deficit</strong> values (RBI Actuals corrected<br />
for MCR) for all the years under consideration. This perfect match<strong>in</strong>g <strong>of</strong> the correct<br />
GFD estimate with an aggregate from the F<strong>in</strong>ance Accounts <strong>of</strong> the state government is<br />
a precondition for first def<strong>in</strong><strong>in</strong>g <strong>and</strong> then measur<strong>in</strong>g the theoretically consistent <strong>and</strong><br />
appropriate concept <strong>of</strong> debt at the state level. After all, debt must have a well-def<strong>in</strong>ed<br />
l<strong>in</strong>k with the fiscal deficit. Aga<strong>in</strong>, the l<strong>in</strong>k is not <strong>of</strong> a ‘stock <strong>and</strong> flow’ nature as generally<br />
assumed <strong>in</strong> the simplified expositions. This is because<br />
GFD = DFD + MFD (as stated earlier)<strong>and</strong> it is only DFD that adds to the debt <strong>of</strong> a state.<br />
It is, therefore, important to get estimates <strong>of</strong> money f<strong>in</strong>anced or quasi-money f<strong>in</strong>anced<br />
deficits for different years for all the states. We present these estimates <strong>in</strong> Table 4<br />
along with the debt f<strong>in</strong>anced deficits.<br />
[Table 4 around here]<br />
Now we are <strong>in</strong> a position to generate consistent estimates <strong>of</strong> liabilities <strong>of</strong> the state<br />
governments over time because<br />
2) ∆ D t = DFD t = D t – D t-1<br />
where D t is debt or liabilities <strong>of</strong> the state government at the end <strong>of</strong> the year t <strong>and</strong><br />
DFD t is the debt f<strong>in</strong>anced deficit dur<strong>in</strong>g the year t.<br />
3) ∴D t = D t-1 + DFD t<br />
It is clear from equation (3) that we need an estimate <strong>of</strong> the stock <strong>of</strong> debt <strong>in</strong> any<br />
one year <strong>and</strong> a cont<strong>in</strong>uous time series <strong>of</strong> DFD for each <strong>of</strong> the states. It is possible to<br />
get the consistent estimate <strong>of</strong> debt to our concept <strong>of</strong> the debt f<strong>in</strong>anced deficit from the<br />
F<strong>in</strong>ance Accounts <strong>of</strong> a state us<strong>in</strong>g the above method <strong>and</strong> the follow<strong>in</strong>g precise def<strong>in</strong>ition<br />
<strong>of</strong> debt (or outst<strong>and</strong><strong>in</strong>g liabilities). Outst<strong>and</strong><strong>in</strong>g Liabilities = <strong>in</strong>ternal debt+ loans from<br />
the centre + small sav<strong>in</strong>gs+ deposits <strong>and</strong> advances+ cont<strong>in</strong>gency fund + reserve fund+<br />
remittances+ suspense <strong>and</strong> miscellaneous.<br />
We have, thus, generated estimates <strong>of</strong> debt or liabilities <strong>of</strong> all state governments,<br />
<strong>and</strong> report them <strong>in</strong> Table 5. [Table 5 around here]<br />
8
4. Some Implications <strong>of</strong> Estimates <strong>of</strong> <strong>Debt</strong><br />
It is possible to work out the effective <strong>in</strong>terest rates for every state over the last fifteen<br />
years once we have the estimates <strong>of</strong> liabilities or debt <strong>of</strong> states. The effective <strong>in</strong>terest<br />
rate is calculated as the ratio <strong>of</strong> actual <strong>in</strong>terest payment dur<strong>in</strong>g a year to the stock <strong>of</strong><br />
debt at the beg<strong>in</strong>n<strong>in</strong>g <strong>of</strong> the year. Table 6 presents the effective <strong>in</strong>terest rates for all 25<br />
states over the years 1989-90 to 2003-04. We can see from the table that effective<br />
<strong>in</strong>terest rates have <strong>in</strong>creased substantially <strong>in</strong> all non-special category (NSC) states<br />
except Maharashtra, where it has substantially decl<strong>in</strong>ed over the period. In the special<br />
category states, effective <strong>in</strong>terest rates are highly fluctuat<strong>in</strong>g, but on the whole, show a<br />
rise <strong>in</strong> all states except Arunachal, Meghalaya, Nagal<strong>and</strong> <strong>and</strong> Sikkim. The annual<br />
fluctuations <strong>in</strong> the effective <strong>in</strong>terest rates might be on account <strong>of</strong> delayed <strong>in</strong>terest<br />
payments gett<strong>in</strong>g bunched or deferment <strong>in</strong> the <strong>in</strong>terest payment dur<strong>in</strong>g a year by the<br />
state.<br />
[Table 6 around here]<br />
We can also see from Table 6 that the NSC states have lower effective <strong>in</strong>terest<br />
rates on their debt compared to the SC states dur<strong>in</strong>g the last couple <strong>of</strong> years. If the<br />
nom<strong>in</strong>al growth <strong>of</strong> a state economy is higher than the effective <strong>in</strong>terest rate on the debt,<br />
the state is fiscally susta<strong>in</strong>able (see, Moorthy et al, 2000). Thus, the NSC states have a<br />
significantly greater probability <strong>of</strong> fiscal susta<strong>in</strong>ability than the SC states, if we apply the<br />
conventional criterion <strong>of</strong> susta<strong>in</strong>ability. Proper estimation <strong>of</strong> debt plays an important<br />
determ<strong>in</strong><strong>in</strong>g role for fiscal susta<strong>in</strong>ability <strong>of</strong> a state because the effective <strong>in</strong>terest rate<br />
depends on the stock <strong>of</strong> debt when an actual <strong>in</strong>terest payment <strong>in</strong> the numerator is<br />
given. Similarly, the growth rate <strong>of</strong> the state <strong>in</strong>come is also given. Thus, more reliable<br />
<strong>and</strong> consistent are the estimates <strong>of</strong> debt <strong>of</strong> states, the more accurate would be the<br />
assessment <strong>of</strong> fiscal susta<strong>in</strong>ability <strong>of</strong> states (see, Dholakia, 2003).<br />
Another <strong>in</strong>terest<strong>in</strong>g use <strong>of</strong> the estimates <strong>of</strong> debt is to f<strong>in</strong>d share <strong>of</strong> each state <strong>in</strong><br />
the total debt <strong>of</strong> states. Table 7 provides those shares over the fifteen year period. We<br />
can see that the share <strong>of</strong> NSC states together is ris<strong>in</strong>g from 90% <strong>in</strong> 1988-89 to 93.5% <strong>in</strong><br />
2003-04, <strong>and</strong> the share <strong>of</strong> SC states is correspond<strong>in</strong>gly fall<strong>in</strong>g. The fall <strong>in</strong> the share <strong>of</strong><br />
the SC states is primary on account <strong>of</strong> substantial fall <strong>in</strong> a s<strong>in</strong>gle state, Jammu &<br />
Kashmir. Among the NSC states, five states – Gujarat, Kerala, Maharashtra, Tamil<br />
Nadu <strong>and</strong> West Bengal – showed marked <strong>in</strong>crease <strong>in</strong> their share over the period.<br />
9
[Table 7 around here]<br />
The <strong>in</strong>crease <strong>in</strong> the share <strong>of</strong> Maharashtra <strong>and</strong> West Bengal is <strong>of</strong> the order <strong>of</strong> 7 <strong>and</strong> 4<br />
percentage po<strong>in</strong>ts. The three states <strong>of</strong> Bihar, M.P. <strong>and</strong> U.P., even after disregard<strong>in</strong>g<br />
their bifurcation, have experienced a significant reduction <strong>in</strong> their debt-share. We need<br />
to exam<strong>in</strong>e whether these trends are due to the states’ own fiscal behaviour or due to<br />
the central transfers to states.<br />
Table 8 provides shares <strong>of</strong> each state <strong>in</strong> the total primary deficit on own account<br />
(PDOA). PDOA captures a state’s fiscal behaviour comprehensively s<strong>in</strong>ce it considers<br />
all expenditures other than <strong>in</strong>terest payment <strong>and</strong> only the state’s own revenues. Goa,<br />
Haryana, Kerala, Orissa, Punjab, Tamil Nadu <strong>and</strong> to a certa<strong>in</strong> extent U.P., show an<br />
improvement <strong>in</strong> their relative fiscal behaviour till 2002-03. The behaviour is markedly<br />
different for many states <strong>in</strong> 2003-04, possibly due to power sector restructur<strong>in</strong>g <strong>in</strong> these<br />
states. There is a clear deterioration <strong>in</strong> Bihar, Gujarat, M.P <strong>and</strong> Rajasthan while West<br />
Bengal, which showed substantial deterioration <strong>in</strong> fiscal behaviour till 2001-02, appears<br />
to have improved <strong>in</strong> the last two years (2002-04 estimates). The NSC states together<br />
show deterioration <strong>and</strong> SC states show improvement <strong>in</strong> their fiscal behaviour. We must<br />
consider these f<strong>in</strong>d<strong>in</strong>gs along with the behaviour <strong>of</strong> the central transfers.<br />
[Table 8 around here]<br />
Table 9 provides share <strong>of</strong> each state <strong>in</strong> the central transfers for the last fifteen<br />
years. It is clear that Andhra Pradesh, Bihar, Karnataka, M.P., Punjab <strong>and</strong>, to some<br />
extent, West Bengal have experienced significant <strong>in</strong>crease <strong>in</strong> their share, whereas Goa,<br />
Kerala, Maharashtra, Orissa, Rajasthan <strong>and</strong> Tamil Nadu have shown a sharp decl<strong>in</strong>e.<br />
Between the SC <strong>and</strong> NSC states, the central transfers have ma<strong>in</strong>ta<strong>in</strong>ed, on an<br />
average,the same proportion. [Table 9 around here]<br />
Consider<strong>in</strong>g Tables 7, 8 <strong>and</strong> 9 together, we can say that reduced share <strong>of</strong> debt <strong>in</strong><br />
AP, Bihar <strong>and</strong> M.P. is <strong>in</strong> spite <strong>of</strong> their deteriorated fiscal behaviour <strong>and</strong> ma<strong>in</strong>ly on<br />
account <strong>of</strong> <strong>in</strong>creased share <strong>of</strong> central transfers to these states. Similarly, Assam <strong>and</strong><br />
Jammu & Kashmir among the SC states managed a reduction <strong>in</strong> their share <strong>in</strong> debt<br />
only because <strong>of</strong> significant <strong>in</strong>crease <strong>in</strong> their share <strong>in</strong> the central transfers. On the other<br />
h<strong>and</strong>, Goa, Haryana <strong>and</strong> Orissa have managed to reduce their share <strong>in</strong> the debt <strong>in</strong> spite<br />
<strong>of</strong> marg<strong>in</strong>al reduction <strong>in</strong> their share <strong>in</strong> the central transfers largely because <strong>of</strong> their<br />
10
elatively better fiscal behaviour. In case <strong>of</strong> Karnataka, Punjab <strong>and</strong> U.P, both the<br />
factors have favourably contributed to the reduction <strong>in</strong> its share <strong>in</strong> the debt.<br />
Among the states experienc<strong>in</strong>g a significant rise <strong>in</strong> the share <strong>of</strong> debt, Kerala <strong>and</strong> Tamil<br />
Nadu show<strong>in</strong>g considerable relative improvement <strong>in</strong> their fiscal behaviour have still<br />
suffered because <strong>of</strong> substantial fall <strong>in</strong> their share <strong>of</strong> the central transfers. Although both<br />
Maharashtra <strong>and</strong> West Bengal have experienced sharp <strong>in</strong>crease <strong>in</strong> their share <strong>in</strong> the<br />
debt, their cases are diametrically opposite. While there has been a substantial fall <strong>in</strong><br />
the share <strong>of</strong> central transfers to Maharashtra, West Bengal has experienced a<br />
significant <strong>in</strong>crease <strong>in</strong> its share. The relative fiscal behaviour has been more or less the<br />
same <strong>in</strong> Maharashtra over the years, whereas it has substantially deteriorated <strong>in</strong> West<br />
Bengal.<br />
Conclud<strong>in</strong>g Remarks<br />
Slow<strong>in</strong>g down <strong>of</strong> economic growth <strong>and</strong> high level <strong>of</strong> effective <strong>in</strong>terest rate on debt has<br />
played havoc with the debt situation <strong>of</strong> states after the mid-n<strong>in</strong>eties <strong>in</strong> <strong>India</strong>. State<br />
specific factors like natural disasters have also contributed to this trend. However,<br />
grow<strong>in</strong>g fiscal <strong>in</strong>discipl<strong>in</strong>e <strong>and</strong> changes <strong>in</strong> central transfers <strong>in</strong> several cases have also<br />
played an important role <strong>in</strong> determ<strong>in</strong><strong>in</strong>g the debt position <strong>of</strong> states. S<strong>in</strong>ce theoretically<br />
consistent measurement <strong>of</strong> debt is a pre-condition for analys<strong>in</strong>g the problem, we have<br />
attempted such estimation <strong>of</strong> debt <strong>and</strong> deficits <strong>of</strong> all the states over the last fifteen<br />
years. Effective <strong>in</strong>terest rates based on such estimates <strong>of</strong> debt provide clues about the<br />
required economic growth <strong>in</strong> a state for the fiscal susta<strong>in</strong>ability <strong>of</strong> debt <strong>in</strong> the state.<br />
Primary deficit on own account (PDOA) reflect<strong>in</strong>g the fiscal behaviour <strong>of</strong> a state <strong>and</strong> the<br />
transfer <strong>of</strong> resources from the centre, are critical factors determ<strong>in</strong><strong>in</strong>g fiscal deficits <strong>of</strong><br />
states. With our measurement <strong>of</strong> debt, the behaviour <strong>of</strong> fiscal deficit over time would<br />
directly affect the debt position <strong>of</strong> a state. Thus, better underst<strong>and</strong><strong>in</strong>g <strong>and</strong> empirical<br />
<strong>in</strong>vestigation <strong>in</strong>to the problem become possible. S<strong>in</strong>ce our measurement <strong>of</strong> debt<br />
ensures theoretical consistency, we hope that econometric modell<strong>in</strong>g would yield<br />
mean<strong>in</strong>gful results.<br />
11
REFERENCES<br />
CAG (2002): State F<strong>in</strong>ances – A Critical Appraisal, International Centre for Information<br />
System <strong>and</strong> Audit (iCISA), Office <strong>of</strong> Comptroller & Auditor General <strong>of</strong> <strong>India</strong>,<br />
January.<br />
Dholakia, Rav<strong>in</strong>dra H. (2003): “<strong>Measurement</strong> Issues <strong>in</strong> Compar<strong>in</strong>g <strong>Fiscal</strong> Performance<br />
<strong>of</strong> <strong>States</strong>,” Economic & Political Weekly, Vol.38, No.10, March 8.<br />
11 th F<strong>in</strong>ance Commission (2000): Report <strong>of</strong> the Eleventh F<strong>in</strong>ance Commission,<br />
Presented to Government <strong>of</strong> <strong>India</strong> on 27 th July.<br />
Government <strong>of</strong> <strong>India</strong> (2003): Report <strong>of</strong> the Committee to Suggest Steps on State<br />
Government Guarantees, M<strong>in</strong>istry <strong>of</strong> F<strong>in</strong>ance, June.<br />
Moorty, Vivek., Bhupal S<strong>in</strong>gh <strong>and</strong> Sharat Ch<strong>and</strong>ra Dhal (2000): “Bond F<strong>in</strong>anc<strong>in</strong>g <strong>and</strong><br />
<strong>Debt</strong> Stability: Theoretical Issues <strong>and</strong> Empirical Analysis for <strong>India</strong>,” Study No.19,<br />
Development Research Group, DEAP, Reserve Bank <strong>of</strong> <strong>India</strong>, June 10.<br />
Pattnaik, R.K., Pillai, S.M. <strong>and</strong> Das, Sangeeta (1999): “Budget <strong>Deficit</strong> <strong>in</strong> <strong>India</strong>: A Primer<br />
on <strong>Measurement</strong>,” RBI Staff Studies # SS (DEAP) 1/99, DEAP, RBI (Mumbai)<br />
June.<br />
Rangarajan, C. <strong>and</strong> D.K. Srivastava (2003): “Dynamics <strong>of</strong> <strong>Debt</strong> Accumulation <strong>in</strong> <strong>India</strong>:<br />
Impact <strong>of</strong> Primary <strong>Deficit</strong>, Growth <strong>and</strong> Interest Rate,” Economic <strong>and</strong> Political<br />
Weekly, Vol.38, No. 46, Nov. 15, pp.4851 – 4855.<br />
RBI (2004): H<strong>and</strong>book <strong>of</strong> Statistics on State Government F<strong>in</strong>ances<br />
RBI (2003): State F<strong>in</strong>ances: A Study <strong>of</strong> Budgets <strong>of</strong> 1999-2000 to 2002-03, Mumbai; <strong>and</strong><br />
RBI Bullet<strong>in</strong>, February 1999 Supplement on F<strong>in</strong>ances <strong>of</strong> State Governments:<br />
1998-99.<br />
Shr<strong>of</strong>f, Manu., Dholakia, Rav<strong>in</strong>dra H., Sharma, Atul., Sarma, J.V.M. <strong>and</strong> others (2002):<br />
Report on <strong>Fiscal</strong> Consolidation <strong>in</strong> Gujarat – A Medium Term Plan, State Public<br />
F<strong>in</strong>ance Reforms Committee, Government <strong>of</strong> Gujarat, G<strong>and</strong>h<strong>in</strong>agar, December.<br />
Suri, M.M. (2000): <strong>Fiscal</strong> Policy Developments <strong>in</strong> <strong>India</strong> (1952 to 2000), <strong>India</strong>n Tax<br />
Institute, Delhi.<br />
12
Sr.<br />
No.<br />
Table 1: State wise Comparison <strong>of</strong> Gross <strong>Fiscal</strong> <strong>Deficit</strong>: RBI V/s CAG Office Publication<br />
(In Rs. Crore)<br />
1996-97 1997-98 1998-99 1999-00 2000-01<br />
Non Special<br />
Category <strong>States</strong> RBI CAG RBI CAG RBI CAG RBI CAG RBI CAG<br />
1 Andhra Pradesh 2812 2811 2428 2428 5706 5705 4976 4976 7306 7306<br />
2 Bihar 891 1347 981 2239 2379 3660 6108 5996 4884 6085<br />
3 Goa 104 97 125 125 269 269 341 341 413 413<br />
4 Gujarat 2358 2359 3175 3174 5619 5618 6792 6721 7988 7987<br />
5 Haryana 1099 1100 1128 1127 2240 2240 2133 2132 2265 2265<br />
6 Karnataka 1944 1945 1610 1610 3112 3112 4277 4276 4219 4219<br />
7 Kerala 1543 1543 2414 2414 3012 3012 4537 4536 3878 3878<br />
8 Madhya Pradesh 1926 1925 1821 1820 4127 4129 3911 3911 2712 4188<br />
9 Maharashtra 4954 4954 6442 6442 7462 7462 11706 11706 8976 8976<br />
10 Orissa 1602 1795 1803 1801 2916 3419 3746 3746 3325 3325<br />
11 Punjab 1465 1465 2478 2478 3779 3780 3195 3194 3904 3904<br />
12 Rajasthan 2507 2507 2552 2552 5151 5151 5361 5361 4313 4312<br />
13 Tamil Nadu 2445 2445 2122 2122 4777 4777 5382 5382 5076 5077<br />
14 Uttar Pradesh 5956 5955 7576 7577 11633 11633 11099 11098 10180 12359<br />
15 West Bengal 3397 3397 4008 4008 7109 7110 11666 11657 10920 10920<br />
Special Category <strong>States</strong><br />
1 Arunachal Pradesh 70 72 121 122 55 56 59 89 210 284<br />
2 Assam 74 74 142 142 338 338 1606 1606 1540 1540<br />
3 Himachal Pradesh 572 572 1202 1203 1662 1662 190 189 1845 1845<br />
4 Jammu & Kashmir 166 954 444 501 1054 1054 1339 1338 2166 1873<br />
5 Manipur 168 157 188 190 106 108 656 644 234 227<br />
6 Meghalaya 23 23 127 126 147 147 209 209 250 249<br />
7 Mizoram 125 136 124 163 132 99 179 214 375 375<br />
8 Nagal<strong>and</strong> 184 137 204 265 243 185 249 183 359 271<br />
9<br />
Sikkim 56 55 67 66 147 147 93 92 51 51<br />
10 Tripura 122 122 196 196 118 118 290 291 445 445<br />
13
Sr.<br />
No.<br />
Non Special Category<br />
<strong>States</strong><br />
Table 2: <strong>Consistent</strong> <strong>and</strong> Comparable Estimates <strong>of</strong> GFD for <strong>States</strong> (Rs. Crores)<br />
89-90 90-91 91-92 92-93 93-94 94-95 95-96 96-97 97-98 98-99 99-00 00-01 01-02 02-03 03-04<br />
1 Andhra Pradesh 972 967 1125 1484 1833 2349 2417 2811 2428 5705 4976 7306 6723 7692 7528<br />
2 Bihar 993 1595 1617 1330 1339 1342 1571 1347 2239 3660 5996 4075 608 4911 4257<br />
3 Goa 97 96 125 79 60 45 97 103 125 269 341 413 419 426 429<br />
4 Gujarat 953 1799 1791 1151 525 1292 1746 2359 3002 5617 6705 7965 6509 6028 9894<br />
5 Haryana 392 386 375 444 480 535 986 1100 1127 2241 2132 2264 2740 1471 2135<br />
6 Karnataka 633 558 918 1386 1254 1513 1457 1945 1610 3112 4276 4219 5870 5564 3757<br />
7 Kerala 604 798 803 733 936 1109 1302 1543 2408 3009 4535 3878 3269 4994 5654<br />
8 Madhya Pradesh 724 1019 984 876 839 1377 1633 1925 1820 4129 3911 3539 3649 4569 4120<br />
9 Maharashtra 1843 1610 1657 2686 2265 2861 4153 4954 6444 7463 11406 8976 10898 14290 19477<br />
10 Orissa 573 617 912 740 902 1158 1397 1602 1801 2924 3746 3325 3968 2816 5495<br />
11 Punjab 909 1242 736 1252 1493 1785 1365 1465 2478 3779 3194 3904 4959 4772 5319<br />
12 Rajasthan 581 544 792 818 1467 1763 2574 2507 2552 5152 5361 4312 5748 6605 7559<br />
13 Tamil Nadu 920 1126 1300 1749 1358 1496 1256 2446 2122 4777 5382 5058 4699 6028 6944<br />
14 Uttar Pradesh 2481 3068 2838 3711 3166 4793 4379 5955 7577 11633 11098 10177 9911 9497 20414<br />
15 West Bengal 1055 1634 1144 1013 1672 1965 2696 3397 4008 7110 11657 10920 11804 10569 13325<br />
Special Category <strong>States</strong><br />
1 Assam 527 568 253 208 -18 711 654 73 143 339 1606 1541 1448 928 3772<br />
2 Arunachal 75 26 -20 -9 16 73 40 72 123 57 71 282 247 169 71<br />
3 Himachal Pradesh 227 279 266 312 152 620 521 572 1203 1662 189 1845 1513 2345 2502<br />
4 Jammu & Kashmir 524 661 449 203 68 -23 97 166 402 1054 1338 1873 1474 214 605<br />
5 Manipur 70 40 69 18 -20 62 105 157 189 106 644 225 340 451 296<br />
6 Meghalaya 30 41 72 93 88 35 52 23 125 147 209 249 221 381 291<br />
7 Mizoram -3 -94 5 69 8 38 71 134 161 98 214 377 422 315 281<br />
8 Nagal<strong>and</strong> 141 102 96 138 174 239 231 133 262 194 192 273 337 392 312<br />
9 Sikkim 29 20 41 34 22 46 40 55 64 146 91 50 67 52 45<br />
10 Tripura 88 91 94 23 111 110 34 120 195 119 290 444 524 727 610<br />
14
Office/<br />
Department/<br />
Commission<br />
F<strong>in</strong>ance<br />
Accounts<br />
(CAG Office)<br />
Table3: <strong>Fiscal</strong> Liabilities <strong>and</strong> GFD – Comparison Among Various Publications for Gujarat State (All figures <strong>in</strong> Rs. Crore)<br />
Items<br />
31st Mar Dur<strong>in</strong>g 31st Mar Dur<strong>in</strong>g 31st Mar Dur<strong>in</strong>g 31st Mar Dur<strong>in</strong>g 31st Mar<br />
1997 97-98 1998 98-99 1999 99-2000 2000 00-01 2001<br />
<strong>Debt</strong> <strong>and</strong> Other Obligations 17175.13 3242.88 20418.01 5400.59 25818.6 6752.52 32571.12 8372.53 40943.65<br />
Deduct Cash Balance -6.58 79.7 73.12 -143.27 -70.15 123.63 53.48 406.73 460.21<br />
Deduct Investments 528.86 8.93 537.79 -74.16 463.63 -76.49 387.14 0.53 387.67<br />
Net Provision <strong>of</strong> funds 16652.85 3154.25 19807.1 5618.02 25425.12 6705.38 32130.5 7965.27 40095.77<br />
CAG Office<br />
Research Outst<strong>and</strong><strong>in</strong>g <strong>Fiscal</strong> Liabilities (CAG - Study) 17024 3115 20139 4618 24757 6804 31561 8446 40007<br />
Publication<br />
RBI Outst<strong>and</strong><strong>in</strong>g <strong>Fiscal</strong> Liabilities (RBI) 12784 2278 15062 3500 18562 4422 22984 6802 29786<br />
Government<br />
Outst<strong>and</strong><strong>in</strong>g <strong>Fiscal</strong> Liabilities (GOG)<br />
<strong>of</strong> Gujarat<br />
11976 2083 14059 3021 17080 3771 20851<br />
EFC<br />
Outst<strong>and</strong><strong>in</strong>g <strong>Fiscal</strong> Liabilities (EFC - <strong>in</strong>clud<strong>in</strong>g<br />
WMA advances <strong>and</strong> overdrafts from RBI)<br />
24757 4046 28804<br />
Outst<strong>and</strong><strong>in</strong>g <strong>Fiscal</strong> Liabilities (EFC - exclud<strong>in</strong>g<br />
WMA advances <strong>and</strong> overdrafts from RBI)<br />
19189 3486 22674<br />
GFD: CAG-Study 3174 5618 6721 7987<br />
GFD: RBI (Actuals) 3174 5619 6792 7987<br />
GFD: RBI Actuals corrected for MCR 3002 5617 6705 7965<br />
GFD: RBI Def<strong>in</strong>ition 3002 5617 6705 7965<br />
The def<strong>in</strong>itions <strong>of</strong> debt followed by these publications are as follows:<br />
CAG Study : Internal <strong>Debt</strong>+ Loans from the Centre+ Reserve Funds + Small Sav<strong>in</strong>gs & Provident Funds + Other<br />
obligations (Reserve Funds <strong>and</strong> Deposits & Advances etc. with some adjustments)<br />
Government <strong>of</strong> Gujarat : Internal <strong>Debt</strong> + Loans from the Centre<br />
EFC : Central loans + Market loans <strong>and</strong> bonds + Loans from Banks etc. + Provident funds + Reserve Funds <strong>and</strong><br />
Deposits + (WMA from RBI). Although EFC had stated two def<strong>in</strong>itions <strong>of</strong> debt, one with <strong>and</strong> the other without WMA,<br />
for calculation <strong>of</strong> ratios etc. the commission <strong>in</strong>cluded WMA as a part <strong>of</strong> debt.<br />
RBI : Internal loans (net) + Loans from the Centre (net) + Small Sav<strong>in</strong>gs <strong>and</strong> Provident Funds etc.<br />
15
Table 4: <strong>Debt</strong> F<strong>in</strong>anced <strong>and</strong> Money F<strong>in</strong>anced <strong>Deficit</strong>s for <strong>States</strong> (Rs. In Crores)<br />
DFD MFD DFD MFD DFD MFD DFD MFD DFD MFD DFD MFD DFD MFD DFD MFD<br />
Sr. Non Special<br />
No. Category <strong>States</strong><br />
89- 89- 90- 90- 91- 91- 92- 92- 93- 93- 94- 94- 95- 95- 96- 96-<br />
90 90 91 91 92 92 93 93 94 94 95 95 96 96 97 97<br />
1 AP 915 57 1031 -64 1100 25 1547 -63 1722 112 2290 59 2649 -232 2370 441<br />
2 Bihar 968 26 1413 181 1569 48 1288 42 1330 9 1342 0 850 721 1347 0<br />
3 Goa 98 -1 99 -3 123 2 94 -15 51 8 58 -13 85 12 116 -13<br />
4 Gujarat 1136 -183 1691 108 1776 15 1064 87 727 -201 1202 90 1809 -63 2364 -5<br />
5 Haryana 376 16 412 -26 437 -62 387 57 446 34 590 -55 1028 -42 1015 85<br />
6 Karnataka 660 -27 590 -31 877 41 1330 56 1243 11 1555 -42 1464 -7 1988 -44<br />
7 Kerala 677 -73 773 25 780 23 773 -40 1035 -100 1141 -32 1280 22 1497 46<br />
8 Maharashtra 1865 -22 1593 17 1700 -43 2664 21 2206 59 2623 238 4553 -400 4583 371<br />
9 Madhya Pradesh 896 -172 950 69 785 199 996 -120 908 -69 1536 -159 1499 135 2162 -237<br />
10 Orissa 449 124 785 -168 849 63 728 12 969 -67 1263 -105 1228 169 1458 144<br />
11 Punjab 901 8 1264 -22 816 -80 1184 68 1411 82 1643 142 1351 14 1793 -328<br />
12 Rajasthan 619 -38 440 104 1066 -274 988 -171 1339 128 1819 -56 2217 358 2284 223<br />
13 Tamil Nadu 1107 -187 1059 67 1155 145 1934 -185 1563 -205 1406 90 1370 -114 2462 -16<br />
14 Uttar Pradesh 2634 -153 3234 -166 2896 -58 3502 209 3028 138 4582 211 4827 -448 5628 327<br />
15 West Bengal 972 83 1742 -109 1058 86 1190 -177 1527 144 2199 -233 2773 -76 3476 -79<br />
Special Category <strong>States</strong><br />
1 Arunachal 88 -13 38 -13 -13 -7 15 -25 -48 64 30 43 36 3 32 39<br />
2 Assam 429 98 601 -33 246 7 225 -18 -133 115 2030 -1319 843 -189 41 32<br />
3 Himachal Pradesh 168 59 316 -38 231 35 203 109 299 -147 305 315 -35 556 658 -86<br />
4 Jammu & Kashmir 524 0 386 275 27 421 164 40 -56 123 -23 0 97 0 73 93<br />
5 Manipur 51 19 72 -32 43 26 13 6 12 -33 50 12 70 35 205 -48<br />
6 Meghalaya 38 -8 26 15 70 3 79 14 67 20 36 -1 60 -9 34 -12<br />
7 Mizoram 38 -41 -109 14 14 -9 63 6 6 2 43 -5 45 26 71 64<br />
8 Nagal<strong>and</strong> 100 41 69 33 34 62 10 128 180 -6 133 106 146 85 54 79<br />
9 Sikkim 22 7 37 -17 25 16 46 -12 21 0 47 -2 35 5 31 25<br />
10 Tripura 166 -77 93 -1 60 34 72 -49 97 14 130 -20 72 -38 74 46<br />
16
Table 5: Liabilities (<strong>Debt</strong>) <strong>of</strong> State Governments <strong>Consistent</strong> with <strong>Debt</strong> F<strong>in</strong>anced <strong>Deficit</strong>s (Rs. Crores)<br />
Sr.<br />
Non Special Category 88-89 89-90 90-91 91-92 92-93 93-94 94-95 95-96 96-97 97-98 98-99 99-00 00-01 01-02 02-03 03-04<br />
No.<br />
<strong>States</strong><br />
1 Andhra Pradesh 5979 7034 8065 9166 10712 12434 14723 17373 19746 22591 27954 33189 40161 47317 55009 62536<br />
2 Bihar 6644 7611 9025 10594 11882 13213 14555 15405 16933 19258 22148 28378 32072 31468 36126 41365<br />
3 Goa 585 682 781 904 998 1050 1107 1193 1311 1432 1699 2213 2635 3248 3663 4090<br />
4 Gujarat 4884 6019 7708 9484 10548 11277 12479 14287 16649 19883 25357 31958 39667 46078 52653 62546<br />
5 Haryana 2177 2553 2965 3402 3788 4234 4823 5851 6865 7963 10135 12168 14390 16819 18697 20942<br />
6 Karnataka 4124 4784 5374 6251 7581 8791 10346 11810 13798 15460 18515 22736 26922 32749 37842 41847<br />
7 Kerala 3335 3967 4740 5520 6293 7328 8468 9749 11245 13822 16539 21054 24511 28003 32996 38650<br />
8 Madhya Pradesh 5621 6517 7467 8252 9237 10145 11721 13220 15382 17494 21242 25232 28433 33705 38981 44042<br />
9 Maharashtra 4671 6537 8131 9831 12395 14602 17225 21776 26359 33126 40413 54131 63427 73394 87679 106333<br />
10 Orissa 3797 4231 5015 5866 6595 7564 8828 10055 11513 13590 15988 20013 22898 26436 29873 34450<br />
11 Punjab 5075 5977 7240 8056 9240 10652 12295 13645 15438 17718 20722 24544 28634 33386 37836 42720<br />
12 Rajasthan 5426 6045 6485 7552 8540 9878 11697 13914 16198 19159 23213 29025 33714 38857 45462 53022<br />
13 Tamil Nadu 4366 5478 6522 7901 9835 11398 12804 14174 16635 18769 23404 28527 33895 38590 43576 49480<br />
14 Uttar Pradesh 12551 15186 18419 21316 24818 27845 32428 37255 42883 50894 60244 69900 83885 93833 92089 96178<br />
15 West Bengal 5618 6590 8332 9390 10611 12139 14337 17110 20586 24672 31741 41918 52846 63824 74508 87634<br />
Special Category <strong>States</strong><br />
1 Assam 1580 2009 2609 2856 3081 2948 4977 5819 5861 5967 6369 7474 8891 9851 11550 13157<br />
2 Arunachal 99 187 226 212 228 180 210 247 279 424 450 575 866 1065 1228 1314<br />
3 Himachal Pradesh 1184 1352 1668 1899 2101 2400 2705 2670 3328 4394 5699 6737 8611 9975 11969 13755<br />
4 Jammu & Kashmir 4227 4751 5138 5165 5329 5273 5250 5346 5420 5370 6346 7838 9437 11113 11454 11946<br />
5 Manipur 217 268 340 383 395 406 456 526 689 767 813 1299 1738 1583 415 707<br />
6 Meghalaya 49 88 114 184 263 330 366 426 461 603 758 1005 1299 1463 1836 2120<br />
7 Mizoram 299 338 229 242 305 311 354 399 470 669 701 1024 1342 1654 2056 2240<br />
8 Nagal<strong>and</strong> 137 237 305 339 349 529 662 808 862 1022 1156 1503 1730 2118 2401 2614<br />
9 Sikkim 72 94 132 157 203 224 272 307 338 388 548 724 760 864 916 962<br />
10 Tripura 369 531 624 684 756 853 983 1056 1131 1251 1289 1600 1991 2476 3179 3816<br />
Note: Outst<strong>and</strong><strong>in</strong>g Liabilities = Internal <strong>Debt</strong>+ Loans from the Centre+ Small Sav<strong>in</strong>gs+ Deposits <strong>and</strong> Advances+ Cont<strong>in</strong>gency Fund+ Reserve Fund+ Remittances+ Suspense <strong>and</strong> Miscellaneous<br />
<strong>Debt</strong> figures for Bihar, MP <strong>and</strong> UP <strong>in</strong>clude the liabilities <strong>of</strong> Jharkh<strong>and</strong>, Chattiis garh <strong>and</strong> Uttaranchal respectively.<br />
17
Table 6: Trends <strong>in</strong> Interest Rates<br />
89-90 90-91 91-92 92-93 93-94 94-95 95-96 96-97 97-98 98-99<br />
AP 7.9 8.4 8.6 9.1 9.6 10.1 10.4 10.6 10.9 11.7 11.1 11.4 11.4 13.0 12.5<br />
Bihar 8.7 9.9 11.1 11.7 11.4 11.8 11.5 12.6 12.2 12.5 12.9 11.1 6.9 12.3 11.3<br />
Goa 4.4 4.4 7.3 6.5 6.8 6.6 8.1 8.5 9.0 10.1 10.5 9.6 9.7 8.9 8.2<br />
Gujarat 9.6 8.8 9.3 9.8 9.9 10.6 10.6 11.3 11.3 11.4 11.1 9.8 10.6 10.7 10.7<br />
Haryana 9.5 9.5 10.9 10.1 11.1 11.5 11.5 12.2 11.9 12.5 13.4 12.3 11.4 11.6 11.9<br />
Karnataka 8.5 9.1 9.6 9.5 9.5 9.9 10.1 10.2 10.1 10.5 10.9 10.5 10.0 10.2 9.6<br />
Kerala 8.8 8.6 10.2 9.8 10.9 11.2 10.9 11.3 11.4 10.5 11.7 10.7 9.9 10.4 10.0<br />
MP 7.7 7.9 8.1 9.0 9.4 10.8 9.9 10.4 10.8 10.5 10.1 9.6 10.1 9.8 9.8<br />
Maharashtra 16.2 13.5 14.3 13.6 15.3 15.0 11.9 11.2 11.0 11.1 12.1 9.7 10.1 9.7 9.7<br />
Orissa 8.2 8.6 9.6 9.2 10.4 10.4 10.5 10.7 11.2 10.9 11.5 11.4 12.4 10.9 11.0<br />
Punjab 4.6 5.6 5.0 5.1 11.3 11.7 12.1 12.0 12.0 13.1 12.7 9.5 11.1 10.5 9.2<br />
Rajasthan 8.1 8.2 9.5 9.8 10.4 10.5 10.5 11.2 11.7 11.7 12.2 11.5 11.5 11.1 10.5<br />
TN 8.4 8.3 8.5 8.7 9.7 9.6 10.1 10.4 10.6 11.3 11.6 11.0 10.4 10.7 10.4<br />
UP 8.3 8.4 9.3 9.6 8.5 11.1 10.3 10.9 13.3 10.8 10.9 10.7 10.2 7.8 12.4<br />
WB 9.4 9.5 9.9 10.3 11.0 10.9 11.3 11.3 11.7 12.0 13.2 12.5 12.1 12.4 12.7<br />
Assam 16.8 13.0 3.6 14.4 15.9 20.0 9.8 9.6 10.9 8.7 15.2 11.6 11.9 12.6 15.9<br />
Arunachal 16.8 8.3 9.5 10.3 12.1 19.2 20.1 21.5 21.5 16.7 17.8 21.0 12.6 12.3 12.3<br />
HP 7.4 8.2 8.9 9.3 10.0 9.3 10.5 11.7 11.2 11.3 10.5 11.8 12.1 16.7 15.7<br />
JK 5.0 4.6 7.5 7.0 5.2 10.9 8.4 3.9 15.0 12.4 13.3 9.8 11.1 10.4 10.0<br />
Manipur 8.6 11.4 9.2 11.6 12.4 12.7 12.6 12.5 11.5 11.9 16.2 13.6 11.0 12.5 9.7<br />
Meghalaya 23.0 20.3 18.8 13.7 12.7 13.6 13.8 13.1 13.0 11.5 12.7 11.3 10.2 11.5 10.3<br />
Mizoram 0.3 9.8 5.8 11.5 7.4 9.6 9.8 12.0 14.1 11.1 13.4 9.9 11.0 8.3 7.9<br />
Nagal<strong>and</strong> 26.2 18.4 17.6 17.1 17.6 15.1 12.0 11.1 13.1 13.2 13.2 11.8 11.6 12.0 11.3<br />
Sikkim 10.3 11.1 11.3 12.1 10.7 11.6 10.7 10.8 12.1 13.4 12.4 10.9 11.1 10.3 10.3<br />
Tripura 7.5 7.2 8.0 8.6 9.0 8.9 9.0 10.4 10.6 11.3 14.4 14.1 12.7 12.1 10.6<br />
To enable comparison over the entire period under consideration, values for the new states <strong>of</strong> Chattisgarh, Jharkh<strong>and</strong> <strong>and</strong> Uttaranchal have been comb<strong>in</strong>ed<br />
with those <strong>of</strong> their parent states M.P, Bihar <strong>and</strong> U.P respectively.<br />
99-<br />
2000<br />
2000-<br />
01<br />
2001-<br />
02<br />
2002-<br />
03<br />
2003-<br />
04<br />
(RE)<br />
18
Table 7: Proportion <strong>of</strong> the <strong>Debt</strong> <strong>of</strong> Each State <strong>in</strong> the Comb<strong>in</strong>ed <strong>Debt</strong> <strong>of</strong> these <strong>States</strong><br />
Total 88-89 100 100 89-90 90-91 100 91-92 100 92-93 100 93-94 100 94-95 100 2003-04<br />
95-96 100 96-97 100 97-98 100 98-99 100 99-2000 100 2000-01 100 2001-02 100 2002-03 100 100<br />
To enable comparison over the entire period under consideration, values for the new states <strong>of</strong> Chattisgarh, Jharkh<strong>and</strong> <strong>and</strong> Uttaranchal have been comb<strong>in</strong>ed with<br />
(RE)<br />
those <strong>of</strong><br />
their parent states M.P, Bihar <strong>and</strong> U.P respectively.<br />
AP 7.20 7.10 6.86 6.76 6.86 7.06 7.21 7.41 7.30 7.13 7.29 6.99 7.11 7.28 7.48 7.44<br />
Bihar 8.00 7.68 7.67 7.81 7.61 7.51 7.13 6.57 6.26 6.08 5.78 5.98 5.68 4.84 4.91 4.92<br />
Goa 0.70 0.69 0.66 0.67 0.64 0.60 0.54 0.51 0.48 0.45 0.44 0.47 0.47 0.50 0.50 0.49<br />
Gujarat 5.88 6.08 6.55 6.99 6.76 6.41 6.12 6.09 6.16 6.28 6.61 6.73 7.02 7.09 7.16 7.44<br />
Haryana 2.62 2.58 2.52 2.51 2.43 2.41 2.36 2.50 2.54 2.51 2.64 2.56 2.55 2.59 2.54 2.49<br />
Karnataka 4.96 4.83 4.57 4.61 4.86 4.99 5.07 5.04 5.10 4.88 4.83 4.79 4.77 5.04 5.14 4.98<br />
Kerala 4.01 4.00 4.03 4.07 4.03 4.16 4.15 4.16 4.16 4.36 4.31 4.43 4.34 4.31 4.48 4.60<br />
MP 6.77 6.58 6.35 6.09 5.92 5.76 5.74 5.64 5.69 5.52 5.54 5.31 5.03 5.19 5.30 5.24<br />
Maharashtra 5.62 6.60 6.91 7.25 7.94 8.30 8.44 9.29 9.75 10.46 10.54 11.40 11.23 11.29 11.92 12.65<br />
Orissa 4.57 4.27 4.26 4.33 4.23 4.30 4.33 4.29 4.26 4.29 4.17 4.22 4.05 4.07 4.06 4.10<br />
Punjab 6.11 6.03 6.15 5.94 5.92 6.05 6.02 5.82 5.71 5.59 5.40 5.17 5.07 5.14 5.14 5.08<br />
Rajasthan 6.53 6.10 5.51 5.57 5.47 5.61 5.73 5.94 5.99 6.05 6.05 6.11 5.97 5.98 6.18 6.31<br />
TN 5.26 5.53 5.54 5.83 6.30 6.48 6.27 6.05 6.15 5.93 6.10 6.01 6.00 5.94 5.92 5.89<br />
UP 15.11 15.33 15.66 15.72 15.90 15.82 15.89 15.89 15.86 16.07 15.71 14.72 14.85 14.44 12.52 11.45<br />
WB 6.76 6.65 7.08 6.92 6.80 6.90 7.03 7.30 7.61 7.79 8.28 8.83 9.36 9.82 10.13 10.43<br />
NSC 90.09 90.05 90.32 91.06 91.66 92.35 92.04 92.49 93.03 93.41 93.71 93.73 93.51 93.51 93.37 93.52<br />
Assam 1.90 2.03 2.22 2.11 1.97 1.68 2.44 2.48 2.17 1.88 1.66 1.57 1.57 1.52 1.57 1.57<br />
Arunachal 0.12 0.19 0.19 0.16 0.15 0.10 0.10 0.11 0.10 0.13 0.12 0.12 0.15 0.16 0.17 0.16<br />
HP 1.42 1.36 1.42 1.40 1.35 1.36 1.33 1.14 1.23 1.39 1.49 1.42 1.52 1.53 1.63 1.64<br />
JK 5.09 4.80 4.37 3.81 3.41 3.00 2.57 2.28 2.00 1.70 1.65 1.65 1.67 1.71 1.56 1.42<br />
Manipur 0.26 0.27 0.29 0.28 0.25 0.23 0.22 0.22 0.25 0.24 0.21 0.27 0.31 0.24 0.30 0.30<br />
Meghalaya 0.06 0.09 0.10 0.14 0.17 0.19 0.18 0.18 0.17 0.19 0.20 0.21 0.23 0.23 0.25 0.25<br />
Mizoram 0.36 0.34 0.19 0.18 0.20 0.18 0.17 0.17 0.17 0.21 0.18 0.22 0.24 0.25 0.28 0.27<br />
Nagal<strong>and</strong> 0.16 0.24 0.26 0.25 0.22 0.30 0.32 0.34 0.32 0.32 0.30 0.32 0.31 0.33 0.33 0.31<br />
Sikkim 0.09 0.10 0.11 0.12 0.13 0.13 0.13 0.13 0.13 0.12 0.14 0.15 0.13 0.13 0.12 0.11<br />
Tripura 0.44 0.54 0.53 0.50 0.48 0.48 0.48 0.45 0.42 0.39 0.34 0.34 0.35 0.38 0.43 0.45<br />
SC 9.91 9.95 9.68 8.94 8.34 7.65 7.96 7.51 6.97 6.59 6.29 6.27 6.49 6.49 6.63 6.48<br />
19
Table 8: Proportion <strong>of</strong> Primary <strong>Deficit</strong> on Own Account (PDOA) <strong>of</strong> Each State <strong>in</strong> the Comb<strong>in</strong>ed PDOA<br />
89-90 90-91 91-92 92-93 93-94 94-95 95-96 96-97 97-98 98-99 99-2000 2000-01 2001-02 2002-03 2003-04 (RE)<br />
AP 6.28 6.13 6.49 7.14 8.00 8.98 10.64 9.41 7.42 7.52 6.16 7.71 7.86 6.90 5.81<br />
Bihar 7.95 8.56 8.47 7.79 8.03 6.63 7.05 6.04 7.26 6.40 7.92 6.72 7.43 10.83 6.93<br />
Goa 0.52 0.51 0.45 0.34 0.27 0.24 0.25 0.22 0.21 0.26 0.25 0.29 0.25 0.32 0.17<br />
Gujarat 3.86 5.10 4.40 4.12 3.25 3.13 3.59 3.96 4.48 5.69 5.70 7.96 5.68 3.94 4.08<br />
Haryana 1.49 1.30 1.11 1.25 1.28 1.68 1.79 2.15 2.07 2.51 1.66 1.27 1.60 0.65 1.44<br />
Karnataka 4.53 3.99 4.76 4.99 5.20 4.64 4.18 4.56 3.87 4.23 4.94 4.62 5.71 5.32 3.06<br />
Kerala 3.14 3.45 2.99 2.84 3.07 3.11 3.07 2.98 3.88 3.45 4.02 3.01 2.57 3.31 2.87<br />
MP 5.85 6.52 6.14 5.91 6.91 6.07 6.20 7.12 6.76 6.47 5.83 6.24 8.39 9.99 8.43<br />
Maharashtra 8.80 6.84 6.42 7.72 6.98 8.74 8.18 8.65 8.04 7.63 8.99 8.09 6.70 7.92 9.79<br />
Orissa 4.20 4.12 4.64 4.39 4.40 4.24 4.25 4.27 3.97 4.33 4.54 3.93 3.87 3.27 4.11<br />
Punjab 3.39 3.59 2.20 3.30 2.46 2.24 1.10 1.07 2.01 2.43 1.51 2.46 2.85 2.51 2.23<br />
Rajasthan 4.29 4.44 6.34 5.54 6.31 6.22 7.02 5.78 5.98 5.97 5.26 4.97 5.19 5.32 4.73<br />
TN 7.06 6.18 9.22 8.35 6.59 6.08 4.74 6.28 6.43 6.14 5.83 5.07 3.36 4.31 3.23<br />
UP 15.62 16.94 14.91 16.89 14.90 15.95 13.70 14.01 13.81 14.14 12.35 11.81 12.97 13.02 22.95<br />
WB 6.20 7.24 5.48 5.08 6.45 6.18 6.56 7.97 6.87 8.01 9.99 9.98 9.57 7.19 5.93<br />
NSC 83.21 84.91 84.02 85.67 84.10 84.12 82.33 84.47 83.06 85.17 84.94 84.14 84.00 84.80 85.77<br />
Assam 4.05 3.61 4.21 3.00 3.70 3.71 4.02 3.05 3.09 2.76 3.17 3.36 3.22 2.69 4.58<br />
Arunachal 1.00 0.85 0.82 0.86 0.89 0.97 1.06 1.00 1.00 0.79 0.76 0.79 0.84 0.89 0.57<br />
HP 2.11 1.97 1.98 1.91 2.08 2.25 2.49 2.27 2.79 2.59 1.79 2.45 2.18 2.25 1.69<br />
JK 3.41 3.56 3.29 3.28 3.36 3.53 3.96 3.60 4.46 3.98 4.17 4.27 4.34 3.34 2.91<br />
Manipur 1.14 0.95 1.06 0.87 0.93 0.92 1.07 1.11 1.08 0.81 1.24 0.77 0.94 1.16 0.74<br />
Meghalaya 0.91 0.84 0.92 0.92 0.97 0.76 0.89 0.77 0.80 0.74 0.73 0.82 0.75 0.94 0.78<br />
Mizoram 0.92 0.52 0.84 0.87 0.91 0.89 0.99 0.93 0.87 0.72 0.78 0.81 0.82 0.79 0.53<br />
Nagal<strong>and</strong> 1.38 1.13 1.16 1.16 1.42 1.23 1.42 1.12 1.15 0.93 0.91 0.97 1.03 1.16 0.92<br />
Sikkim 0.40 0.34 0.39 0.38 0.39 0.39 0.49 0.43 0.43 0.45 0.37 0.37 0.45 0.52 0.35<br />
Tripura 1.46 1.31 1.31 1.07 1.25 1.23 1.28 1.25 1.26 1.06 1.13 1.25 1.42 1.47 1.17<br />
SC 16.79 15.09 15.98 14.33 15.90 15.88 17.67 15.53 16.94 14.83 15.06 15.86 16.00 15.20 14.23<br />
Total 100 100 100 100 100 100 100 100 100 100 100 100 100 100 100<br />
To enable comparison over the entire period under consideration, values for the new states <strong>of</strong> Chattisgarh, Jharkh<strong>and</strong> <strong>and</strong> Uttaranchal have<br />
been comb<strong>in</strong>ed with those <strong>of</strong> their parent states M.P, Bihar <strong>and</strong> U.P respectively.<br />
20
Table 9: Proportion <strong>of</strong> the Transfers from Centre (TrC) <strong>of</strong> Each State <strong>in</strong> Total TrC<br />
89-90 90-91 91-92 92-93 93-94 94-95 95-96 96-97 97-98 98-99 99-2000 2000-01 2001-02 2002-03 2003-04 (RE)<br />
AP 6.37 7.15 7.00 6.99 7.03 6.76 8.31 8.10 7.66 7.08 7.29 7.03 7.78 7.20 7.61<br />
Bihar 9.30 8.98 9.36 9.44 9.16 8.90 8.99 8.85 9.07 8.70 8.73 9.75 10.83 11.60 10.24<br />
Goa 0.40 0.48 0.38 0.36 0.32 0.35 0.29 0.28 0.25 0.22 0.19 0.20 0.18 0.18 0.16<br />
Gujarat 2.92 2.14 1.98 3.38 3.87 3.52 3.25 3.51 3.59 3.75 3.84 3.80 3.21 4.02 2.69<br />
Haryana 1.16 1.24 1.23 1.23 1.27 1.16 1.32 1.33 1.39 1.34 1.35 0.94 1.01 1.19 1.13<br />
Karnataka 4.17 3.88 3.91 3.96 4.08 4.09 4.07 4.34 4.55 4.48 4.84 4.69 4.61 4.90 4.46<br />
Kerala 2.97 3.18 2.94 3.00 2.88 3.28 3.01 3.00 3.20 3.16 3.02 2.50 2.73 2.43 2.45<br />
MP 6.92 7.24 6.92 6.95 6.86 6.99 6.73 6.80 7.25 7.08 6.73 7.19 8.36 11.04 10.90<br />
Maharashtra 7.21 6.64 6.33 5.80 6.67 6.10 5.71 6.54 4.58 6.30 5.54 4.83 4.38 3.48 5.69<br />
Orissa 4.71 4.84 4.72 4.78 4.43 4.51 4.28 4.26 4.14 3.98 4.72 4.59 4.10 4.22 4.34<br />
Punjab 1.52 1.60 1.64 1.82 1.64 1.56 1.52 1.54 1.47 1.57 1.58 1.75 1.21 2.07 1.83<br />
Rajasthan 5.21 5.99 5.76 5.60 5.65 6.07 5.29 5.31 5.32 5.23 5.02 6.16 5.25 4.94 4.95<br />
TN 6.34 5.89 6.00 5.84 5.87 5.83 5.19 5.35 5.86 5.53 5.52 4.92 3.08 2.91 2.85<br />
UP 15.51 16.26 15.88 16.59 14.41 14.79 14.72 14.53 14.39 12.71 13.74 14.09 15.99 13.51 15.71<br />
WB 6.22 6.53 6.19 6.18 6.19 6.23 5.84 6.14 6.30 6.72 6.16 8.31 7.53 6.88 5.69<br />
NSC 80.9 82.0 80.3 81.9 80.3 80.1 78.5 79.9 79.0 77.9 78.3 80.7 80.2 80.6 80.7<br />
Assam 4.55 4.01 5.12 4.26 5.40 4.47 4.68 4.78 4.75 4.89 4.32 4.21 4.09 3.82 5.34<br />
Arunachal 1.16 1.17 1.22 1.16 1.05 1.16 1.33 1.27 1.19 1.35 1.26 1.00 1.04 1.14 0.91<br />
HP 2.30 2.18 2.26 1.99 2.50 1.95 2.59 2.48 2.28 2.44 2.78 2.43 2.53 2.33 2.03<br />
JK 3.42 3.44 4.19 4.50 4.33 5.87 5.64 4.75 6.40 6.03 6.17 5.08 5.51 5.28 4.78<br />
Manipur 1.38 1.32 1.29 1.15 1.22 1.16 1.24 1.28 1.22 1.33 1.34 1.09 1.16 1.30 1.04<br />
Meghalaya 1.19 1.11 1.06 0.95 0.97 0.97 1.10 1.05 0.92 1.10 1.03 1.05 0.94 1.04 1.07<br />
Mizoram 1.33 1.21 1.14 0.98 1.07 1.11 1.15 1.05 0.97 1.16 1.10 0.88 0.85 0.86 0.69<br />
Nagal<strong>and</strong> 1.46 1.39 1.40 1.22 1.35 1.21 1.45 1.36 1.24 1.45 1.43 1.33 1.29 1.39 1.34<br />
Sikkim 0.47 0.45 0.44 0.43 0.44 0.45 0.59 0.52 0.52 0.59 0.57 0.58 0.66 0.73 0.60<br />
Tripura 1.80 1.68 1.61 1.43 1.33 1.50 1.70 1.60 1.51 1.81 1.72 1.61 1.70 1.54 1.53<br />
SC 19.1 18.0 19.7 18.1 19.7 19.9 21.5 20.1 21.0 22.1 21.7 19.3 19.8 19.4 19.3<br />
Total 100.0 100.0 100.0 100.0 100.0 100.0 100.0 100.0 100.0 100.0 100.0 100.0 100.0 100.0 100.0<br />
To enable comparison over the entire period under consideration, values for the new states <strong>of</strong> Chattisgarh, Jharkh<strong>and</strong> <strong>and</strong> Uttaranchal have<br />
been comb<strong>in</strong>ed with those <strong>of</strong> their parent states M.P, Bihar <strong>and</strong> U.P respectively.<br />
21