Gender Influence on Access to Innovation Resources in Nigeria
Gender Influence on Access to Innovation Resources in Nigeria
Gender Influence on Access to Innovation Resources in Nigeria

You also want an ePaper? Increase the reach of your titles
YUMPU automatically turns print PDFs into web optimized ePapers that Google loves.
Internati<strong>on</strong>al Journal of Humanities and Social Science Vol. 3 No. 1; January 2013<br />
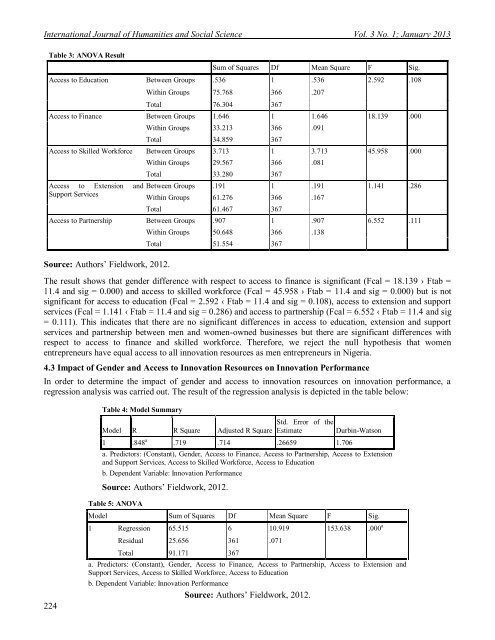
Table 3: ANOVA Result<br />
Sum of Squares Df Mean Square F Sig.<br />
<strong>Access</strong> <strong>to</strong> Educati<strong>on</strong> Between Groups .536 1 .536 2.592 .108<br />
With<strong>in</strong> Groups 75.768 366 .207<br />
Total 76.304 367<br />
<strong>Access</strong> <strong>to</strong> F<strong>in</strong>ance Between Groups 1.646 1 1.646 18.139 .000<br />
With<strong>in</strong> Groups 33.213 366 .091<br />
Total 34.859 367<br />
<strong>Access</strong> <strong>to</strong> Skilled Workforce Between Groups 3.713 1 3.713 45.958 .000<br />
<strong>Access</strong> <strong>to</strong> Extensi<strong>on</strong> and<br />
Support Services<br />
With<strong>in</strong> Groups 29.567 366 .081<br />
Total 33.280 367<br />
Between Groups .191 1 .191 1.141 .286<br />
With<strong>in</strong> Groups 61.276 366 .167<br />
Total 61.467 367<br />
<strong>Access</strong> <strong>to</strong> Partnership Between Groups .907 1 .907 6.552 .111<br />
Source: Authors’ Fieldwork, 2012.<br />
With<strong>in</strong> Groups 50.648 366 .138<br />
Total 51.554 367<br />
The result shows that gender difference with respect <strong>to</strong> access <strong>to</strong> f<strong>in</strong>ance is significant (Fcal = 18.139 › Ftab =<br />
11.4 and sig = 0.000) and access <strong>to</strong> skilled workforce (Fcal = 45.958 › Ftab = 11.4 and sig = 0.000) but is not<br />
significant for access <strong>to</strong> educati<strong>on</strong> (Fcal = 2.592 ‹ Ftab = 11.4 and sig = 0.108), access <strong>to</strong> extensi<strong>on</strong> and support<br />
services (Fcal = 1.141 ‹ Ftab = 11.4 and sig = 0.286) and access <strong>to</strong> partnership (Fcal = 6.552 ‹ Ftab = 11.4 and sig<br />
= 0.111). This <strong>in</strong>dicates that there are no significant differences <strong>in</strong> access <strong>to</strong> educati<strong>on</strong>, extensi<strong>on</strong> and support<br />
services and partnership between men and women-owned bus<strong>in</strong>esses but there are significant differences with<br />
respect <strong>to</strong> access <strong>to</strong> f<strong>in</strong>ance and skilled workforce. Therefore, we reject the null hypothesis that women<br />
entrepreneurs have equal access <strong>to</strong> all <strong>in</strong>novati<strong>on</strong> resources as men entrepreneurs <strong>in</strong> <strong>Nigeria</strong>.<br />
4.3 Impact of <str<strong>on</strong>g>Gender</str<strong>on</strong>g> and <strong>Access</strong> <strong>to</strong> Innovati<strong>on</strong> <strong>Resources</strong> <strong>on</strong> Innovati<strong>on</strong> Performance<br />
In order <strong>to</strong> determ<strong>in</strong>e the impact of gender and access <strong>to</strong> <strong>in</strong>novati<strong>on</strong> resources <strong>on</strong> <strong>in</strong>novati<strong>on</strong> performance, a<br />
regressi<strong>on</strong> analysis was carried out. The result of the regressi<strong>on</strong> analysis is depicted <strong>in</strong> the table below:<br />
Table 4: Model Summary<br />
Model R R Square Adjusted R Square<br />
Std. Error of the<br />
Estimate<br />
1 .848 a .719 .714 .26659 1.706<br />
Durb<strong>in</strong>-Wats<strong>on</strong><br />
a. Predic<strong>to</strong>rs: (C<strong>on</strong>stant), <str<strong>on</strong>g>Gender</str<strong>on</strong>g>, <strong>Access</strong> <strong>to</strong> F<strong>in</strong>ance, <strong>Access</strong> <strong>to</strong> Partnership, <strong>Access</strong> <strong>to</strong> Extensi<strong>on</strong><br />
and Support Services, <strong>Access</strong> <strong>to</strong> Skilled Workforce, <strong>Access</strong> <strong>to</strong> Educati<strong>on</strong><br />
b. Dependent Variable: Innovati<strong>on</strong> Performance<br />
Source: Authors’ Fieldwork, 2012.<br />
Table 5: ANOVA<br />
224<br />
Model Sum of Squares Df Mean Square F Sig.<br />
1 Regressi<strong>on</strong> 65.515 6 10.919 153.638 .000 a<br />
Residual 25.656 361 .071<br />
Total 91.171 367<br />
a. Predic<strong>to</strong>rs: (C<strong>on</strong>stant), <str<strong>on</strong>g>Gender</str<strong>on</strong>g>, <strong>Access</strong> <strong>to</strong> F<strong>in</strong>ance, <strong>Access</strong> <strong>to</strong> Partnership, <strong>Access</strong> <strong>to</strong> Extensi<strong>on</strong> and<br />
Support Services, <strong>Access</strong> <strong>to</strong> Skilled Workforce, <strong>Access</strong> <strong>to</strong> Educati<strong>on</strong><br />
b. Dependent Variable: Innovati<strong>on</strong> Performance<br />
Source: Authors’ Fieldwork, 2012.