Multiple Response Optimizations in Drilling Using Taguchi ... - ijmer
Multiple Response Optimizations in Drilling Using Taguchi ... - ijmer
Multiple Response Optimizations in Drilling Using Taguchi ... - ijmer
You also want an ePaper? Increase the reach of your titles
YUMPU automatically turns print PDFs into web optimized ePapers that Google loves.
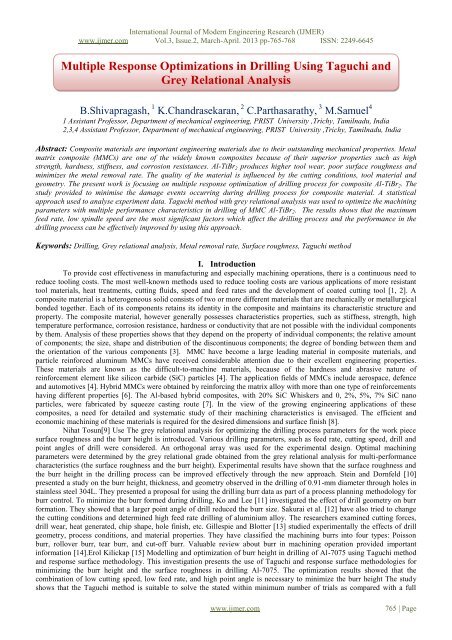
International Journal of Modern Eng<strong>in</strong>eer<strong>in</strong>g Research (IJMER)<br />
www.<strong>ijmer</strong>.com Vol.3, Issue.2, March-April. 2013 pp-765-768 ISSN: 2249-6645<br />
<strong>Multiple</strong> <strong>Response</strong> <strong>Optimizations</strong> <strong>in</strong> Drill<strong>in</strong>g Us<strong>in</strong>g <strong>Taguchi</strong> and<br />
Grey Relational Analysis<br />
B.Shivapragash, 1 K.Chandrasekaran, 2 C.Parthasarathy, 3 M.Samuel 4<br />
1 Assistant Professor, Department of mechanical eng<strong>in</strong>eer<strong>in</strong>g, PRIST University ,Trichy, Tamilnadu, India<br />
2,3,4 Assistant Professor, Department of mechanical eng<strong>in</strong>eer<strong>in</strong>g, PRIST University ,Trichy, Tamilnadu, India<br />
Abstract: Composite materials are important eng<strong>in</strong>eer<strong>in</strong>g materials due to their outstand<strong>in</strong>g mechanical properties. Metal<br />
matrix composite (MMCs) are one of the widely known composites because of their superior properties such as high<br />
strength, hardness, stiffness, and corrosion resistances. Al-TiBr 2 produces higher tool wear, poor surface roughness and<br />
m<strong>in</strong>imizes the metal removal rate. The quality of the material is <strong>in</strong>fluenced by the cutt<strong>in</strong>g conditions, tool material and<br />
geometry. The present work is focus<strong>in</strong>g on multiple response optimization of drill<strong>in</strong>g process for composite Al-TiBr 2 . The<br />
study provided to m<strong>in</strong>imise the damage events occurr<strong>in</strong>g dur<strong>in</strong>g drill<strong>in</strong>g process for composite material. A statistical<br />
approach used to analyse experiment data. <strong>Taguchi</strong> method with grey relational analysis was used to optimize the mach<strong>in</strong><strong>in</strong>g<br />
parameters with multiple performance characteristics <strong>in</strong> drill<strong>in</strong>g of MMC Al-TiBr 2 . The results shows that the maximum<br />
feed rate, low sp<strong>in</strong>dle speed are the most significant factors which affect the drill<strong>in</strong>g process and the performance <strong>in</strong> the<br />
drill<strong>in</strong>g process can be effectively improved by us<strong>in</strong>g this approach.<br />
Keywords: Drill<strong>in</strong>g, Grey relational analysis, Metal removal rate, Surface roughness, <strong>Taguchi</strong> method<br />
I. Introduction<br />
To provide cost effectiveness <strong>in</strong> manufactur<strong>in</strong>g and especially mach<strong>in</strong><strong>in</strong>g operations, there is a cont<strong>in</strong>uous need to<br />
reduce tool<strong>in</strong>g costs. The most well-known methods used to reduce tool<strong>in</strong>g costs are various applications of more resistant<br />
tool materials, heat treatments, cutt<strong>in</strong>g fluids, speed and feed rates and the development of coated cutt<strong>in</strong>g tool [1, 2]. A<br />
composite material is a heterogeneous solid consists of two or more different materials that are mechanically or metallurgical<br />
bonded together. Each of its components reta<strong>in</strong>s its identity <strong>in</strong> the composite and ma<strong>in</strong>ta<strong>in</strong>s its characteristic structure and<br />
property. The composite material, however generally possesses characteristics properties, such as stiffness, strength, high<br />
temperature performance, corrosion resistance, hardness or conductivity that are not possible with the <strong>in</strong>dividual components<br />
by them. Analysis of these properties shows that they depend on the property of <strong>in</strong>dividual components; the relative amount<br />
of components; the size, shape and distribution of the discont<strong>in</strong>uous components; the degree of bond<strong>in</strong>g between them and<br />
the orientation of the various components [3]. MMC have become a large lead<strong>in</strong>g material <strong>in</strong> composite materials, and<br />
particle re<strong>in</strong>forced alum<strong>in</strong>um MMCs have received considerable attention due to their excellent eng<strong>in</strong>eer<strong>in</strong>g properties.<br />
These materials are known as the difficult-to-mach<strong>in</strong>e materials, because of the hardness and abrasive nature of<br />
re<strong>in</strong>forcement element like silicon carbide (SiC) particles [4]. The application fields of MMCs <strong>in</strong>clude aerospace, defence<br />
and automotives [4]. Hybrid MMCs were obta<strong>in</strong>ed by re<strong>in</strong>forc<strong>in</strong>g the matrix alloy with more than one type of re<strong>in</strong>forcements<br />
hav<strong>in</strong>g different properties [6]. The Al-based hybrid composites, with 20% SiC Whiskers and 0, 2%, 5%, 7% SiC nano<br />
particles, were fabricated by squeeze cast<strong>in</strong>g route [7]. In the view of the grow<strong>in</strong>g eng<strong>in</strong>eer<strong>in</strong>g applications of these<br />
composites, a need for detailed and systematic study of their mach<strong>in</strong><strong>in</strong>g characteristics is envisaged. The efficient and<br />
economic mach<strong>in</strong><strong>in</strong>g of these materials is required for the desired dimensions and surface f<strong>in</strong>ish [8].<br />
Nihat Tosun[9] Use The grey relational analysis for optimiz<strong>in</strong>g the drill<strong>in</strong>g process parameters for the work piece<br />
surface roughness and the burr height is <strong>in</strong>troduced. Various drill<strong>in</strong>g parameters, such as feed rate, cutt<strong>in</strong>g speed, drill and<br />
po<strong>in</strong>t angles of drill were considered. An orthogonal array was used for the experimental design. Optimal mach<strong>in</strong><strong>in</strong>g<br />
parameters were determ<strong>in</strong>ed by the grey relational grade obta<strong>in</strong>ed from the grey relational analysis for multi-performance<br />
characteristics (the surface roughness and the burr height). Experimental results have shown that the surface roughness and<br />
the burr height <strong>in</strong> the drill<strong>in</strong>g process can be improved effectively through the new approach. Ste<strong>in</strong> and Dornfeld [10]<br />
presented a study on the burr height, thickness, and geometry observed <strong>in</strong> the drill<strong>in</strong>g of 0.91-mm diameter through holes <strong>in</strong><br />
sta<strong>in</strong>less steel 304L. They presented a proposal for us<strong>in</strong>g the drill<strong>in</strong>g burr data as part of a process plann<strong>in</strong>g methodology for<br />
burr control. To m<strong>in</strong>imize the burr formed dur<strong>in</strong>g drill<strong>in</strong>g, Ko and Lee [11] <strong>in</strong>vestigated the effect of drill geometry on burr<br />
formation. They showed that a larger po<strong>in</strong>t angle of drill reduced the burr size. Sakurai et al. [12] have also tried to change<br />
the cutt<strong>in</strong>g conditions and determ<strong>in</strong>ed high feed rate drill<strong>in</strong>g of alum<strong>in</strong>ium alloy. The researchers exam<strong>in</strong>ed cutt<strong>in</strong>g forces,<br />
drill wear, heat generated, chip shape, hole f<strong>in</strong>ish, etc. Gillespie and Blotter [13] studied experimentally the effects of drill<br />
geometry, process conditions, and material properties. They have classified the mach<strong>in</strong><strong>in</strong>g burrs <strong>in</strong>to four types: Poisson<br />
burr, rollover burr, tear burr, and cut-off burr. Valuable review about burr <strong>in</strong> mach<strong>in</strong><strong>in</strong>g operation provided important<br />
<strong>in</strong>formation [14].Erol Kilickap [15] Modell<strong>in</strong>g and optimization of burr height <strong>in</strong> drill<strong>in</strong>g of Al-7075 us<strong>in</strong>g <strong>Taguchi</strong> method<br />
and response surface methodology. This <strong>in</strong>vestigation presents the use of <strong>Taguchi</strong> and response surface methodologies for<br />
m<strong>in</strong>imiz<strong>in</strong>g the burr height and the surface roughness <strong>in</strong> drill<strong>in</strong>g Al-7075. The optimization results showed that the<br />
comb<strong>in</strong>ation of low cutt<strong>in</strong>g speed, low feed rate, and high po<strong>in</strong>t angle is necessary to m<strong>in</strong>imize the burr height The study<br />
shows that the <strong>Taguchi</strong> method is suitable to solve the stated with<strong>in</strong> m<strong>in</strong>imum number of trials as compared with a full<br />
www.<strong>ijmer</strong>.com<br />
765 | Page
International Journal of Modern Eng<strong>in</strong>eer<strong>in</strong>g Research (IJMER)<br />
www.<strong>ijmer</strong>.com Vol.3, Issue.2, March-April. 2013 pp-765-768 ISSN: 2249-6645<br />
factorial design. Limited research papers are available for mach<strong>in</strong><strong>in</strong>g of composite materials <strong>in</strong> drill<strong>in</strong>g processes. So <strong>in</strong> this<br />
<strong>in</strong>vestigation grey relational analysis is used to multiple response optimizations on Al-TiBr 2 <strong>in</strong> drill<strong>in</strong>g.<br />
II. Materials And Methods<br />
In this study, Al-TiBr 2 is used as the work piece material. The dimensions of this work piece material are<br />
100×170×15 mm. The chemical composition of Al-TiBr 2 is given <strong>in</strong> Table 1.<br />
Table.1.Chemical Composition of Al-TiB 2<br />
Component Mg Si Fe Cu Zn Ti Mn Cr Al<br />
Amount (wt) 0.8 0.4 0.7 0.15 0.25 0.15 0.15 0.04 Balance<br />
Grey Relational Analysis<br />
The black box is used to <strong>in</strong>dicate a system l a c k i n g i n t e r i o r i n f o r m a t i o n . Nowadays, the black is represented,<br />
as lack of <strong>in</strong>formation, but the white is full of <strong>in</strong>formation. Thus, the <strong>in</strong>formation that is either <strong>in</strong>complete or undeterm<strong>in</strong>ed is<br />
called Grey. A system hav<strong>in</strong>g <strong>in</strong>complete <strong>in</strong>formation is called Grey system. The Grey number <strong>in</strong> Grey system represents a<br />
number with less complete <strong>in</strong>formation. The Grey element represents an element with <strong>in</strong>complete <strong>in</strong>formation. The Grey<br />
relation is the relation with <strong>in</strong>complete <strong>in</strong>formation. Those three terms are the typical symbols and features for Grey<br />
system and Grey phenomenon. There are several aspects for the theory of Grey system:<br />
1. Grey generation: This is data process<strong>in</strong>g to supplement <strong>in</strong>formation. It is aimed to process those complicate and<br />
tedious data to ga<strong>in</strong> a clear rule, which is the whiten<strong>in</strong>g of a sequence of numbers.<br />
2. Grey model<strong>in</strong>g: This is done by step 1 to establish a set of Grey variation equations and Grey differential equations,<br />
which is the whiten<strong>in</strong>g of the model.<br />
3. Grey prediction: By us<strong>in</strong>g the Grey model to conduct a qualitative prediction, this is called the whiten<strong>in</strong>g of<br />
development.<br />
4. Grey decision: A decision is made under imperfect countermeasure and unclear situation, which is called the<br />
whiten<strong>in</strong>g of status.<br />
5. Grey relational analysis: Quantify all <strong>in</strong>fluences of various factors and their relation, which is called the whiten<strong>in</strong>g of<br />
factor relation.<br />
6. Grey control: Work on the data of system behavior and look for any rules o f behavior development to<br />
predict future’s behavior, the prediction value can be fed back <strong>in</strong>to the system <strong>in</strong> order to control the system.<br />
This study will adopt all six above- mentioned research steps to develop a vendor evaluation model based on<br />
Grey relational analysis, and apply to vendor evaluation and selection. All details will be discussed <strong>in</strong> the follow<strong>in</strong>g sections.<br />
The Grey relational analysis uses <strong>in</strong>formation from the Grey system to dynamically compare each factor<br />
quantitatively. This approach is based on the level of similarity and variability among all factors to establish their relation.<br />
The relational analysis suggests how to make prediction and decision, and generate reports that make suggestions for the<br />
vendor selection. This analytical model magnifies and clarifies the Grey relation among all factors. It also provides data to<br />
support quantification and comparison analysis. In other words, the Grey relational analysis is a method to analyze the<br />
relational grade for discrete sequences. This is unlike the traditional statistics analysis handl<strong>in</strong>g the relation between<br />
variables. Some of its defects are: (1) it must have plenty of data; (2) data distribution must be typical; (3) a few factors are<br />
allowed and can be expressed functionally. But the Grey relational analysis requires less data and can analyze many factors<br />
that can overcome the disadvantages of statistics method.<br />
III. Design of Experiment<br />
The experimental layout for the mach<strong>in</strong><strong>in</strong>g parameters us<strong>in</strong>g the L 9 orthogonal array design the drill<strong>in</strong>g mach<strong>in</strong>e is<br />
used for the <strong>in</strong> this study. The radial drill<strong>in</strong>g mach<strong>in</strong>e was adapted to drill<strong>in</strong>g process and HSS tool with dia of 0.6 mm was<br />
used. The surface roughness (SR) and material removal rate (MRR) are two essential part of a product <strong>in</strong> any drill<strong>in</strong>g<br />
mach<strong>in</strong><strong>in</strong>g operation. The theoretical surface roughness is generally dependent on many parameters such as the tool<br />
geometry, tool material and work piece material. The array hav<strong>in</strong>g a three control parameter and three levels are shown <strong>in</strong><br />
table 1. This method, more essentials all of the observed values are calculated based on the maximum the better and the<br />
m<strong>in</strong>imum the better. In the present study sp<strong>in</strong>dle speed depth of cut feed rate have been selected as design factor. While<br />
other parameter have been assumed to be constant over the Experimental doma<strong>in</strong>. This Experiment focuses the observed<br />
values of MRR and SR were set to maximum, <strong>in</strong>termediate and m<strong>in</strong>imum respectively. Each experimental trial was<br />
performed with three simple replications at each set value. Next, the optimization of the observed values was determ<strong>in</strong>ed by<br />
compar<strong>in</strong>g the standard analysis and grey relational analysis.<br />
www.<strong>ijmer</strong>.com<br />
766 | Page
International Journal of Modern Eng<strong>in</strong>eer<strong>in</strong>g Research (IJMER)<br />
www.<strong>ijmer</strong>.com Vol.3, Issue.2, March-April. 2013 pp-765-768 ISSN: 2249-6645<br />
Table 2 Drill<strong>in</strong>g parameters and levels<br />
Designation Parameters Level 1 Level 2 Level 3<br />
A<br />
Sp<strong>in</strong>dle 1000 1500 2000<br />
Speed(rpm)<br />
B<br />
Feed Rate 0.5 1.0 1.5<br />
(mm/m<strong>in</strong>)<br />
C<br />
Depth of cut<br />
(mm)<br />
02 04 06<br />
IV. Result and Discussion<br />
The algorithm of grey relational analysis coupled with pr<strong>in</strong>cipal analysis to determ<strong>in</strong>e the optimal comb<strong>in</strong>ations of<br />
the cutt<strong>in</strong>g parameters for rough cutt<strong>in</strong>g process <strong>in</strong> high-speed drill<strong>in</strong>g operation is described step by step as follow:<br />
(1) Convert the experimental data <strong>in</strong>to S/N values.<br />
(2) Normalize the S/N ratio.<br />
(3) Calculate the correspond<strong>in</strong>g grey relational coefficients.<br />
(4) Calculate the grey relational grade us<strong>in</strong>g pr<strong>in</strong>cipal component analysis.<br />
(5) Select the optimal levels of cutt<strong>in</strong>g parameters.<br />
(6) Conduct confirmation experiments.<br />
Optimal comb<strong>in</strong>ation of the cutt<strong>in</strong>g parameters<br />
The performance characteristics obta<strong>in</strong>ed from the experimental results are <strong>in</strong>itially converted <strong>in</strong>to S/N ratio to<br />
search for a desirable result with the best performance and the smallest variance. Thus, metal removal rate is of higher-thebetter<br />
type. As for surface roughness, it can be clearly recognized as one of lower the-better type. The experimental results<br />
are substituted <strong>in</strong>to Equation 1 to calculate the S/N ratios of surface roughness and metal removal rate shown <strong>in</strong> Table 4.<br />
S/N=-10log 1/n∑ y i<br />
2<br />
(1)<br />
Table 3 S/N ratio for MRR and SR<br />
Trials A B C<br />
S/N ratio for S/N ratio for<br />
MRR<br />
SR<br />
1 1 1 1 2.73441 -10.2644<br />
2 1 2 2 2.67078 -6.9271<br />
3 1 3 3 2.92256 -7.2722<br />
4 2 1 2 3.10672 -11.1501<br />
5 2 2 3 2.8603 -9.4551<br />
6 2 3 1 2.92256 -9.8831<br />
7 3 1 3 3.46373 -11.9539<br />
8 3 2 1 3.16725 -11.8879<br />
9 3 3 2 2.47703 -10.4489<br />
All the orig<strong>in</strong>al sequences of S/N ratio <strong>in</strong> Table 3 are then substituted <strong>in</strong>to Equation 2 to be normalized. The<br />
outcomes result is shown <strong>in</strong> Table 4 and denoted as Z i and Z j for reference sequence and comparability sequence<br />
respectively. In order to objectively the relative importance for each performance characteristic <strong>in</strong> grey relational analysis,<br />
pr<strong>in</strong>cipal component analysis is specially <strong>in</strong>troduced here to determ<strong>in</strong>e the correspond<strong>in</strong>g weight<strong>in</strong>g values for each<br />
performance characteristic. The elements of the array for multiple performance characteristics listed <strong>in</strong> Table 5 represent the<br />
grey relational coefficient of each performance characteristic.<br />
Z* ij (k) =z ij (k) - m<strong>in</strong> z ij (k)/max z ij (k) - m<strong>in</strong> z ij (k) (2)<br />
Table 4 Normalized values of S/N Ratio for MRR and SR<br />
Trial No<br />
Normalized values of S/N Ratio Z ij<br />
MRR(Z i ) SR (Z j )<br />
1 0.260 0.663<br />
2 0.196 0.000<br />
3 0.451 0.068<br />
4 0.637 0.840<br />
5 0.388 0.502<br />
6 0.451 0.588<br />
7 0.999 1.000<br />
8 0.699 0.986<br />
9 -0.0002 0.700<br />
www.<strong>ijmer</strong>.com<br />
767 | Page
International Journal of Modern Eng<strong>in</strong>eer<strong>in</strong>g Research (IJMER)<br />
www.<strong>ijmer</strong>.com Vol.3, Issue.2, March-April. 2013 pp-765-768 ISSN: 2249-6645<br />
Table 5 Grey Relational Coefficients for MRR and SR<br />
Trial No<br />
Grey Relational Coefficient<br />
MRR<br />
SR<br />
Grey Grade<br />
1 0.657397 0.42959 0.543493<br />
2 0.7183 1.0000 0.85915<br />
3 0.525618 0.879272 0.702445<br />
4 0.439404 0.373107 0.406256<br />
5 0.56296 0.498552 0.530756<br />
6 0.525618 0.459539 0.492578<br />
7 0.333394 0.333333 0.333364<br />
8 0.416927 0.336277 0.376602<br />
9 1.000548 0.416457 0.708502<br />
The response table of <strong>Taguchi</strong> method is employed here to calculate the average grey relational grade for each<br />
cutt<strong>in</strong>g parameter level. It is done by sort<strong>in</strong>g the grey relational grades correspond<strong>in</strong>g to levels of the cutt<strong>in</strong>g parameter <strong>in</strong><br />
each column of the orthogonal array, and tak<strong>in</strong>g an average on those with the same level. Us<strong>in</strong>g the same method,<br />
calculations are performed for each cutt<strong>in</strong>g parameter level and the response table is constructed as shown <strong>in</strong> Table 6.<br />
Basically, the larger the grey relational grade is the better the correspond<strong>in</strong>g multiple performance characteristic. From the<br />
response table for the grey relational grades shown <strong>in</strong> Table 05, the best comb<strong>in</strong>ation of the cutt<strong>in</strong>g parameters is the set with<br />
sp<strong>in</strong>dle low speed, high feed rate and middle depth of cut.<br />
Table 6 Optimum Level for Drill<strong>in</strong>g Parameter<br />
Factors 1 2 3<br />
A<br />
Sp<strong>in</strong>dle<br />
Speed<br />
0.701696 0.47653 0.472823<br />
B Feed Rate 0.427704 0.588836 0.634508<br />
C<br />
Depth of<br />
Cut<br />
0.470891 0.657969 0.522188<br />
V. Conclusions<br />
In this study ma<strong>in</strong>ly focus on material removal rate and surface roughness on Al-TiBr 2 <strong>in</strong> radial drill<strong>in</strong>g mach<strong>in</strong><strong>in</strong>g<br />
with dry conditions. From the study of result <strong>in</strong> drill<strong>in</strong>g is us<strong>in</strong>g Grey relational analysis. These follow<strong>in</strong>g can be concluded<br />
by this present studies.<br />
1. Optimum cutt<strong>in</strong>g parameters for m<strong>in</strong>imization surface roughness is sp<strong>in</strong>dle speed set as low level (1000 rpm), feed rate<br />
set as maximum level (1.5 mm/m<strong>in</strong>) and depth of cut set as middle level (6 mm).<br />
2. Optimum cutt<strong>in</strong>g parameters for maximization material removal rate is sp<strong>in</strong>dle speed set as low level (1000 rpm), feed<br />
rate set as maximum level (1.5 mm/m<strong>in</strong>) and depth of cut set as middle level (6 mm).<br />
Reference<br />
[1] Da Silva, F.J., Franco, S.D., Machado, A.R., Ezugwu, E.O., Souza Jr. A.M. (2006). Performance cryogenically treated HSS tools.<br />
Wear, vol. 261, no.5-6, p. 674-685,<br />
[2] Boris Stirn, Kiha Lee, David A. Dornfeld (2001) “BURR FORMATION IN MICRO-DRILLING”.<br />
[3] KILIÇKAP E, ÇAKIR O, AKSOY M, INAN A. Study of tool wear and surface roughness <strong>in</strong> mach<strong>in</strong><strong>in</strong>g of homogenized SiC-p<br />
re<strong>in</strong>forced alum<strong>in</strong>ium metal matrix composite. Journal of Materials Process<strong>in</strong>g Technology, 2005, 165: 862-867.<br />
[4] MOHAN B, RAJADURAI A, SATYANARAYANA K G. Electric discharge mach<strong>in</strong><strong>in</strong>g of Al/SiC metal matrix composites us<strong>in</strong>g<br />
rotary tube electrode [J]. Journal of Mater Process Technology, 2004, 153: 978-985.<br />
[5] ZHAN Y Z, ZHANG G D. The role of graphite particles <strong>in</strong> the high temperature wear of copper hybrid composites aga<strong>in</strong>st steel [J].<br />
Materials and Design, 2006, 27: 79-84.<br />
[6] ZHANG X N, GENG L, WANG G S. Fabrication of Al-based hybrid composites re<strong>in</strong>forced with SiC whiskers and SiC nano<br />
particles by squeeze cast<strong>in</strong>g [J]. Journal of Materials Process<strong>in</strong>g Technology, 2066, 176: 146-151.<br />
[7] GALLAB M, SKLAD M. Mach<strong>in</strong><strong>in</strong>g of Al/SiC metal matrix composites. Part II: Workpiece <strong>in</strong>tegrity [J]. Journal Mater Process,<br />
1998, 83: 277-283.<br />
[8]. L<strong>in</strong> TR, Shyu RF (2000) Improvement of tool life and exit burr us<strong>in</strong>g variable feeds when drill<strong>in</strong>g sta<strong>in</strong>less steel with coated drills.<br />
Int J Adv Manuf Technol 16:308–313<br />
[9]. Ste<strong>in</strong> JM, Dornfeld DA (1997) Burr formation <strong>in</strong> drill<strong>in</strong>g m<strong>in</strong>iature holes. Ann CIRP 46/17:63–66<br />
[10]. Ko SL, Lee JK (2001) Analysis of burr formation <strong>in</strong> drill<strong>in</strong>g with a new-concept drill. J Mater Process Technol 113:392–398<br />
[11]. Sakurai K, Adachi K, Kawai G, Sawai T (2000) High feed rate drill<strong>in</strong>g of alum<strong>in</strong>um alloy. Mat Sci Forum 331–337:625–630<br />
[12]. Gillespie LK, Blotter PT (1976) the formation and properties of mach<strong>in</strong><strong>in</strong>g burs. Transactions ASME Journal of Eng<strong>in</strong>eer<strong>in</strong>g for<br />
Industry 98:66–74<br />
[13]. Aurich JC, Dornfeld D, Arrazola PJ, Franke V, Leitz L, M<strong>in</strong> S (2009) Burrs: analysis, control and removal. CIRP Annals Manuf<br />
Technol 58:519–542<br />
[14]. Erol Kilickap Modell<strong>in</strong>g and optimization of burr height <strong>in</strong> drill<strong>in</strong>g of Al-7075 us<strong>in</strong>g <strong>Taguchi</strong> method and response surface<br />
methodology Spr<strong>in</strong>ger-Verlag London Limited 2010.<br />
www.<strong>ijmer</strong>.com<br />
768 | Page


