microsatellite markers – a novel tool in molecular genetics - ijrpc
microsatellite markers – a novel tool in molecular genetics - ijrpc
microsatellite markers – a novel tool in molecular genetics - ijrpc

You also want an ePaper? Increase the reach of your titles
YUMPU automatically turns print PDFs into web optimized ePapers that Google loves.
IJRPC 2012, 2(2) Pokhriyal et al ISSN: 22312781<br />
A<br />
B<br />
C<br />
D<br />
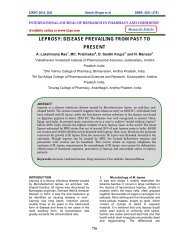
A) An ideal output<br />
The two alleles of this heterozygote are even<br />
<strong>in</strong> height and easy to dist<strong>in</strong>guish from the<br />
“stutter peaks” adjacent to them <strong>–</strong> dur<strong>in</strong>g PCR<br />
some products are 1, 2 or 3 repeats short due<br />
to errors <strong>in</strong> replication (similar to step-wise<br />
mutation) and show up as evenly spaced<br />
peaks with decreas<strong>in</strong>g height to the left of the<br />
true peak. Some loci show extensive stutter<strong>in</strong>g<br />
and others show virtually none. The stutter<br />
bands are useful for dist<strong>in</strong>guish<strong>in</strong>g<br />
<strong>microsatellite</strong> products from non-specific or<br />
non-target products. Notice that there are<br />
“pull-up peaks” <strong>in</strong> the green section of the<br />
spectrum. Pull-up is due primarily to spectral<br />
overlap <strong>in</strong> the emission spectra of the dyes<br />
which the sequencer records as a false peak<br />
<strong>in</strong> a different color. This is a common artifact of<br />
the DNA sequencer’s analysis process that<br />
can create confusion <strong>in</strong> some situations.<br />
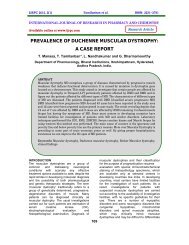
B) Two examples of trickier outputs<br />
The blue genotype is a heterozygote but the 2<br />
alleles are only 1repeat different <strong>in</strong> size. This<br />
creates a characteristic pattern for loci with<br />
stutter <strong>in</strong> which the second peak is higher than<br />
the first because of the additive <strong>in</strong>tensity of the<br />
larger allele’s first stutter peak and the smaller<br />
allele’s true peak. If the first two peaks were<br />
equal <strong>in</strong> height it would be difficult to<br />
determ<strong>in</strong>e if the genotype has one or two<br />
alleles. One clue is that there are 4 stutter<br />
peaks to the right of the largest peak <strong>in</strong>stead<br />
of 3. The second locus <strong>in</strong> this plot is shown<br />
with black dye and has larger alleles. This<br />
locus has no stutter perhaps because there<br />
are few repeats so that the Taq polymerase<br />
doesn’t make stepwise errors. This genotype<br />
is also a heterozygote, but the larger allele is<br />
fa<strong>in</strong>t. Larger alleles usually show at least<br />
slightly shorter peaks because PCR is less<br />
efficient for longer products. Here, the larger<br />
allele is so small that it could be easily<br />
overlooked or mistaken for noise. If any less<br />
PCR product were loaded onto the gel it might<br />
not show up at all <strong>–</strong> <strong>in</strong> which case it would be<br />
an example of “large allele drop-out,” another<br />
common source of <strong>in</strong>flated homozygosity<br />
counts.<br />
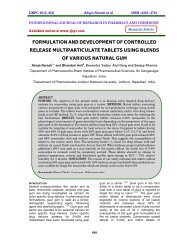
C) More examples<br />
When multiple loci are loaded <strong>in</strong> the same gel<br />
lane for efficiency, or amplified together <strong>in</strong> one<br />
PCR “multiplex” reaction, allele peaks can<br />
overlap and be sometimes easy to miss. Here<br />
the green and blue loci share an allele size.<br />
Dist<strong>in</strong>guish<strong>in</strong>g the true alleles is made even<br />
more difficult due to the occurrence of green<br />
pull-up peaks. If the green allele product were<br />
less <strong>in</strong>tense than the blue allele product<br />
(<strong>in</strong>stead of equal as shown here), it might be<br />
mistaken for a pull up peak. Re-runn<strong>in</strong>g the<br />
green locus separately <strong>in</strong> such cases will<br />
m<strong>in</strong>imize scor<strong>in</strong>g error. Here aga<strong>in</strong>, the blue<br />
locus shows two alleles that differ by one base<br />
pair. The heights are the same because this<br />
locus does not show strong stutter. But the<br />
blue locus does show small flank<strong>in</strong>g peaks <strong>–</strong><br />
the left side is a very fa<strong>in</strong>t stutter so only the<br />
largest stutter peak is visible, and the right<br />
406