Basic flow processes in high pressure fuel injection ... - ILASS-Europe
Basic flow processes in high pressure fuel injection ... - ILASS-Europe
Basic flow processes in high pressure fuel injection ... - ILASS-Europe

Create successful ePaper yourself
Turn your PDF publications into a flip-book with our unique Google optimized e-Paper software.
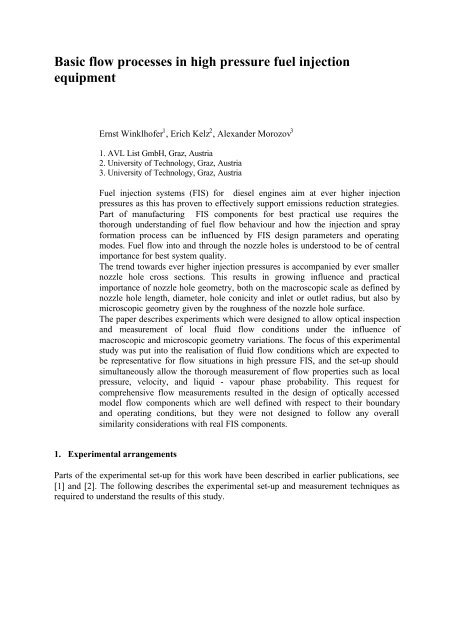
<strong>Basic</strong> <strong>flow</strong> <strong>processes</strong> <strong>in</strong> <strong>high</strong> <strong>pressure</strong> <strong>fuel</strong> <strong>in</strong>jection<br />
equipment<br />
Ernst W<strong>in</strong>klhofer 1 , Erich Kelz 2 , Alexander Morozov 3<br />
1. AVL List GmbH, Graz, Austria<br />
2. University of Technology, Graz, Austria<br />
3. University of Technology, Graz, Austria<br />
Fuel <strong>in</strong>jection systems (FIS) for diesel eng<strong>in</strong>es aim at ever <strong>high</strong>er <strong>in</strong>jection<br />
<strong>pressure</strong>s as this has proven to effectively support emissions reduction strategies.<br />
Part of manufactur<strong>in</strong>g FIS components for best practical use requires the<br />
thorough understand<strong>in</strong>g of <strong>fuel</strong> <strong>flow</strong> behaviour and how the <strong>in</strong>jection and spray<br />
formation process can be <strong>in</strong>fluenced by FIS design parameters and operat<strong>in</strong>g<br />
modes. Fuel <strong>flow</strong> <strong>in</strong>to and through the nozzle holes is understood to be of central<br />
importance for best system quality.<br />
The trend towards ever <strong>high</strong>er <strong>in</strong>jection <strong>pressure</strong>s is accompanied by ever smaller<br />
nozzle hole cross sections. This results <strong>in</strong> grow<strong>in</strong>g <strong>in</strong>fluence and practical<br />
importance of nozzle hole geometry, both on the macroscopic scale as def<strong>in</strong>ed by<br />
nozzle hole length, diameter, hole conicity and <strong>in</strong>let or outlet radius, but also by<br />
microscopic geometry given by the roughness of the nozzle hole surface.<br />
The paper describes experiments which were designed to allow optical <strong>in</strong>spection<br />
and measurement of local fluid <strong>flow</strong> conditions under the <strong>in</strong>fluence of<br />
macroscopic and microscopic geometry variations. The focus of this experimental<br />
study was put <strong>in</strong>to the realisation of fluid <strong>flow</strong> conditions which are expected to<br />
be representative for <strong>flow</strong> situations <strong>in</strong> <strong>high</strong> <strong>pressure</strong> FIS, and the set-up should<br />
simultaneously allow the thorough measurement of <strong>flow</strong> properties such as local<br />
<strong>pressure</strong>, velocity, and liquid - vapour phase probability. This request for<br />
comprehensive <strong>flow</strong> measurements resulted <strong>in</strong> the design of optically accessed<br />
model <strong>flow</strong> components which are well def<strong>in</strong>ed with respect to their boundary<br />
and operat<strong>in</strong>g conditions, but they were not designed to follow any overall<br />
similarity considerations with real FIS components.<br />
1. Experimental arrangements<br />
Parts of the experimental set-up for this work have been described <strong>in</strong> earlier publications, see<br />
[1] and [2]. The follow<strong>in</strong>g describes the experimental set-up and measurement techniques as<br />
required to understand the results of this study.
1.1 The 2-D model <strong>flow</strong> rig<br />
Transparent <strong>fuel</strong><br />
800 µm<br />
Cavitation<br />
Spray shadow<br />
Transparent<br />
ambient air<br />
Fig. 1a The model nozzle arrangement with the free spray<br />
Rectangular nozzle <strong>in</strong><br />
steel sheet:<br />
820 µm long, 110 µm wide,<br />
100 µm thick<br />
Fig. 1b Nozzle geometry details<br />
Flow path<br />
Hydraulic<br />
geometry<br />
201019-01<br />
W<strong>in</strong>dows<br />
Fig. 1c The model throttle <strong>flow</strong> path between the sapphire w<strong>in</strong>dows
The <strong>flow</strong> geometry of <strong>in</strong>terest is eroded <strong>in</strong>to steel sheets. The sheets are sandwiched between<br />
a pair of sapphire w<strong>in</strong>dows. The low <strong>pressure</strong> side is either open to ambient air for nozzle<br />
<strong>flow</strong> and free spray studies, see Fig. 1, or it is a liquid volume which is pressurised for throttle<br />
<strong>flow</strong> studies, as shown <strong>in</strong> the design sketch of Fig. 1C. The hydraulic components comprise a<br />
<strong>fuel</strong> tank, <strong>fuel</strong> supply pump, <strong>high</strong> <strong>pressure</strong> common rail pump, <strong>pressure</strong> regulator, <strong>in</strong>let valve,<br />
the optically accessed 2-D <strong>flow</strong> model, and a free test section <strong>in</strong> ambient air for spray<br />
experiments, or outlet valves and return l<strong>in</strong>e for throttle <strong>flow</strong> studies. One set of experiments<br />
was made with <strong>in</strong>ject<strong>in</strong>g <strong>in</strong>to a pressurised chamber with compressed air or <strong>fuel</strong>, respectively.<br />
Fuel <strong>pressure</strong> levels are measured 35 mm upstream and downstream (if applicable) of the<br />
observation element (DMS sensor, AVL SL31D200). For stationary conditions, <strong>fuel</strong> mass<br />
<strong>flow</strong> is measured with a coriolis sensor (Danfoss, Mass 2100 sensor and Mass 3000 signal<br />
converter).<br />
1.2 Visualisation of cavitation field<br />
This is accomplished by back illum<strong>in</strong>ation and imag<strong>in</strong>g of the <strong>flow</strong> model with a CCD camera<br />
(100 ns illum<strong>in</strong>ation time). The gas bubbles created <strong>in</strong> the low <strong>pressure</strong> cavitation areas result<br />
<strong>in</strong> the blacken<strong>in</strong>g of the observed <strong>flow</strong> area. This is directly recorded on a CCD camera. As<br />
cavitation bubbles are created <strong>in</strong> a <strong>high</strong>ly turbulent <strong>flow</strong> environment, the location of the<br />
cavitation field is fluctuat<strong>in</strong>g. Local fluctuation probability is visualised by means of<br />
distribution pattern statistics. This is based on b<strong>in</strong>arisation of the grey scale images and<br />
subsequent ensemble averag<strong>in</strong>g for a set of 20 images taken under the same operat<strong>in</strong>g<br />
conditions. Results are then presented as probability distribution fields of the local light<br />
transmittance (see e. g. Fig 2).<br />
1.3 Visualisation of the <strong>pressure</strong> field<br />
The basis of the <strong>pressure</strong> field visualisation is the measurement of the optical path length field<br />
<strong>in</strong> the 2-D model <strong>flow</strong>. For this purpose a Mach Zehnder <strong>in</strong>terferometer arrangement is used.<br />
The <strong>in</strong>terferograms are recorded with a CCD camera at 500 ns record<strong>in</strong>g time. The<br />
<strong>in</strong>terferogram fr<strong>in</strong>ge shift evaluation is based on an FFT algorithm [2]. Results are ensemble<br />
averaged for 20 images per operat<strong>in</strong>g condition. The optical path length data <strong>in</strong> the 2-D<br />
geometry are converted to density data and density to <strong>pressure</strong> and temperature data. For<br />
constant fluid temperature, this evaluation yields the <strong>pressure</strong> field. However, as heat is<br />
generated <strong>in</strong> the <strong>flow</strong> by turbulent dissipation, an error <strong>in</strong>troduced by temperature rise must be<br />
accounted for. This temperature rise across the throttle was between 2 and 3 K. With the<br />
given arrangement, the error by neglect<strong>in</strong>g this temperature effect is below 3% of the locally<br />
determ<strong>in</strong>ed <strong>pressure</strong> level [1].<br />
1.4 Velocity profiles<br />
Velocity profiles are measured with a fluorescence trac<strong>in</strong>g method. A narrow area of the fluid<br />
is irradiated with a laser light pulse (248 nm, 30 ns). This area is precisely located by means<br />
of a reference image. The irradiation yields fluorescence emission of the diesel fluid. An<br />
image of the fluid, captured at a constant time <strong>in</strong>terval after the illum<strong>in</strong>ation with the laser<br />
pulse shows the displacement of the irradiated <strong>flow</strong> area dur<strong>in</strong>g this time <strong>in</strong>terval.<br />
This displacement aga<strong>in</strong>st the reference image together with the selected time delay directly<br />
yields the velocity profile.
1.5 Hydraulic measurements<br />
Mass <strong>flow</strong> versus <strong>pressure</strong> drop measurements were made to f<strong>in</strong>d the <strong>in</strong>dividual throttles'<br />
transition <strong>in</strong>to choked <strong>flow</strong> conditions. This procedure was standardised for an <strong>in</strong>let <strong>pressure</strong><br />
of 100 bar (above ambient) and a <strong>fuel</strong> <strong>in</strong>let temperature of 27 deg C. The mass <strong>flow</strong> first<br />
follows the ris<strong>in</strong>g <strong>pressure</strong> drop as outlet <strong>pressure</strong> is decreased from near 100 bar to ambient<br />
<strong>pressure</strong>. With the onset and growth of cavitation, however, the mass<strong>flow</strong> approaches a<br />
constant level and is <strong>in</strong>sensitive to further reduction of outlet <strong>pressure</strong>. This transition from<br />
<strong>pressure</strong> dependent mass <strong>flow</strong> to choked mass <strong>flow</strong> def<strong>in</strong>es the "critical cavitation" (CC)<br />
po<strong>in</strong>t. For practical purposes, the critical cavitation <strong>pressure</strong> (CCP) is def<strong>in</strong>ed as the <strong>pressure</strong><br />
drop where the mass <strong>flow</strong> along the hydraulic l<strong>in</strong>e approaches 99% of the choked mass <strong>flow</strong>.<br />
With the widely used def<strong>in</strong>ition of the cavitation number<br />
CN = (P <strong>in</strong> – P out ) / (P out – P vapor ) (1)<br />
the critical cavitation number is def<strong>in</strong>ed as<br />
CCN = CCP / (P out at CCP – P vapor ) (2)<br />
P vapor for diesel <strong>fuel</strong> at 31 deg C is 20 mbar.<br />
If <strong>in</strong>let <strong>pressure</strong> is ma<strong>in</strong>ta<strong>in</strong>ed at 100 bar and constant temperature, CCN for a given liquid is<br />
only dependent on throttle geometry. For further details see refs. [1] and [2].<br />
2. Scope of results<br />
The results section of this paper starts with a demonstration of nozzle <strong>flow</strong> and spray modes.<br />
It is understood that at sufficiently <strong>high</strong> <strong>pressure</strong> drop, the <strong>flow</strong> through the nozzle is<br />
cavitat<strong>in</strong>g. This requires the local <strong>pressure</strong> to drop below vapour <strong>pressure</strong> and thus raises the<br />
<strong>in</strong>terest for <strong>pressure</strong> field distribution <strong>in</strong>side the nozzle. Consequently, <strong>flow</strong> velocities come<br />
<strong>in</strong>to the <strong>in</strong>terest, both <strong>in</strong>side the nozzle, as well as <strong>in</strong> the free spray. As nozzle geometry is a<br />
design parameter for hydraulic <strong>flow</strong> eng<strong>in</strong>eer<strong>in</strong>g, the <strong>in</strong>fluence of macroscopic dimensions<br />
such as sharp and smooth <strong>in</strong>let curvatures as well as the <strong>in</strong>fluence of surface irregularities<br />
(roughness) on cavitation are tested.<br />
3. Nozzle <strong>flow</strong> and spray modes<br />
Rais<strong>in</strong>g the <strong>in</strong>let <strong>pressure</strong> <strong>in</strong> a transient <strong>flow</strong> experiment first yields a lam<strong>in</strong>ar, straight jet<br />
which, at <strong>in</strong>creas<strong>in</strong>g <strong>pressure</strong> drop, transits <strong>in</strong>to a turbulent spray with an apparently larger<br />
macroscopic spray cone angle. As the spray cone angle is accessible for systematic studies<br />
also <strong>in</strong> unmodified spray experiments, there is vast literature to describe spray cone and spray<br />
core trends <strong>in</strong> response to <strong>in</strong>jection system parameters [3,4]. The view <strong>in</strong>to the model nozzle<br />
hole <strong>in</strong> Figs. 2 and 3 shows the transition from liquid phase nozzle <strong>flow</strong> at low <strong>pressure</strong>s to<br />
cavitat<strong>in</strong>g <strong>flow</strong> at <strong>pressure</strong>s above 210 - 290 bar. The characteristics of this cavitat<strong>in</strong>g nozzle<br />
<strong>flow</strong> <strong>in</strong> the 2D arrangement of our experiment are the cavitation downstream of the nozzle<br />
<strong>in</strong>let and the central liquid core at the <strong>in</strong>let. In the actual experiment this <strong>in</strong>ternal nozzle <strong>flow</strong><br />
pattern is fully established at <strong>pressure</strong>s above 290 bar, see the summary <strong>in</strong> the transient<br />
<strong>pressure</strong> chart of Fig. 4.<br />
The <strong>in</strong>ternal nozzle <strong>flow</strong> pattern with the liquid core surrounded by cavitation layers perta<strong>in</strong>s<br />
as <strong>in</strong>let <strong>pressure</strong> is raised up to 1100 bar. The only noticeable variation is the shorten<strong>in</strong>g of the
central liquid core, see Fig. 3. Similar experiments have been reported from transparent 3D<br />
nozzle experiments [4,5].<br />
Transparent<br />
diesel <strong>fuel</strong><br />
ambient air<br />
43 195 209 296 bar<br />
800 µm<br />
cavitation<br />
5mm<br />
Spray<br />
Not accessable<br />
for optics if <strong>in</strong>jected<br />
<strong>in</strong>to free air<br />
Lam<strong>in</strong>ar jet<br />
Turbulent spray<br />
Fig. 2 Ris<strong>in</strong>g <strong>in</strong>let <strong>pressure</strong> first yields a lam<strong>in</strong>ar jet, then<br />
a turbulent spray and f<strong>in</strong>ally a cavitat<strong>in</strong>g turbulent spray<br />
F<strong>in</strong>al P <strong>in</strong><br />
= 300 500 800 1100 bar<br />
Actual P <strong>in</strong><br />
= 209 255 256 296 bar<br />
P <strong>in</strong> = 300 500 800 1100 bar<br />
At transition to<br />
cavitat<strong>in</strong>g <strong>flow</strong><br />
full cavitation at f<strong>in</strong>al<br />
establishes around press. of<br />
bar bar<br />
210 - 225 300<br />
- 255 - 500<br />
220 - 256 800<br />
220 - 296 1100<br />
Color code<br />
red: transparent<br />
blue: non transparent<br />
green - yellow: transition<br />
Stationary <strong>flow</strong><br />
Fig. 3 Cavitat<strong>in</strong>g turbulent spray with cavitation at the nozzle <strong>in</strong>let extend<strong>in</strong>g towards<br />
the nozzle hole exit and a liquid core <strong>in</strong> the central nozzle hole entrance area<br />
Pressure, bar<br />
1200<br />
1000<br />
800<br />
600<br />
400<br />
Inlet 300bar<br />
Inlet 500bar<br />
Inlet 800bar<br />
Inlet 1100bar<br />
Cavitation<br />
Spray<br />
mode<br />
Cavitat<strong>in</strong>g<br />
200<br />
Turbulent<br />
0<br />
Lam<strong>in</strong>ar<br />
1000 1200 1400 1600 1800 2000 2200<br />
Time, µs<br />
Fig. 4 Pressure chart shows transition from turbulent <strong>in</strong>to fully cavitat<strong>in</strong>g spray mode
300 500 800 1100 bar<br />
When f<strong>in</strong>al <strong>pressure</strong> is<br />
established:<br />
- Liquid core <strong>in</strong> nozzle<br />
- above 80% <strong>pressure</strong><br />
drop with<strong>in</strong> 1 nozzle<br />
diameter downstream of<br />
<strong>in</strong>let<br />
1100 bar<br />
1 bar<br />
Fig. 5 Pressure distribution <strong>in</strong> liquid core at nozzle entrance<br />
The <strong>pressure</strong> drop with<strong>in</strong> the liquid core is shown <strong>in</strong> Fig. 5. The <strong>in</strong>terferometric measurements<br />
show that the ma<strong>in</strong> part of the <strong>in</strong>let <strong>pressure</strong> is already converted with<strong>in</strong> about 1 nozzle<br />
diameter downstream of the geometric entrance. The structure of the <strong>pressure</strong> field,<br />
furthermore, is rather <strong>in</strong>dependent of the overall <strong>pressure</strong>.<br />
The velocity profile of the liquid core is quite uniform across the diameter, see Fig. 6.<br />
Velocities of the free spray are given <strong>in</strong> Fig. 7. The profiles are essentially flat across the<br />
spray (see also [6]) and they drop at the spray periphery. The velocity and <strong>pressure</strong> field data<br />
are compared with Bernoulli estimates of the <strong>pressure</strong> drop to velocity conversion. For the<br />
cross section M1 <strong>in</strong>side the nozzle and for the free spray velocities at the position 5 mm<br />
downstream of the orifice, the data are summarised <strong>in</strong> Table 1. The actually measured<br />
velocities, both <strong>in</strong>side the nozzle hole, as well as <strong>in</strong> the free spray are consistently about 10%<br />
below the Bernoulli estimate.<br />
350<br />
300<br />
M1<br />
115µ<br />
Velocity, m/s<br />
250<br />
200<br />
150<br />
100<br />
50<br />
M1-300bar<br />
M1-500bar<br />
M1-800bar<br />
0<br />
0 20 40 60 80 100 120<br />
Position <strong>in</strong> channel, µm<br />
Fig. 6 Velocity profiles <strong>in</strong>side the rectangular spray hole
600<br />
500<br />
Velocity, m/s<br />
400<br />
300<br />
200<br />
300bar<br />
100<br />
500bar<br />
800bar<br />
0<br />
1100bar<br />
0 200 400 600 800 1000<br />
Position across spray, µm<br />
Fig. 7 Velocity profiles <strong>in</strong> the free spray<br />
Table 1. Velocity measurements <strong>in</strong> nozzle <strong>flow</strong> and spray. Comparison with Bernoulli velocities<br />
P <strong>in</strong>j ,<br />
bar<br />
V Bernoulli<br />
Flow-M1<br />
m/s<br />
V LIF<br />
Flow-M1<br />
m/s<br />
V LIF /V Bern<br />
Flow-M1<br />
V Bernoulli<br />
Spray<br />
m/s<br />
V LIF<br />
Spray at 5mm<br />
m/s<br />
V LIF /V Bern<br />
Spray<br />
300 239 215 0.90 267 239 0.89<br />
500 309 282 0.91 345 312 0.91<br />
800 390 355 0.91 436 392 0.90<br />
1100 - - - 512 488 0.95<br />
The Bernoulli velocity is calculated from the <strong>pressure</strong> drop ∆P and the fluid density (840<br />
kg/m³ for diesel <strong>fuel</strong> of this experiment)<br />
5<br />
2 ⋅∆P(<br />
bar)<br />
⋅10<br />
V Bern<br />
( m / s)<br />
=<br />
(3)<br />
840<br />
Local <strong>pressure</strong> levels were obta<strong>in</strong>ed from the <strong>in</strong>terferometry measurements. For the position<br />
M1 the actual <strong>pressure</strong> drop is approximately ÄP M1 =0.8 P <strong>in</strong>j.<br />
4. Phenomena analysis<br />
Follow<strong>in</strong>g the above overview of nozzle and spray <strong>flow</strong> properties, focus was given <strong>in</strong>to the<br />
further analysis of<br />
• back <strong>pressure</strong> <strong>in</strong>fluence on <strong>in</strong>ternal nozzle <strong>flow</strong><br />
• <strong>in</strong>jection <strong>in</strong>to gas (nozzle <strong>flow</strong>) versus <strong>in</strong>jection <strong>in</strong>to liquid (throttle <strong>flow</strong>)<br />
• cavitation formation: where does it appear, how can cavitation regimes grow<br />
• geometry <strong>in</strong>fluence on <strong>in</strong>cipient cavitation: macroscopic and microscopic effects
4.1 Back <strong>pressure</strong> <strong>in</strong>fluence<br />
Inject<strong>in</strong>g <strong>in</strong>to pressurised gas atmosphere requires <strong>high</strong>er <strong>in</strong>let <strong>pressure</strong>s to establish fully<br />
cavitat<strong>in</strong>g nozzle <strong>flow</strong>. The nozzle <strong>flow</strong> patterns of Fig. 8 show the formation of cavitation<br />
regimes <strong>in</strong> the <strong>flow</strong> separation areas at the <strong>in</strong>let throat. Downstream of the entrance<br />
contraction, however, the full liquid <strong>flow</strong> is re-established and aga<strong>in</strong> attaches to the nozzle<br />
wall. For the actual nozzle geometry, it requires <strong>in</strong>let <strong>pressure</strong>s above 300 bar to generate full<br />
cavitation along the nozzle hole if back <strong>pressure</strong> is 50 bar, see Fig. 8. Fig. 9 gives a<br />
comparison of stationary <strong>flow</strong> patterns at various constant <strong>in</strong>let and outlet <strong>pressure</strong><br />
comb<strong>in</strong>ations.<br />
Injection <strong>pressure</strong> ris<strong>in</strong>g to 300 bar<br />
Injection <strong>pressure</strong> ris<strong>in</strong>g to 800 bar<br />
Back <strong>pressure</strong> at 50 bar<br />
Back <strong>pressure</strong> at 50 bar<br />
Fig. 8 Internal nozzle <strong>flow</strong> patterns as <strong>in</strong>let <strong>pressure</strong> rises to 300 and 800 bar, respectively<br />
Stationary <strong>in</strong>let and outlet <strong>pressure</strong> conditions<br />
300 bar 500 bar 800 bar<br />
1, 30, 50 bar<br />
1, 30, 50 bar 1, 30, 50 bar<br />
Fig. 9 Nozzle <strong>flow</strong> patterns at stationary <strong>in</strong>let and outlet <strong>pressure</strong> conditions<br />
4.2 Injection <strong>in</strong>to gas versus <strong>in</strong>jection <strong>in</strong>to liquid<br />
Experiments were also done with <strong>in</strong>jection <strong>in</strong>to liquid rather than gas. The results show that<br />
the <strong>flow</strong> <strong>in</strong>side the nozzle hole, once full cavitation is established, and especially under<br />
stationary conditions, has no apparent difference. There is of course different behaviour under<br />
transient conditions, as downstream liquid has to be accelerated and generates dynamic back<br />
<strong>pressure</strong> for the upstream <strong>flow</strong>. At stationary conditions <strong>flow</strong> patterns are practically identical,<br />
see the example <strong>in</strong> Fig. 10.
800 bar<br />
Air Diesel<br />
30 bar 30 bar<br />
Fig. 10 Injection <strong>in</strong>to gas and liquid. Under cavitation conditions<br />
no apparent difference of <strong>in</strong>ternal nozzle <strong>flow</strong> pattern<br />
As a consequence of the <strong>in</strong>dependence of the downstream medium on cavitat<strong>in</strong>g stationary<br />
nozzle <strong>flow</strong>, nozzle hole cavitation studies (liquid <strong>in</strong>to gas) and throttle hole cavitation studies<br />
(liquid <strong>in</strong>to liquid) are equivalent as far as they are conf<strong>in</strong>ed to the regime upstream of the exit<br />
orifice plane.<br />
This equivalence makes it possible to discuss a large number of cavitation effect, especially<br />
those which are relevant for throttle or nozzle <strong>in</strong>let <strong>flow</strong> on the same basis. Cavitation<br />
formation, <strong>in</strong>let geometry effects and boundary layer phenomena are typical examples.<br />
4.3 Cavitation formation: where does it appear, how can cavitation regimes grow<br />
Throttle cavitation studies have <strong>in</strong> detail been presented <strong>in</strong> [1] and [7]. These papers cover<br />
overall hydraulic <strong>flow</strong> assessment as well as local <strong>flow</strong> field data for <strong>pressure</strong> and velocities.<br />
Cavitation formation at <strong>in</strong>let contractions was essentially identified as the result of local shear<br />
<strong>flow</strong> effects - i. e. <strong>flow</strong> velocity profiles - under the <strong>in</strong>fluence of and <strong>in</strong>teraction with local<br />
static <strong>pressure</strong> conditions. Both were found to be the result of the overall <strong>pressure</strong> and<br />
geometry conditions for the given <strong>flow</strong> medium (and temperature). The "critical cavitation<br />
number" CCN which <strong>in</strong> practical applications is used to describe the cavitation property of a<br />
specific throttle arrangement was found to be l<strong>in</strong>ked to the transition from partial to full<br />
cavitation <strong>in</strong>side the throttle orifice [7] .<br />
4.4 Geometry <strong>in</strong>fluence on <strong>in</strong>cipient cavitation: macroscopic and microscopic effects<br />
The study <strong>in</strong> [1] has shown that cavitation at the <strong>in</strong>let contraction <strong>in</strong>to a throttle hole for<br />
nom<strong>in</strong>ally identical macroscopic <strong>in</strong><strong>flow</strong> geometry occurs at nearly identical overall <strong>flow</strong><br />
velocities or mass<strong>flow</strong>s. Macroscopic geometry and mass<strong>flow</strong>, thus result <strong>in</strong> identical local<br />
conditions for cavitation, see also Table 2.<br />
A large <strong>in</strong>let radius (throttle YL) considerably raises CCN, as cavitation requires <strong>high</strong>er<br />
<strong>pressure</strong> drop to be established. The roughen<strong>in</strong>g of the throttle surface, however, decreases<br />
CCN (throttle YR).
Table 2 J, U, W data from [1] with corrected and updated velocities. YR: rough surface, YL: smooth<br />
surface. For all throttles: 301 µm thick steel sheet, sharp outlet, 1 mm throttle length, 100 bar <strong>in</strong>let<br />
<strong>pressure</strong>.<br />
Throttle Inlet Inlet Outlet Contrac<br />
tion<br />
radius width width<br />
Hydraulic data at<br />
cavitation start CS<br />
Hydraulic data at<br />
critical cavitation CC<br />
R1 D1 D2 Äp mass CN v Äp mass fl. CCN v<br />
fl.<br />
µm µm µm % [bar] [g/s] [m/s] [bar] [g/s] [m/s]<br />
J 20 299 299 0 57.0 7.21 1.33 110 65.0 7.72 1.86 124<br />
U 20 301 284 5 60.0 7.17 1.50 109 70.0 7.74 2.33 123<br />
W 20 301 270 10 67.0 7.17 2.03 112 77.0 7.76 3.35 135<br />
YL 100 299 299 0 84 9.07 5.26 117 87.0 9.55 6.70 120<br />
YR 100 312 312 0 68 8.65 2.13 115 76.0 9.45 3.17 127<br />
The hydraulic data, the <strong>flow</strong> field analysis and the comparison of the smooth and rough<br />
throttle (YL and YR) details are given <strong>in</strong> Fig. 11 to 15. Observe that the YR throttle is 13 µm<br />
wider than the YL throttle!<br />
Mass<strong>flow</strong> - g/s<br />
10<br />
9<br />
8<br />
7<br />
6<br />
CCN = 3.17<br />
CCP = 76bar<br />
YR rough<br />
CCN = 6.70<br />
CCP = 87bar<br />
YL smooth<br />
5<br />
20 30 40 50 60 70 80 90 100<br />
Pressure difference - bar<br />
Fig. 11 Hydraulic data of YL and YR throttle. Notice that YR throttle is 13 µm wider
P diff<br />
= 68 bar<br />
P diff<br />
= 76 bar<br />
P diff = 99 bar<br />
YL: smooth<br />
YR: rough<br />
P diff = 76 bar<br />
P diff<br />
= 99 bar<br />
100 bar<br />
YL: smooth<br />
1 bar<br />
YR: rough<br />
Fig. 12 Cavitation field and <strong>pressure</strong> field of YL and YR throttle<br />
P diff = 76 bar<br />
YL: smooth<br />
P diff = 87 bar<br />
3 µm 10 µm<br />
YR: rough<br />
25 µm 30 µm<br />
Fig. 13 Cavitation boundary layers for smooth and rough <strong>in</strong><strong>flow</strong><br />
YL smooth<br />
YR rough<br />
P diff<br />
= 100 bar P diff<br />
= 76 bar<br />
Pressure - bar<br />
Pressure - bar<br />
120<br />
100<br />
80<br />
60<br />
40<br />
20<br />
0<br />
120<br />
100<br />
80<br />
60<br />
40<br />
20<br />
IN<br />
IN<br />
Middle<br />
High<br />
Low<br />
Middle<br />
OUT<br />
-0.5 0 0.5 1<br />
Position - mm<br />
OUT<br />
Pressure - bar<br />
Pressure - bar<br />
120<br />
100<br />
80<br />
60<br />
40<br />
20<br />
0<br />
120<br />
100<br />
80<br />
60<br />
40<br />
20<br />
IN<br />
-0.5 0 0.5 1<br />
Position - mm<br />
IN<br />
Middle<br />
High<br />
Low<br />
Middle<br />
OUT<br />
OUT<br />
Middle, <strong>high</strong>, low<br />
position <strong>in</strong> channel<br />
0<br />
-0.5 0 0.5 1<br />
Position - mm<br />
0<br />
-0.5 0 0.5 1<br />
Position - mm<br />
Fig. 14 Comparison of <strong>pressure</strong> profiles along control l<strong>in</strong>es
IN<br />
Position <strong>in</strong> channel<br />
M1<br />
300<br />
300<br />
YL: smooth YR: rough<br />
Position <strong>in</strong> channel - µm<br />
Position <strong>in</strong> channel - µm<br />
250<br />
200<br />
<strong>in</strong>-50<br />
150<br />
<strong>in</strong>-76<br />
100<br />
<strong>in</strong>-100<br />
50<br />
0<br />
0 20 40 60 80 100 120 140 160<br />
Velocity - m/sec<br />
300<br />
250<br />
200<br />
<strong>in</strong>-50<br />
150<br />
<strong>in</strong>-76<br />
100<br />
<strong>in</strong>-100<br />
50<br />
Position <strong>in</strong> channel - µm<br />
Position <strong>in</strong> channel - µm<br />
250<br />
200<br />
m1-50<br />
150<br />
m1-76<br />
100 m1-100<br />
50<br />
0<br />
0 20 40 60 80 100 120 140 160<br />
Velocity - m/sec<br />
300<br />
250<br />
200<br />
m1-50<br />
150<br />
m1-76<br />
100 m1-100<br />
50<br />
0<br />
0 20 40 60 80 100 120 140 160<br />
Velocity - m/sec<br />
0<br />
0 20 40 60 80 100 120 140 160<br />
Velocity - m/sec<br />
Fig. 15 Velocity profiles <strong>in</strong> <strong>flow</strong> channel for smooth and rough surface throttle<br />
The overall comparison shows that the rough surface <strong>in</strong> the YR throttle generates the usual<br />
cavitation layer <strong>in</strong> the <strong>flow</strong> separation regime at the throttle entrance. At <strong>in</strong>creas<strong>in</strong>g <strong>pressure</strong><br />
drop these cavitation areas <strong>in</strong>crease <strong>in</strong> a similar way as is also found <strong>in</strong> sharp edged throttle<br />
<strong>in</strong>lets [1]. Without the roughen<strong>in</strong>g, the <strong>in</strong>let <strong>flow</strong> <strong>in</strong>to throttle YL just forms very small<br />
cavitation layers. Even at the maximum <strong>pressure</strong> drop of this experiment, at 100 bar <strong>in</strong>let<br />
aga<strong>in</strong>st 1 bar outlet <strong>pressure</strong>, the throttle hole still is ma<strong>in</strong>ly filled with transparent liquid,<br />
rather than cavitation bubbles. Cavitation, however occurs across the entire cross section of<br />
the exit orifice.<br />
Enlarged photographs of the throttle <strong>in</strong>let show the growth of the cavitation layers <strong>in</strong> both the<br />
rough and the smooth throttle, Fig. 13. Cavitation bubbles <strong>in</strong> the rough throttle are generated<br />
downstream of surface irregularities. They are then convected <strong>in</strong>to the entrance <strong>flow</strong><br />
contraction, where they can cover an ever grow<strong>in</strong>g area as <strong>pressure</strong> drop is <strong>in</strong>creased (outlet<br />
<strong>pressure</strong> is decreased). Under the same overall conditions, the smooth surface of throttle YL<br />
does not provide the irregularities to generate sufficient cavitation sources at the entrance<br />
contraction. The cavitation layers <strong>in</strong> the <strong>in</strong>let <strong>flow</strong> contraction stay small even as downstream<br />
<strong>pressure</strong> is decreased to ambient.<br />
The <strong>pressure</strong> field comparison <strong>in</strong> Fig. 12 shows the consequence of this cavitation layer<br />
mechanism with respect to the entire <strong>flow</strong> cross section. With the <strong>flow</strong> separation and<br />
cavitation layer build-up at the rough throttle, the <strong>pressure</strong> near the wall first drops and then<br />
recovers aga<strong>in</strong> before full cavitation is established. With the smooth surface throttle, the<br />
<strong>pressure</strong> drop is conf<strong>in</strong>ed to a very narrow layer at the throttle wall. This overall trend is<br />
further shown with the <strong>pressure</strong> profile data along the throttle centre and along boundary<br />
l<strong>in</strong>es, see Fig. 14.<br />
The velocity profiles of these <strong>flow</strong> situations are given <strong>in</strong> Fig. 15 for 50, 76 and 100 bar<br />
<strong>pressure</strong> drop for the cross sections "IN" and "M1" near the throttle <strong>in</strong>let, see positions <strong>in</strong> the<br />
figure <strong>in</strong>sert. In the <strong>in</strong>let cross section IN, velocity profiles of both the rough and smooth
throttle show a turbulent profile across the ma<strong>in</strong> part of the throttle channel. Near the wall,<br />
there is the typical velocity <strong>in</strong>crease due to the <strong>in</strong>cipient cavitation (gas) boundary layer <strong>in</strong> the<br />
rough throttle. This <strong>in</strong>creased velocity layer extends for about 30 µm on either side of the YR<br />
throttle. With the smooth throttle, this <strong>high</strong> velocity boundary layer is considerably smaller<br />
(10 to 20µm at most), and with<strong>in</strong> a 5 µm layer near the wall, there is even velocity drop<br />
discernible.<br />
At the downstream cross section M1, the velocity profiles have considerably changed. With<br />
the rough surface throttle YR, the cavitation near the wall allows the velocity profiles to peak<br />
as lam<strong>in</strong>ar liquid surface layers do not exist. In contrast, the smooth surface throttle YL shows<br />
that the velocity profiles drop significantly with<strong>in</strong> a boundary layer of around 40 µm from<br />
about 100 m/s to near zero.<br />
5. Summary<br />
High <strong>pressure</strong> <strong>fuel</strong> <strong>in</strong>jection events have been studied <strong>in</strong> a transparent model nozzle and<br />
model throttle, respectively. A 2-D experimental arrangement provided the optical access for<br />
the comprehensive study of the <strong>pressure</strong>-, velocity- and cavitation fields generated by the <strong>flow</strong><br />
through the nozzle or throttle orifice.<br />
Nozzle experiments have shown that the <strong>high</strong> <strong>pressure</strong> <strong>flow</strong> through the model nozzle hole is<br />
always governed by cavitation. As full cavitation at the nozzle hole entrance is established at<br />
around 250 bar, a <strong>high</strong>ly stabilised <strong>flow</strong> pattern compris<strong>in</strong>g a central liquid core <strong>in</strong> the<br />
entrance to the nozzle hole and surround<strong>in</strong>g cavitation areas is ma<strong>in</strong>ta<strong>in</strong>ed even as <strong>in</strong>let<br />
<strong>pressure</strong> is <strong>in</strong>creased up to 1100 bar.<br />
Back<strong>pressure</strong> at the nozzle exit requires <strong>high</strong>er <strong>in</strong>let <strong>pressure</strong> to establish full cavitation.<br />
Injection <strong>in</strong>to liquid rather than gas has no noticeable <strong>in</strong>fluence on the <strong>flow</strong>, once full<br />
cavitation is established. It has, however, <strong>in</strong>fluence under transient conditions as it requires<br />
acceleration and deceleration of the fluid.<br />
Cavitation was always found to be governed by the macroscopic <strong>flow</strong> (<strong>pressure</strong> drop and <strong>flow</strong><br />
geometry) which allows low <strong>pressure</strong> areas to be established together with <strong>high</strong> shear force<br />
<strong>flow</strong> regimes.<br />
Incipient cavitation was found to orig<strong>in</strong>ate <strong>in</strong> shear layers, either with<strong>in</strong> the <strong>flow</strong>, or at wall<br />
boundary layers. Wall boundary layers are susceptible to surface irregularities, and,<br />
consequently, rough surfaces near low <strong>pressure</strong> <strong>flow</strong> areas are act<strong>in</strong>g as triggers for<br />
microscopic <strong>flow</strong> separation and ensu<strong>in</strong>g formation of cavitation layers. Via <strong>in</strong>teraction with<br />
the overall <strong>flow</strong>, these microscopic irregularities can <strong>in</strong>itiate large scale <strong>flow</strong> effects <strong>in</strong> the<br />
downstream <strong>flow</strong> field. Examples have been given for a rounded <strong>in</strong>let throttle with smooth<br />
and rough surfaces.<br />
References<br />
[1] E. W<strong>in</strong>klhofer, E. Kull, E. Kelz, A. Morozov: Comprehensive hydraulic and <strong>flow</strong> field<br />
documentation <strong>in</strong> model throttle experiments under cavitation conditions (<strong>ILASS</strong> <strong>Europe</strong><br />
2001, Zürich, Sept. 2001)<br />
[2] E. W<strong>in</strong>klhofer, H. Philipp, A. Hirsch, A. Morozov: Cavitation and spray formation <strong>in</strong> diesel<br />
<strong>flow</strong> situations (<strong>ILASS</strong> <strong>Europe</strong> 2000, Darmstadt 11-13 September 2000)<br />
[3] H. Hiroyasou, M. Arai: Structure of <strong>fuel</strong> sprays <strong>in</strong> diesel eng<strong>in</strong>es (SAE 900475)
[4] V. Schwarz, G. König, M. Bless<strong>in</strong>g, C. Krüger, U. Michels: E<strong>in</strong>fluss von Strömungs- und<br />
Kavitationsvorgängen <strong>in</strong> Diesele<strong>in</strong>spritzdüsen auf Strahlausbreitung, Gemischbildung,<br />
Verbrennung und Schadstoffbildung bei HD-Dieselmotoren (Berichte zur Energie- und<br />
Verfahrenstechnik, ISBN 3-931901-27-0, Erlangen, 2003)<br />
[5] H. Chaves, M. Knapp, A. Kubitzek, F. Obermeier, T. Schneider: Experimental study of<br />
cavitation <strong>in</strong> the nozzle hole of diesel <strong>in</strong>jectors us<strong>in</strong>g transparent nozzles. (SAE 950290)<br />
[6] C. Schugger, U. Renz: Experimental <strong>in</strong>vestigation of the primary breakup of <strong>high</strong> <strong>pressure</strong><br />
diesel sprays (<strong>ILASS</strong> <strong>Europe</strong> 2001, Zurich 2-6 Sept. 2001)<br />
[7] E. Kull, E. W<strong>in</strong>klhofer: E<strong>in</strong>fluss der Geometrie e<strong>in</strong>es Spritzlochmodells auf Kavitation und<br />
Massenstrom (Berichte zur Energie- und Verfahrenstechnik, ISBN 3-931901-27-0, Erlangen,<br />
2003)