Emigration 2009 - Department of Immigration & Citizenship
Emigration 2009 - Department of Immigration & Citizenship
Emigration 2009 - Department of Immigration & Citizenship

You also want an ePaper? Increase the reach of your titles
YUMPU automatically turns print PDFs into web optimized ePapers that Google loves.
<strong>Emigration</strong><br />
2008-<strong>2009</strong>
<strong>Emigration</strong><br />
2008-09<br />
Australia
© Commonwealth <strong>of</strong> Australia <strong>2009</strong><br />
This work is copyright. You may download, display, print and reproduce this material in unaltered form<br />
only (retaining this notice) for your personal, non-commercial use or use within your organisation. Apart<br />
from any use as permitted under the Copyright Act 1968, all other rights are reserved.<br />
Requests for further authorisation should be directed to the:<br />
Commonwealth Copyright Administration,<br />
Copyright Law Branch,<br />
Attorney-General’s <strong>Department</strong><br />
Robert Garran Offices<br />
National Circuit<br />
Barton ACT 2600<br />
Fax: 02 6250 5989<br />
Email: commonwealth.copyright@ag.gov.au.<br />
Prepared by Principal Adviser Migration Strategies<br />
Published by the National Communications Branch <strong>of</strong> the <strong>Department</strong> <strong>of</strong> <strong>Immigration</strong> and <strong>Citizenship</strong><br />
6 Chan Street Belconnen ACT 2617<br />
ISSN 1324-3411
List <strong>of</strong> graphs<br />
Table <strong>of</strong> contents<br />
Figure 1 States/territories <strong>of</strong> residence 1994-95 to 2008-09 permanent departures 3<br />
Main Features 1<br />
Tables 5<br />
Table 1<br />
Permanent arrivals and departures by Australia born/overseas born, 1975-76 to<br />
2008-09 6<br />
Table 2 Long term departures and arrivals, visitors and residents 1976-77 to 2008-09 7<br />
Table 3 Permanent departures by region/country <strong>of</strong> birth, 1998-99 to 2008-09 8<br />
Table 4 Permanent departures by age, 1995-96 to 2008-09 15<br />
Table 5 Permanent departures by sex, 1995-96 to 2008-09 15<br />
Table 6<br />
Permanent departures by region/country <strong>of</strong> future residence, 1998-99 to<br />
2008-09 16<br />
Table 7 Permanent departures by region/country <strong>of</strong> birth and age, 2008-09 23<br />
Table 8<br />
Table 9<br />
Table 10<br />
Table 11<br />
Overseas born permanent departures by region/country <strong>of</strong> birth and period <strong>of</strong><br />
residence, 2008-09 29<br />
Overseas born permanent departures by selected birthplaces and country <strong>of</strong><br />
future residence, 2008-09 35<br />
Australia born permanent departures by region/country <strong>of</strong> future residence,<br />
1998-99 to 2008-09 36<br />
Overseas born permanent departures by region/country <strong>of</strong> future residence,<br />
1998-99 to 2008-09 42<br />
Table 12 Permanent departures by occupation and sex, 2008-09 49<br />
Table 13 Long term departures by occupation and sex, 2008-09 50<br />
Table 14 Permanent departures by age and state <strong>of</strong> residence, 2008-09 51<br />
Table 15 Permanent departures by top 20 countries <strong>of</strong> birth 2008-09 52<br />
Table 16 Permanent departures by top 20 countries <strong>of</strong> future residence 2008-09 52
Explanatory notes 53<br />
Country classification (based on SACC) 55<br />
Statistical publications 58
1<br />
Main Features<br />
In the financial year <strong>of</strong> 2008-09:<br />
In total<br />
The number <strong>of</strong> permanent departures was 81 018, an increase <strong>of</strong> 5.3 per cent over the previous year.<br />
Since 1975-76 permanent departures have ranged from a low <strong>of</strong> 18 100 in 1985-86 to 81 018 in<br />
2008-09.<br />
Permanent departures as a proportion <strong>of</strong> permanent arrivals was lowest (14.3 per cent) in 1987-88 and<br />
highest (54.3 per cent) in 2001-02.<br />
Overseas born residents departing permanently as a proportion <strong>of</strong> total permanent departures has been<br />
approximately 50 per cent since 1998-99.<br />
Of the total permanent departures 50.9 per cent were born in Australia (incl ext territories).<br />
By country <strong>of</strong> birth<br />
Of the 39 769 permanent departures who were born overseas, 20.1 per cent were born in New<br />
Zealand and 15.5 per cent were born in the United Kingdom.<br />
By period <strong>of</strong> residence<br />
Of the 39 769 permanent departures who were born overseas, 69.2 per cent had resided in<br />
Australia for five years or more.<br />
13.9 per cent <strong>of</strong> overseas born permanent departures had lived in Australia for less than two<br />
years.<br />
By major region, Southeast Asia had the highest proportion who had resided in Australia for five<br />
years or more at 72.7 per cent, while Central Asia was the lowest at 55.8 per cent, from a small<br />
base <strong>of</strong> 104 persons total, followed by Northern America at 62.5 per cent.<br />
By occupation<br />
Of the total permanent departures, 47.8 per cent were in skilled occupations. Of these, 56.0 per<br />
cent were Australian born and 44.0 per cent were overseas born.<br />
56.2 per cent <strong>of</strong> male and 39.0 per cent <strong>of</strong> female permanent departures were in skilled<br />
occupations<br />
30.5 per cent <strong>of</strong> all permanent departures were not in the labour force.<br />
By age and state/territory <strong>of</strong> residence<br />
The age distribution <strong>of</strong> permanent departures is similar for all state/territories. The age group<br />
25-34 years was the largest except for the Northern Territory, followed by the 35-44 years age<br />
group, except for the Northern territory were it is the largest, then 45-54 years respectively.<br />
For all states/territories more than 45 per cent <strong>of</strong> permanent departures were aged 25-44 years.<br />
This age group ranged from a low <strong>of</strong> 45.9 per cent for Queensland to a high <strong>of</strong> 52.5 per cent for<br />
Victoria.<br />
New South Wales (40.9 per cent) was the state where the largest number <strong>of</strong> permanent<br />
departures previously resided followed by Victoria (21.1 per cent) and Queensland (20.6 per<br />
cent).
2<br />
By country <strong>of</strong> future residence<br />
The main countries <strong>of</strong> intended residence for all permanent departures were New Zealand<br />
(17.7 per cent), the United Kingdom (17.0 per cent), the United States <strong>of</strong> America (9.3 per cent)<br />
and Hong Kong (SAR <strong>of</strong> China) (7.3 per cent).<br />
For the past 10 years 1999-00 to 2008-09, the major countries <strong>of</strong> future residence for Australia<br />
born permanent departures have been the United Kingdom 21.4 per cent (65 188), New<br />
Zealand 16.5 per cent (50 408) and the United States <strong>of</strong> America 14.7 per cent (44 749).<br />
For the past 10 years 1999-00 to 2008-09, the major countries <strong>of</strong> future residence for overseas<br />
born permanent departures have been New Zealand 24.4 per cent (73 368), the United<br />
Kingdom 13.2 per cent (39 745) and Hong Kong (SAR <strong>of</strong> China) 10.0 per cent (30 203).<br />
For 2008-09, <strong>of</strong> the permanent departures <strong>of</strong> overseas born 59.8 percent indicated their future<br />
country <strong>of</strong> residence was the same as their birthplace.<br />
For major source countries, the highest proportions <strong>of</strong> the overseas born permanent departures<br />
who indicated the same country <strong>of</strong> future residence as their birthplace were New Zealand 80.9<br />
per cent, Hong Kong (SAR <strong>of</strong> China) 79.6 per cent, Taiwan 74.7 per cent and China (excl SARs<br />
and Taiwan) 63.6 per cent.
Persons<br />
35 000<br />
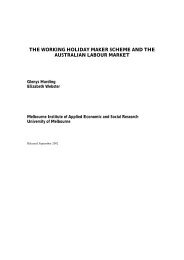
Figure 1<br />
States/territories <strong>of</strong> residence 1994-95 to 2008-09 permanent departures (continued overleaf)<br />
Vic Qld SA WA NSW<br />
Persons<br />
35 000<br />
30 000<br />
30 000<br />
25 000<br />
25 000<br />
20 000<br />
20 000<br />
15 000<br />
15 000<br />
10 000<br />
10 000<br />
5000<br />
5 000<br />
0<br />
1994-95 1995-96 1996-97 1997-98 1998-99 1999-00 2000-01 2001-02 2002-03 2003-04 2004-05 2005-06 2006-07 2007-08 2008-09<br />
Financial year<br />
3
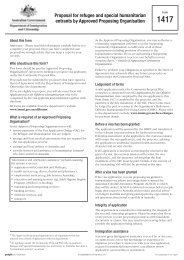
Figure 1 (continued) States/territories <strong>of</strong> residence 1994-95 to 2008-09 permanent departures<br />
4<br />
1 200<br />
Persons<br />
Tas NT ACT<br />
1 400<br />
1 000<br />
1 200<br />
800<br />
600<br />
400<br />
1 000<br />
800<br />
600<br />
400<br />
200<br />
200<br />
0<br />
1994-95 1995-96 1996-97 1997-98 1998-99 1999-00 2000-01 2001-02 2002-03 2003-04 2004-05 2005-06 2006-07 2007-08 2008-09<br />
Financial year
Tables
6<br />
Table 1<br />
Permanent arrivals and departures by<br />
Australia born (a) /overseas born, 1975-76 to 2008-09<br />
Financial Years<br />
Total settler<br />
arrivals<br />
Permanent<br />
departures<br />
Aust. born(a)<br />
Permanent<br />
departures O/S<br />
born<br />
Total<br />
permanent<br />
departures<br />
Permanent<br />
departures as a %<br />
<strong>of</strong> settler arrivals<br />
No. <strong>of</strong> settler<br />
arrivals minus<br />
perm.<br />
departures<br />
No. No. No. No. % No.<br />
1975-76 52 752 9 146 18 281 27 427 52.0 25 325<br />
1976-77 70 916 8 140 16 447 24 588 34.7 46 328<br />
1977-78 73 171 7 413 15 683 23 096 31.6 50 075<br />
1978-79 67 192 7 785 17 644 25 429 37.8 41 763<br />
1979-80 80 748 6 986 15 031 22 017 27.3 58 731<br />
1980-81 110 689 5 942 13 554 19 496 17.6 91 193<br />
1981-82 118 031 5 809 15 076 20 885 17.7 97 146<br />
1982-83 93 011 5 998 18 832 24 830 26.7 68 181<br />
1983-84 68 813 6 499 17 805 24 304 35.3 44 509<br />
1984-85 77 508 6 058 14 320 20 378 26.3 57 130<br />
1985-86 92 590 5 611 12 489 18 100 19.5 74 490<br />
1986-87 113 541 6 122 13 806 19 928 17.6 93 613<br />
1987-88 143 466 6 770 13 701 20 471 14.3 122 995<br />
1988-89 145 316 6 560 15 087 21 647 14.9 123 669<br />
1989-90 121 227 8 399 19 458 27 857 23.0 93 370<br />
1990-91 121 688 9 490 21 640 31 130 25.6 90 558<br />
1991-92 107 391 9 181 19 941 29 122 27.1 78 269<br />
1992-93 76 330 9 803 18 102 27 905 36.6 48 425<br />
1993-94 69 768 9 933 17 347 27 280 39.1 42 488<br />
1994-95 87 428 10 094 16 854 26 948 30.8 60 480<br />
1995-96 99 139 11 013 17 657 28 670 28.9 70 469<br />
1996-97 85 752 11 704 18 153 29 857 34.8 55 895<br />
1997-98 77 327 12 789 19 196 31 985 41.4 45 342<br />
1998-99 84 143 17 264 17 917 35 181 41.8 48 962<br />
1999-00 92 272 20 265 20 813 41 078 44.5 51 194<br />
2000-01 107 366 23 117 23 404 46 521 43.3 60 845<br />
2001-02 88 900 24 170 24 071 48 241 54.3 40 659<br />
2002-03 93 914 25 612 24 851 50 463 53.7 43 451<br />
2003-04 111 590 29 140 29 938 59 078 52.9 52 512<br />
2004-05 123 424 31 027 31 579 62 606 50.7 60 818<br />
2005-06 131 593 34 284 33 569 67 853 51.6 63 740<br />
2006-07 140 148 36 882 35 221 72 103 51.4 68 045<br />
2007-08 149 365 39 144 37 779 76 923 51.5 72 442<br />
2008-09 158 021 41 249 39 769 81 018 51.3<br />
(a) From 1982-83 Australia-born includes external territories.<br />
77 003
7<br />
Table 2<br />
Long term departures and arrivals, visitors and residents<br />
1976-77 to 2008-09<br />
Financial<br />
Years<br />
Long term<br />
resident<br />
returns<br />
Long term<br />
visitor<br />
arrivals<br />
Total long<br />
term arrivals<br />
Long term<br />
resident<br />
departures<br />
Long term<br />
visitor<br />
departures<br />
Total<br />
long term<br />
departures<br />
Long term<br />
departures<br />
as a % <strong>of</strong><br />
long term<br />
arrivals<br />
No. <strong>of</strong><br />
long term<br />
arrivals minus<br />
long term<br />
departures<br />
No. No. No. No. No. No. % No.<br />
1976-77 59 193 26 133 85 326 68 792 19 724 88 516 103.7 -3 190<br />
1977-78 57 311 28 043 85 354 60 099 19 194 79 293 92.9 6 061<br />
1978-79 60 947 34 063 95 010 57 256 21 215 78 471 82.6 16 539<br />
1979-80 59 963 29 586 89 549 52 114 19 228 71 342 79.7 18 207<br />
1980-81 59 871 34 220 94 091 47 848 18 778 66 626 70.8 27 465<br />
1981-82 57 856 34 764 92 620 46 496 20 312 66 808 72.1 25 812<br />
1982-83 48 986 30 742 79 728 47 020 25 438 72 458 90.9 7 270<br />
1983-84 49 188 27 282 76 470 49 490 24 951 74 441 97.3 2 029<br />
1984-85 53 773 31 975 85 748 51 706 23 163 74 869 87.3 10 879<br />
1985-86 56 557 37 249 93 806 49 694 24 669 74 363 79.3 19 443<br />
1986-87 53 597 37 325 90 922 48 854 26 540 75 394 82.9 15 528<br />
1987-88 54 804 43 978 98 782 50 499 28 054 78 553 79.5 20 229<br />
1988-89 53 798 50 766 104 564 57 733 33 258 90 991 87.0 13 573<br />
1989-90 53 967 56 728 110 695 62 300 37 899 100 199 90.5 10 496<br />
1990-91 59 062 55 649 114 711 66 883 43 629 110 512 96.3 4 199<br />
1991-92 62 920 63 861 126 781 67 191 47 971 115 162 90.8 11 619<br />
1992-93 69 594 57 842 127 436 65 446 47 744 113 190 88.8 14 246<br />
1993-94 75 600 62 000 137 600 64 786 47 921 112 707 81.9 24 893<br />
1994-95 79 063 72 032 151 095 68 377 50 156 118 533 78.4 32 562<br />
1995-96 79 206 84 372 163 578 70 253 54 133 124 386 76.0 39 192<br />
1996-97 80 170 95 079 175 249 73 777 62 971 136 748 78.0 38 501<br />
1997-98 84 358 103 756 188 114 79 422 74 872 154 294 82.0 33 820<br />
1998-99 67 910 119 892 187 802 82 861 57 420 140 281 74.7 47 521<br />
1999-00 79 651 133 198 212 849 84 918 71 850 156 768 73.7 56 081<br />
2000-01 82 893 158 311 241 204 92 945 73 431 166 376 69.0 74 828<br />
2001-02 88 598 175 873 264 471 92 071 79 375 171 446 64.8 93 025<br />
2002-03 95 784 184 095 279 879 86 211 82 894 169 105 60.4 110 774<br />
2003-04 98 400 191 327 289 727 84 336 93 282 177 618 61.3 112 109<br />
2004-05 101 301 202 195 303 496 91 635 94 707 186 342 61.4 117 154<br />
2005-06 103 898 221 923 325 821 98 113 92 175 190 288 58.4 135 533<br />
2006-07 110 041 263 296 373 337 101 610 101 491 203 101 54.4 170 236<br />
2007-08 110 832 321 845 432 677 102 066 124 006 226 072 52.2 206 605<br />
2008-09 114 985 389 299 504 284 84 810 160 347 245 157 48.6 259 127
8<br />
Table 3<br />
Permanent departures by region/country <strong>of</strong> birth,<br />
1998-99 to 2008-09<br />
Financial Year<br />
Birthplace 1998-99 1999-00 2000-01 2001-02 2002-03 2003-04 2004-05 2005-06 2006-07 2007-08 2008-09<br />
Oceania<br />
Australia (incl ext terr) 17 264 20 265 23 117 24 170 25 612 29 140 31 027 34 284 36 882 39 144 41 249<br />
New Zealand 3 788 4 526 5 157 5 714 6 251 7 063 6 897 7 099 7 566 7 820 8 003<br />
Melanesia<br />
New Caledonia 10 19 22 18 10 14 20 19 25 13 19<br />
Papua New Guinea 96 116 149 175 173 164 165 189 189 211 205<br />
Solomon Islands 7 18 6 11 3 7 17 12 12 11 21<br />
Vanuatu 12 11 15 8 10 11 14 18 13 11 19<br />
Total 125 164 192 212 196 196 216 238 239 246 264<br />
Micronesia<br />
Guam - 2 - 2 1 - - 5 1 2 3<br />
Kiribati 9 4 7 3 1 3 2 3 - 1 2<br />
Marshall Islands - - - 1 4 - 1 1 - - 1<br />
Micronesia Federated States - - - - - 1 - - - 2 1<br />
Nauru 3 2 8 2 6 2 6 2 6 6 7<br />
Palau - - 1 1 - - - - - - -<br />
Micronesia nfd - - - - - 1 - 1 - - -<br />
Total 12 8 16 9 12 7 9 12 7 11 14<br />
Polynesia (excluding Hawaii)<br />
Cook Islands 20 30 34 23 18 30 39 38 46 63 59<br />
Fiji 125 119 164 153 165 254 213 239 249 247 271<br />
French Polynesia 1 2 5 2 3 3 7 3 5 6 10<br />
Niue 4 3 3 9 5 3 7 8 6 20 4<br />
Samoa 151 196 187 148 207 222 255 291 291 241 312<br />
Samoa American 2 1 - - 1 2 3 4 3 2 5<br />
Tokelau 3 6 3 - 3 1 4 3 7 7 15<br />
Tonga 73 91 109 103 103 143 168 157 177 168 203<br />
Tuvalu 2 1 - - 1 1 - 2 1 1 1<br />
Wallis and Futuna - - 1 1 - - - - - 1 1<br />
Polynesia (excl Hawaii) nec - - - - - 1 - 1 1 2 1<br />
Total 381 449 506 439 506 660 696 746 786 758 882<br />
Total 21 570 25 412 28 988 30 544 32 577 37 066 38 845 42 379 45 480 47 979 50 412<br />
Europe<br />
United Kingdom & Ireland<br />
United Kingdom 3 487 3 959 3 835 3 783 3 928 4 622 4 665 5 353 5 626 6 047 6 160<br />
Ireland 280 337 320 323 287 357 365 384 422 479 450<br />
Total 3 767 4 296 4 155 4 106 4 215 4 979 5 030 5 737 6 048 6 526 6 610
9<br />
Table 3(continued)<br />
Permanent departures by region/country <strong>of</strong> birth,<br />
1998-99 to 2008-09<br />
Financial Year<br />
Birthplace 1998-99 1999-00 2000-01 2001-02 2002-03 2003-04 2004-05 2005-06 2006-07 2007-08 2008-09<br />
Western Europe<br />
Austria 35 39 61 44 58 63 67 75 61 63 68<br />
Belgium 20 24 36 15 35 35 34 38 41 45 40<br />
France 98 137 146 138 177 166 183 218 201 265 251<br />
Germany 187 259 304 270 288 286 333 328 413 424 479<br />
Liechtenstein - - - - - - 4 2 - - -<br />
Luxembourg - - 2 3 3 1 5 5 - 2 -<br />
Monaco - - 2 1 2 1 2 2 1 2 5<br />
Netherlands 149 163 172 183 183 231 189 248 233 252 266<br />
Switzerland 105 147 131 159 171 149 138 140 215 213 210<br />
Total 594 769 854 813 917 932 955 1 056 1 165 1 266 1 319<br />
Northern Europe<br />
Denmark 63 41 41 35 52 46 52 71 77 55 82<br />
Faroe Islands - - - - 2 - - - - - 1<br />
Finland 28 23 26 37 37 36 36 37 31 38 50<br />
Iceland 4 9 8 7 9 2 7 7 6 2 3<br />
Norway 27 14 21 20 37 29 35 34 45 45 34<br />
Sweden 39 50 54 65 69 76 63 95 100 120 148<br />
Total 161 137 150 164 206 189 193 244 259 260 318<br />
Southern Europe<br />
Andorra - 3 - - - - - - 1 - -<br />
Gibraltar 1 2 1 1 2 2 4 2 1 5 -<br />
Italy 218 243 231 203 204 207 226 239 230 241 239<br />
Malta 93 76 89 79 71 72 72 62 43 71 84<br />
Portugal 96 133 94 106 87 78 67 58 59 57 60<br />
San Marino - - - 2 - - 1 1 - 1 -<br />
Spain 94 109 93 87 84 98 90 92 106 101 83<br />
Total 502 566 508 478 448 457 460 454 440 476 466<br />
South Eastern Europe<br />
Albania 2 6 4 9 3 5 5 9 17 7 14<br />
Bosnia and Herzegovina (a) 21 36 33 21 42 56 70 64 76 80 66<br />
Bulgaria 7 8 11 7 5 19 13 14 20 19 15<br />
Croatia (a) 100 80 72 86 95 102 110 102 118 129 133<br />
Cyprus 74 93 65 95 68 95 73 74 87 92 95<br />
Fmr Yugo Rep <strong>of</strong> Macedonia (a) 26 53 49 46 68 65 67 61 77 54 77<br />
Greece 242 247 287 206 241 239 231 243 230 254 299<br />
Moldova - - - - - 4 - - 2 1 1<br />
Montenegro - - - - - - - - - 1 -<br />
Romania 25 22 18 24 39 39 33 42 48 38 42<br />
Serbia (a) - - - - - - - - - - 4<br />
Fmr Serbia & Montenegro (a) 159 186 216 194 192 237 215 226 208 253 222<br />
Slovenia (a) 5 3 7 9 14 10 12 8 6 12 10<br />
Total 661 734 762 697 767 871 829 843 889 940 978<br />
(a) Care should be taken when interpreting the data. The former Serbia and Montenegro was previously called the Federal Republic <strong>of</strong> Yugoslavia<br />
and since 1998-99 contains the Former Yugoslavia nfd.
10<br />
Table 3(continued)<br />
Permanent departures by region/country <strong>of</strong> birth,<br />
1998-99 to 2008-09<br />
Financial Year<br />
Birthplace 1998-99 1999-00 2000-01 2001-02 2002-03 2003-04 2004-05 2005-06 2006-07 2007-08 2008-09<br />
Eastern Europe<br />
Belarus (b) - - - - 1 1 2 2 1 3 2<br />
Czech Rep (c) 3 6 8 6 7 14 17 18 25 18 31<br />
Estonia (b) 2 2 2 4 3 7 4 2 1 7 3<br />
Former Czechoslovakia (c) 25 26 32 38 27 27 42 34 46 43 52<br />
Hungary 57 59 60 41 77 62 66 55 36 54 72<br />
Latvia (b) 3 2 3 8 3 2 5 2 11 1 6<br />
Lithuania (b) 2 5 - 4 1 6 4 2 5 7 4<br />
Poland 111 108 116 110 94 111 133 135 169 172 191<br />
Russian Federation (b) 14 24 20 15 24 26 30 36 42 42 61<br />
Slovakia (c) 2 3 4 5 4 9 7 11 9 9 15<br />
Ukraine 10 7 13 11 12 20 22 19 31 27 19<br />
Total 229 242 258 242 253 285 332 316 376 383 456<br />
Total 5 914 6 744 6 687 6 500 6 806 7 713 7 799 8 650 9 177 9 851 10 147<br />
North Africa & the Middle East<br />
North Africa<br />
Algeria 4 6 10 4 8 13 8 12 13 7 8<br />
Egypt 58 78 80 78 69 87 85 107 97 138 137<br />
Libya 7 5 2 3 4 9 7 9 13 14 7<br />
Morocco 3 7 11 5 6 7 4 6 16 11 8<br />
Sudan 5 9 14 10 9 21 25 29 28 60 51<br />
Tunisia 1 3 - 4 3 4 3 5 3 1 4<br />
Western Sahara - - - - - - - 1 1 2 -<br />
Total 78 108 117 104 99 141 132 169 171 233 215<br />
Middle East<br />
Bahrain 5 7 4 3 7 5 6 14 15 18 24<br />
Gaza Strip & West Bank - 2 - - - - - - - 1 5<br />
Iran 44 43 78 87 75 110 137 151 163 199 255<br />
Iraq 39 56 87 77 111 185 212 287 219 270 359<br />
Israel 57 63 75 97 80 123 103 142 161 171 184<br />
Jordan 13 22 19 16 24 19 41 33 38 51 44<br />
Kuwait 13 12 35 20 23 33 41 50 42 42 60<br />
Lebanon 249 231 257 199 241 306 329 322 419 367 452<br />
Oman 7 1 - 6 5 7 3 7 7 8 7<br />
Qatar 1 2 2 - 1 3 3 9 8 7 13<br />
Saudi Arabia 10 10 13 8 10 23 18 21 21 27 40<br />
Syria 24 20 20 35 34 44 22 59 57 52 54<br />
Turkey 71 83 97 79 83 121 106 121 137 157 183<br />
United Arab Emirates 7 18 25 16 34 28 52 38 72 87 105<br />
Yemen - 3 1 5 3 - 2 - - 1 7<br />
Middle East nfd - - 1 - 1 1 - 4 1 3 3<br />
Total 540 573 714 648 732 1 008 1 075 1 258 1 360 1 461 1 795<br />
Total<br />
618 681 831 752 831 1 149 1 207 1 427 1 531 1 694 2 010<br />
(b) As reliable data are not available for the component countries <strong>of</strong> the former USSR and Baltic States prior to 1995-96, care should be taken when<br />
interpreting the data.<br />
(c) As reliable data are not available for the component countries <strong>of</strong> the former Czechoslovakia prior to 1995-96, care should be taken when<br />
interpreting the data.
11<br />
Table 3(continued)<br />
Permanent departures by region/country <strong>of</strong> birth,<br />
1998-99 to 2008-09<br />
Financial Year<br />
Birthplace 1998-99 1999-00 2000-01 2001-02 2002-03 2003-04 2004-05 2005-06 2006-07 2007-08 2008-09<br />
Southeast Asia<br />
Brunei 16 12 12 18 17 22 22 16 26 28 32<br />
Burma 10 18 23 24 18 27 36 35 31 41 53<br />
Cambodia 62 65 56 80 83 128 135 146 126 150 147<br />
East Timor (d) - 9 36 20 10 29 27 13 29 31 38<br />
Indonesia (d) 336 447 568 690 634 787 793 682 668 627 644<br />
Laos 23 30 50 33 30 35 50 51 66 56 56<br />
Malaysia 291 315 463 438 459 578 642 586 618 684 824<br />
Philippines 183 220 241 236 230 310 326 379 356 403 483<br />
Singapore 143 180 223 252 260 344 357 413 479 600 587<br />
Thailand 109 130 135 183 209 255 315 343 410 435 560<br />
Vietnam 455 458 652 667 643 1 000 1 145 1 174 1 225 1 338 1 220<br />
Total 1628 1884 2459 2641 2593 3515 3848 3838 4034 4393 4644<br />
Northeast Asia<br />
China (excl SARs & Taiwan) 1427 1802 2430 2424 2129 3126 3736 3843 3962 4480 4999<br />
Hong Kong (SAR <strong>of</strong> China) 1375 1585 1725 1743 1735 2025 2077 2291 2138 2211 2196<br />
Japan 118 131 212 256 190 263 349 403 453 421 459<br />
Korea 211 199 255 353 341 446 577 519 657 655 667<br />
Macau (SAR <strong>of</strong> China) 26 35 32 23 31 23 27 31 29 37 37<br />
Mongolia - - - - - - - - - - 2<br />
Taiwan 516 663 704 749 763 952 958 1 000 951 1 006 942<br />
Total 3673 4415 5358 5548 5189 6835 7724 8087 8190 8810 9302<br />
Southern Asia<br />
Bangladesh 19 11 18 11 15 28 26 25 24 38 46<br />
India 193 229 265 247 268 339 426 446 527 670 730<br />
Maldives - - - - - 1 - 2 2 - 1<br />
Nepal 2 1 1 3 3 1 6 5 4 6 10<br />
Pakistan 24 19 38 36 38 50 64 76 69 93 98<br />
Sri Lanka 75 99 86 112 95 135 152 138 156 187 208<br />
Total 313 359 408 409 419 554 674 692 782 994 1 093<br />
Central Asia<br />
Afghanistan 8 9 17 15 22 20 38 37 39 79 94<br />
Armenia (c) 1 - 2 - - - 4 - - 1 2<br />
Azerbaijan (c) - - - - - 1 - - - 1 2<br />
Georgia (c) - - - 1 - - 2 - 1 1 -<br />
Kazakhstan (c) - - 3 1 4 1 1 6 5 4 4<br />
Kyrgyzstan (c) - - - - - 1 1 - 1 1 -<br />
Turkmenistan (c) - - - - - - - 2 - 1 -<br />
Uzbekistan (c) - - - - 1 2 - 3 2 3 2<br />
Total 9 9 22 17 27 25 46 48 48 91 104<br />
Northern America<br />
Bermuda 5 - 4 2 5 1 6 4 3 7 9<br />
Canada 278 307 310 331 357 374 414 457 454 516 496<br />
U.S.A. 590 604 760 718 791 772 901 979 1 078 1 122 1 160<br />
Total 873 911 1 074 1 051 1 153 1 147 1 321 1 440 1 535 1 645 1 665<br />
(c) As reliable data are not available for the component countries <strong>of</strong> the former USSR and Baltic States prior to 1995-96, care should be taken when<br />
interpreting the data.<br />
(d) East Timor previously recorded under Indonesia, care should be undertaken when interpreting the data.
12<br />
Table 3(continued)<br />
Permanent departures by region/country <strong>of</strong> birth,<br />
1998-99 to 2008-09<br />
Financial Year<br />
Birthplace 1998-99 1999-00 2000-01 2001-02 2002-03 2003-04 2004-05 2005-06 2006-07 2007-08 2008-09<br />
South America, Central America & the Caribbean<br />
South America<br />
Argentina 32 46 31 28 30 58 61 56 65 82 71<br />
Bolivia 1 5 4 1 2 7 2 1 5 7 5<br />
Brazil 25 26 23 38 37 26 40 43 43 61 77<br />
Chile 74 79 61 77 69 119 120 135 126 136 141<br />
Colombia 12 19 5 12 26 18 32 33 24 42 47<br />
Ecuador 2 2 5 4 6 8 2 6 8 10 12<br />
Falkland Islands - - - - - - 1 1 1 - -<br />
Guyana 4 4 - 2 1 1 1 2 2 - -<br />
Paraguay 1 2 - - - - - 2 2 2 2<br />
Peru 12 12 22 22 23 26 25 26 29 36 35<br />
Suriname - - - 1 - 1 - - 1 2 -<br />
Uruguay 27 24 24 17 23 31 28 42 33 37 41<br />
Venezuela 2 4 2 5 11 9 12 10 12 6 4<br />
Total 192 223 177 207 228 304 324 357 351 421 435<br />
Central America<br />
Belize - - 1 2 1 - 2 - - - -<br />
Costa Rica - - 1 2 3 3 4 8 1 2 1<br />
El Salvador 12 12 8 6 14 10 24 10 21 16 22<br />
Guatemala 4 1 1 1 1 - - - 5 2 1<br />
Honduras - - - - - 1 2 1 1 2 1<br />
Mexico 1 7 8 15 9 11 9 11 11 13 16<br />
Nicaragua 3 1 - 4 - 3 3 3 2 2 3<br />
Panama 2 - - - 1 1 3 1 1 6 1<br />
Total 22 21 19 30 29 29 47 34 42 43 45<br />
The Caribbean<br />
Antigua and Barbuda - 2 - - 1 - - - 1 - -<br />
Aruba 1 - - - - 1 1 1 2 1 -<br />
Bahamas 1 1 5 2 1 2 1 3 5 3 4<br />
Barbados 2 2 3 2 1 1 3 4 2 2 4<br />
Cayman Islands 2 - - 2 - 2 - - 3 1 3<br />
Cuba 1 2 1 3 3 2 1 - 3 4 3<br />
Dominican Republic 1 - - - - - - - - 1 3<br />
Grenada - 1 1 2 - 1 - - 1 2 -<br />
Guadeloupe - - - - - - - 1 1 2 1<br />
Haiti - - 2 1 2 - 1 - - - 1<br />
Jamaica 6 1 2 4 3 8 7 3 4 6 2<br />
Martinique 2 1 - - - 2 - - - - -<br />
Monserrat - - - - - - - - - 1 -<br />
Netherlands Antilles 1 1 - 1 1 2 - - 4 - -<br />
Puerto Rico - - 1 3 2 2 2 5 1 - 2
13<br />
Table 3(continued)<br />
Permanent departures by region/country <strong>of</strong> birth,<br />
1998-99 to 2008-09<br />
Financial Year<br />
Birthplace 1998-99 1999-00 2000-01 2001-02 2002-03 2003-04 2004-05 2005-06 2006-07 2007-08 2008-09<br />
The Caribbean (continued)<br />
St Vincent & The Grenadines - 1 - 1 - - - - - - -<br />
Trinidad and Tobago 8 5 8 5 9 10 8 6 6 7 15<br />
Turks and Caicos Islands - - - - - - - 1 - - -<br />
Virgin Islands British 2 - 1 - - 1 1 - - 1 -<br />
Virgin Islands USA - - - - - - - - - - 1<br />
Caribbean nfd - - - - 1 - - - - - -<br />
Total 27 17 24 26 24 34 25 24 33 31 39<br />
Total 241 261 220 263 281 367 396 415 426 495 519<br />
Sub-Saharan Africa<br />
Central and West Africa<br />
Benin - - 1 - - - 1 - 1 - -<br />
Cameroon - - - 1 - 1 - 2 1 3 1<br />
Cape Verde - 1 - - - - 1 - - - -<br />
Central African Republic - - - - - - 1 - - - -<br />
Chad 1 - - - - - - 2 - 1 1<br />
Congo 1 1 - 2 - - - - - - 2<br />
Congo Dem Republic 2 3 4 1 8 3 2 3 4 1 3<br />
Cote D'Ivoire - - - 2 1 1 4 - - - -<br />
Equitorial Guinea - - - - - - - - - 1 1<br />
Gabon - - - - - - - - 2 - -<br />
Gambia - - - - - - 2 - - - -<br />
Ghana 4 6 9 7 8 13 8 11 12 4 11<br />
Guinea - - - 1 - - - - 1 - -<br />
Guinea-Bissau - - 2 2 - 1 - 1 - - -<br />
Liberia - - - - 1 - - 1 2 - 4<br />
Mali - - - - - - - - - 1 1<br />
Mauritania - 3 1 1 1 - 1 - - - -<br />
Niger - - - - - 1 - - - - -<br />
Nigeria 8 7 9 4 4 17 15 14 9 12 14<br />
Sao Tome & Principe - - - - - 1 - - - - -<br />
Senegal 1 2 - 2 3 1 1 - 1 - 2<br />
Sierra Leone - - 3 1 1 3 2 3 4 3 2<br />
Togo - - - - - - - - - - 1<br />
Total 17 23 29 24 27 42 38 37 37 26 43<br />
Southern and East Africa<br />
Angola - 2 4 5 3 3 3 3 4 2 9<br />
Botswana - 2 1 3 2 1 3 3 3 1 2<br />
Burundi - - - 1 - - - - - - 2<br />
Comoros - - - 1 - - - - - - -<br />
Djibouti 1 - - 1 - - - 1 - - -<br />
Eritrea 2 3 6 1 6 7 8 5 9 11 10<br />
Ethiopia 7 10 7 11 4 17 13 16 17 25 32<br />
Kenya 33 21 27 39 40 47 33 47 39 52 79<br />
Lesotho - 3 - - - 2 - - - - 1<br />
Madagascar 1 - - - - 3 - 1 1 2 -<br />
Malawi 2 4 3 - 2 4 7 4 3 6 2
14<br />
Table 3(continued)<br />
Permanent departures by region/country <strong>of</strong> birth,<br />
1998-99 to 2008-09<br />
Financial Year<br />
Birthplace 1998-99 1999-00 2000-01 2001-02 2002-03 2003-04 2004-05 2005-06 2006-07 2007-08 2008-09<br />
Southern and East Africa (continued)<br />
Mauritius 24 15 22 15 19 32 44 35 37 38 41<br />
Mozambique 2 - 4 5 8 5 4 4 5 4 4<br />
Namibia - 1 2 3 3 8 1 2 12 6 3<br />
Reunion - - - 2 - - 3 2 - - -<br />
Rwanda - - - 1 - - - - - - -<br />
St Helena - - - - - 1 - - - - -<br />
Seychelles 11 8 6 6 5 4 11 2 7 5 15<br />
Somalia 10 6 10 16 16 22 25 10 19 15 25<br />
South Africa 153 205 242 280 336 383 405 533 535 589 635<br />
Swaziland 3 1 - 1 1 2 2 4 3 1 1<br />
Tanzania 3 6 10 5 15 6 9 13 11 4 12<br />
Uganda 3 10 5 6 6 6 8 10 5 8 10<br />
Zambia 20 9 17 15 18 26 23 23 35 26 36<br />
Zimbabwe 29 43 50 41 47 57 64 76 83 118 121<br />
Total 304 349 416 458 531 636 666 794 828 913 1 040<br />
Total 321 372 445 482 558 678 704 831 865 939 1 083<br />
Supplementar y codes (e)<br />
Europe & USSR nfd - 1 - - - - - - - - -<br />
Fmr USSR 16 25 28 27 24 26 42 44 35 28 33<br />
Total<br />
16 26 28 27 24 26 42 44 35 28 33<br />
Not stated 5 4 1 7 5 3 - 2 - 4 6<br />
Total all countries 35 181 41 078 46 521 48 241 50 463 59 078 62 606 67 853 72 103 76 923 81 018<br />
(e) Supplementary codes which cannot be classified to any major region in the Standard Australian Classification <strong>of</strong> Countries (SACC). This may<br />
lead to under reporting <strong>of</strong> their component countries in the rest <strong>of</strong> the table, care should be taken when interpreting the data.
15<br />
Table 4 Permanent departures by age, 1995-96 to 2008-09<br />
Age group (years)<br />
0-4 5-14 15-24 25-34 35-44 45-54 55-64 65+ Total<br />
1995-96 2 811 3 272 3 394 8 190 5 568 2 844 1 222 1 369 28 670<br />
1996-97 2 884 3 377 3 326 8 410 5 887 3 112 1 363 1 498 29 857<br />
1997-98 3 056 3 606 3 410 9 020 6 471 3 399 1 485 1 538 31 985<br />
1998-99 2 886 3 489 3 391 9 984 7 674 4 561 1 800 1 396 35 181<br />
1999-00 3 287 4 119 3 750 11 369 9 326 5 496 2 110 1 621 41 078<br />
2000-01 3 523 4 450 4 337 13 258 10 686 6 255 2 451 1 561 46 521<br />
2001-02 3 557 4 631 4 353 13 913 11 079 6 528 2 572 1 608 48 241<br />
2002-03 3 683 4 994 4 510 14 243 11 552 6 945 2 844 1 692 50 463<br />
2003-04 4 296 5 621 5 114 16 169 13 392 8 716 3 654 2 116 59 078<br />
2004-05 4 575 5 798 5 428 17 560 14 059 9 028 4 001 2 157 62 606<br />
2005-06 4 777 6 392 6 039 18 509 15 427 9 915 4 511 2 283 67 853<br />
2006-07 5 296 6 450 6 238 19 937 16 444 10 323 4 864 2 551 72 103<br />
2007-08 5 704 6 764 6 733 20 972 17 509 11 102 5 389 2 750 76 923<br />
2008-09 6 078 7 068 6 849 21 632 18 480 12 101 5 957 2 853 81 018<br />
Table 5 Permanent departures by sex, 1995-96 to 2008-09<br />
Sex<br />
Male Female Total<br />
1995-96 13 927 14 743 28 670<br />
1996-97 14 859 14 998 29 857<br />
1997-98 16 053 15 932 31 985<br />
1998-99 17 499 17 682 35 181<br />
1999-00 20 710 20 368 41 078<br />
2000-01 23 588 22 933 46 521<br />
2001-02 24 442 23 799 48 241<br />
2002-03 25 409 25 054 50 463<br />
2003-04 29 838 29 240 59 078<br />
2004-05 31 433 31 173 62 606<br />
2005-06 34 359 33 494 67 853<br />
2006-07 36 970 35 133 72 103<br />
2007-08 39 467 37 456 76 923<br />
2008-09 41 332 39 686 81 018
16<br />
Table 6<br />
Permanent departures by region/country <strong>of</strong> future residence,<br />
1998-99 to 2008-09<br />
Financial Year<br />
Region/country<br />
<strong>of</strong> future residence<br />
1998-99 1999-00 2000-01 2001-02 2002-03 2003-04 2004-05 2005-06 2006-07 2007-08 2008-09<br />
Oceania<br />
Australian external Territories 115 191 204 175 217 242 220 181 216 198 194<br />
New Zealand 7 468 8 961 9 657 10 024 11 333 13 685 13 772 13 915 13 917 14 160 14 352<br />
Melanesia<br />
New Caledonia 25 30 54 54 68 53 57 63 83 76 95<br />
Papua New Guinea 422 445 501 463 462 343 362 335 375 413 561<br />
Solomon Islands 43 72 58 32 38 56 68 76 87 129 103<br />
Vanuatu 131 173 169 156 141 158 189 219 216 248 289<br />
Total 621 720 782 705 709 610 676 693 761 866 1 048<br />
Micronesia<br />
Guam 11 8 5 12 13 25 16 39 26 21 15<br />
Kiribati 11 2 6 37 18 5 3 3 1 8 6<br />
Marshall Islands 2 - 1 - 1 - 3 2 1 2 9<br />
Micronesia Federated States - 1 1 5 - 3 4 7 5 5 11<br />
Nauru 31 16 21 6 8 - 4 - 6 5 4<br />
Palau 2 2 - - 2 3 3 - 5 1 -<br />
Micronesia Nfd 2 - - - - - - - 1 - 3<br />
Total 59 29 34 60 42 36 33 51 45 42 48<br />
Polynesia (excluding Hawaii)<br />
Cook Islands 26 38 31 18 36 36 49 45 58 57 54<br />
Fiji 179 211 190 194 205 290 333 404 396 399 420<br />
French Polynesia 6 8 10 11 11 14 13 11 15 13 14<br />
Niue 1 11 3 1 - 1 1 1 - 1 1<br />
Samoa 88 54 88 101 113 118 154 174 204 161 156<br />
Samoa American 1 - - - - 4 - - - - 1<br />
Tokelau - 2 3 - - - - 1 - 6 2<br />
Tonga 54 92 63 70 57 99 114 117 137 128 124<br />
Tuvalu - - 1 - 5 4 1 2 1 1 1<br />
Wallis and Futuna - - - - - - 1 - - - -<br />
Polynesia (excl Hawaii) nec - - - 2 - - - - 1 1 1<br />
Total 355 416 389 397 427 566 666 755 812 767 774<br />
Total 8 618 10 317 11 066 11 361 12 728 15 139 15 367 15 595 15 751 16 033 16 416<br />
Europe<br />
United Kingdom & Ireland<br />
United Kingdom 6 789 7 466 7 854 8 273 8 408 9 758 10 578 12 040 13 108 13 701 13 747<br />
Ireland 457 566 652 617 587 655 710 834 971 961 902<br />
Total 7 246 8 032 8 506 8 890 8 995 10 413 11 288 12 874 14 079 14 662 14 649
17<br />
Table 6(continued)<br />
Permanent departures by region/country <strong>of</strong> future residence,<br />
1998-99 to 2008-09<br />
Financial Year<br />
Region/country<br />
<strong>of</strong> future residence<br />
1998-99 1999-00 2000-01 2001-02 2002-03 2003-04 2004-05 2005-06 2006-07 2007-08 2008-09<br />
Western Europe<br />
Austria 80 122 141 460 137 177 214 225 208 231 232<br />
Belgium 44 74 74 80 96 110 101 102 96 101 87<br />
France 296 341 382 393 441 439 529 592 612 691 710<br />
Germany 347 428 487 538 522 535 553 529 636 707 809<br />
Liechtenstein - - 1 - - - 6 3 - - -<br />
Luxembourg 7 8 9 10 8 5 11 14 14 26 15<br />
Monaco - 2 3 10 5 16 4 11 2 12 17<br />
Netherlands 314 274 384 436 376 376 355 418 426 440 492<br />
Switzerland 282 368 412 451 457 507 420 481 599 716 752<br />
Total 1 370 1 617 1 893 2 378 2 042 2 165 2 193 2 375 2 593 2 924 3 114<br />
Northern Europe<br />
Denmark 105 87 108 91 107 122 106 150 149 124 177<br />
Faroe Islands 5 1 - - 3 - - 1 - 1 3<br />
Finland 38 23 44 40 63 51 46 75 59 70 71<br />
Iceland 5 3 6 4 1 8 4 13 2 7 1<br />
Norway 72 41 51 57 81 74 101 124 137 161 196<br />
Sweden 133 161 172 210 210 208 213 221 267 320 395<br />
Total 358 316 381 402 465 463 470 584 614 683 843<br />
Southern Europe<br />
Andorra 1 1 3 2 2 - - 3 1 2 1<br />
Gibraltar 1 1 4 - 2 1 9 23 6 1 2<br />
Italy 353 362 372 353 401 355 347 395 395 401 379<br />
Malta 108 105 94 86 80 86 66 80 62 74 106<br />
Portugal 110 151 121 115 92 85 73 55 59 51 66<br />
Spain 183 218 206 195 188 232 234 249 320 274 260<br />
Total 756 838 800 751 765 759 729 805 843 803 814<br />
South Eastern Europe<br />
Albania - 4 4 2 4 11 3 8 10 7 13<br />
Bosnia and Herzegovina 19 26 30 34 41 35 32 49 43 37 41<br />
Bulgaria 2 4 4 11 2 18 13 7 13 20 11<br />
Croatia 165 130 139 130 158 160 160 155 167 201 125<br />
Cyprus 90 112 69 105 96 128 85 118 123 133 119<br />
Fmr Yugo Rep <strong>of</strong> Macedonia 53 103 89 62 98 89 73 65 83 52 84<br />
Greece 397 352 411 302 348 356 332 344 354 353 369<br />
Moldava 1 - 1 - - 4 1 1 - 1 -<br />
Montenegro - - - - - - - - 5 3 3<br />
Romania 29 12 7 13 25 16 12 30 28 26 24<br />
Serbia - - - - - - - - 2 7 28<br />
Fmr Serbia & Montenegro (a) 48 49 93 90 97 154 145 133 110 123 103<br />
Slovenia 22 6 17 22 27 19 13 18 18 36 33<br />
Total 826 798 864 771 896 990 869 928 956 999 953<br />
(a) Care should be taken when interpreting the data. The former Serbia and Montenegro was previously called the Federal Republic <strong>of</strong> Yugoslavia<br />
and since 1998-99 contains the Former Yugoslavia nfd.
18<br />
Table 6(continued)<br />
Permanent departures by region/country <strong>of</strong> future residence,<br />
1998-99 to 2008-09<br />
Financial Year<br />
Region/country<br />
<strong>of</strong> future residence<br />
1998-99 1999-00 2000-01 2001-02 2002-03 2003-04 2004-05 2005-06 2006-07 2007-08 2008-09<br />
Eastern Europe<br />
Belarus (b) 1 - - 1 6 - 2 1 - 1 -<br />
Czech Republic (c) 21 10 4 11 12 12 11 24 21 19 51<br />
Estonia (b) 2 - 3 6 2 5 3 3 5 10 11<br />
Former Czechoslovakia (c) 6 7 21 16 9 16 22 12 15 19 19<br />
Hungary 44 46 59 44 53 51 53 55 42 66 70<br />
Latvia (b) 5 7 3 9 5 3 9 3 18 6 1<br />
Lithuania (b) 4 3 - 5 1 3 2 - 4 4 3<br />
Poland 79 64 63 86 61 64 67 88 102 125 111<br />
Russian Federation (b) 17 8 36 25 27 48 56 75 104 95 108<br />
Slovakia (c) 3 2 3 4 7 14 8 13 6 12 19<br />
Ukraine 4 2 7 17 4 12 7 11 22 12 15<br />
Total 186 149 199 224 187 228 240 285 339 369 408<br />
Total 10 742 11 750 12 643 13 416 13 350 15 018 15 789 17 851 19 424 20 440 20 781<br />
North Africa & the Middle East<br />
North Africa<br />
Algeria 1 1 1 1 - - 1 14 6 5 4<br />
Egypt 62 99 83 72 60 72 67 86 104 112 130<br />
Libya 3 - 2 - - 13 23 40 21 23 16<br />
Morocco - 7 6 3 4 4 1 8 5 7 6<br />
Sudan 2 6 1 6 4 12 17 22 16 36 29<br />
Tunisia - 5 - - 3 1 5 3 2 4 2<br />
Western Sahara - - - - - - - - 1 - -<br />
Total 68 118 93 82 71 102 114 173 155 187 187<br />
Middle East<br />
Bahrain 75 115 100 92 126 184 238 247 184 145 219<br />
Gaza Strip & West Bank - - - 1 - - - - 3 - -<br />
Iran 15 7 30 30 41 55 61 99 83 99 131<br />
Iraq 7 16 4 6 11 111 66 46 51 55 87<br />
Israel 150 196 175 181 194 256 237 284 336 366 335<br />
Jordan 14 40 40 28 43 46 69 46 36 45 62<br />
Kuwait 39 21 52 31 47 50 49 64 78 81 117<br />
Lebanon 257 257 262 215 236 339 348 386 386 345 434<br />
Oman 49 51 31 55 45 63 45 80 80 106 100<br />
Qatar 30 29 41 79 133 92 148 247 242 313 353<br />
Saudi Arabia 137 131 195 195 179 153 146 145 144 203 229<br />
Syria 22 11 41 34 60 61 73 82 77 98 71<br />
Turkey 87 107 116 77 104 144 156 205 176 214 232<br />
United Arab Emirates 321 411 454 592 859 1 080 1 276 1 754 2 433 3 419 4 312<br />
Yemen 3 1 - - 4 1 1 - 3 2 7<br />
Middle East nfd - - 1 1 1 2 - 1 1 1 1<br />
Total 1 206 1 393 1 542 1 617 2 083 2 637 2 913 3 686 4 313 5 492 6 690<br />
Total 1 274 1 511 1 635 1 699 2 154 2 739 3 027 3 859 4 468 5 679 6 877<br />
(b) As reliable data are not available for the component countries <strong>of</strong> the former USSR and Baltic States prior to 1995-96, care should be taken when<br />
interpreting the data.<br />
(c) As reliable data are not available for the component countries <strong>of</strong> the former Czechoslovakia prior to 1995-96, care should be taken when<br />
interpreting the data.
19<br />
Table 6(continued)<br />
Permanent departures by region/country <strong>of</strong> future residence,<br />
1998-99 to 2008-09<br />
Financial Year<br />
Region/country<br />
<strong>of</strong> future residence<br />
1998-99 1999-00 2000-01 2001-02 2002-03 2003-04 2004-05 2005-06 2006-07 2007-08 2008-09<br />
Southeast Asia<br />
Brunei 146 119 138 148 110 153 183 137 161 209 147<br />
Burma 2 13 18 8 15 6 10 12 10 8 11<br />
Cambodia 28 42 46 47 58 88 88 106 91 149 151<br />
East Timor (d) - 8 54 50 44 40 44 40 46 52 80<br />
Indonesia (d) 608 842 950 1 058 1 093 1 292 1 287 1 201 1 249 1 216 1 372<br />
Laos 17 19 26 10 20 17 33 62 79 78 76<br />
Malaysia 413 483 542 534 587 792 825 799 766 934 1 107<br />
Philippines 209 244 257 276 271 311 324 338 281 393 430<br />
Singapore 1 253 1 561 2 325 2 809 2 531 2 876 3 222 3 600 4 135 4 901 5 431<br />
Thailand 389 480 540 592 684 835 1 037 1 017 1 251 1 364 1 474<br />
Vietnam 361 373 440 497 502 900 1 036 1 042 1 145 1 331 1 171<br />
Southeast Asia nfd - - - - - - - - - 1 -<br />
Total 3 426 4 184 5 336 6 029 5 915 7 310 8 089 8 354 9 214 10 636 11 450<br />
Northeast Asia<br />
China (excl SARs) 1 080 1 521 1 877 2 033 2 050 2 989 3 497 3 952 4 104 4 415 4 707<br />
Hong Kong (SAR <strong>of</strong> China) 2 845 3 346 3 942 3 828 4 234 4 420 4 850 5 379 5 435 5 543 5 898<br />
Japan 472 522 844 929 928 1 071 1 145 1 199 1 338 1 307 1 217<br />
Korea 213 241 303 375 382 542 630 543 681 686 685<br />
Macau (SAR <strong>of</strong> China) 15 30 38 50 57 68 56 86 209 397 398<br />
Mongolia 1 1 1 - 9 17 - 14 21 17 9<br />
Taiwan 553 724 729 765 815 1 004 970 957 925 983 902<br />
Northeast Asia nfd - - - 1 - - - - - - -<br />
Total 5 179 6 385 7 734 7 981 8 475 10 111 11 148 12 130 12 713 13 348 13 816<br />
Southern Asia<br />
Bangladesh 11 10 12 11 6 6 9 30 25 28 38<br />
Bhutan - - - - - - 1 1 4 - 4<br />
India 81 91 115 124 113 165 197 265 356 438 496<br />
Maldives 9 10 5 14 22 13 15 18 20 13 17<br />
Nepal 4 6 - 4 2 3 4 2 6 4 21<br />
Pakistan 21 12 23 26 17 38 33 50 54 45 53<br />
Sri Lanka 35 55 36 40 33 54 53 44 53 56 71<br />
Total 161 184 191 219 193 279 312 410 518 584 700<br />
Central Asia<br />
Afghanistan 1 - - - 11 8 20 16 21 17 34<br />
Armenia (b) - 2 - - 2 1 3 - 2 5 3<br />
Azerbaijan (b) 1 - 3 3 3 7 12 11 13 4 9<br />
Georgia (b) - 1 - 5 - 2 1 1 1 2 -<br />
Kazakhstan (b) 12 1 6 11 9 9 20 17 15 15 15<br />
Kyrgyzstan (b) - - - - 1 - 1 - - 3 6<br />
Tajikistan (b) - - - 2 - - - - - - -<br />
Turkmenistan - - - - - - - - - 1 1<br />
Uzbekistan (b) - - - - 1 1 1 - - - 1<br />
Total 14 4 9 21 27 28 58 45 52 47 69<br />
Northern America<br />
Bermuda 13 7 18 7 9 15 24 9 22 24 31<br />
Canada 845 953 1 047 1 206 1 106 1 362 1 496 1 511 1 592 1 758 1 957<br />
USA 4 245 5 078 5 964 5 526 5 831 6 136 6 340 6 987 7 178 7 160 7 500<br />
Total 5 103 6 038 7 029 6 739 6 946 7 513 7 860 8 507 8 792 8 942 9 488<br />
(b) As reliable data are not available for the component countries <strong>of</strong> the former USSR and Baltic States prior to 1995-96, care should be taken when<br />
interpreting the data.<br />
(d) East Timor previously recorded under Indonesia, care should be taken when interpreting data.
20<br />
Table 6(continued)<br />
Permanent departures by region/country <strong>of</strong> future residence,<br />
1998-99 to 2008-09<br />
Financial Year<br />
Region/country<br />
<strong>of</strong> future residence<br />
1998-99 1999-00 2000-01 2001-02 2002-03 2003-04 2004-05 2005-06 2006-07 2007-08 2008-09<br />
South America, Central America & the Caribbean<br />
South America<br />
Argentina 58 66 35 33 31 64 65 75 63 86 67<br />
Bolivia 3 5 2 2 2 7 5 7 5 3 4<br />
Brazil 39 42 27 48 50 40 49 67 87 72 117<br />
Chile 108 109 77 91 85 133 130 152 153 177 199<br />
Colombia 10 11 2 16 8 8 22 20 15 21 33<br />
Ecuador 7 2 3 6 5 8 - 6 8 11 7<br />
Falkland Islands - 1 - 1 1 - - - 5 1 1<br />
Guyana 1 - - - - - - 1 - - -<br />
Paraguay 3 1 3 2 1 - 1 2 - 1 1<br />
Peru 13 13 20 37 24 19 25 24 24 30 35<br />
Suriname - - 1 - - - - - - - 1<br />
Uruguay 25 21 28 8 16 28 24 46 31 31 41<br />
Venezuela 1 6 5 3 7 4 5 12 10 5 4<br />
South America nfd - - - 1 1 - - 1 1 - 1<br />
Total 268 277 203 248 231 311 326 413 402 438 511<br />
Central America<br />
Belize - - - - - - - - - 1 4<br />
Costa Rica 1 - 2 9 2 6 2 12 1 7 4<br />
El Salvador 8 7 5 3 3 4 5 3 4 5 5<br />
Guatemala 3 1 1 2 2 1 - - 1 2 -<br />
Honduras - - - 1 2 - - - 1 1 1<br />
Mexico 10 23 22 29 19 21 28 25 31 44 55<br />
Nicaragua 2 - - 5 - - 4 3 5 4 3<br />
Panama 1 1 1 - - - 3 3 1 5 6<br />
Central America nfd - - - - - - - - 1 - -<br />
Total 25 32 31 49 28 32 42 46 45 69 78<br />
The Caribbean<br />
Antigua and Barbuda - 2 - 1 2 1 9 8 1 - 3<br />
Aruba - - - - 1 5 1 4 6 2 4<br />
Bahamas 14 4 4 4 3 6 3 10 12 18 13<br />
Barbados 2 2 15 4 2 2 3 6 4 5 4<br />
Cayman Islands 3 5 2 14 8 18 23 27 45 65 39<br />
Dominica 1 1 1 1 - 1 - 3 1 - -<br />
Dominican Republic - - 1 - 1 - - 1 - 1 4<br />
Grenada - - - - - - 1 1 - 4 2<br />
Haiti - - - - - - - - 1 - -<br />
Jamaica 8 8 5 12 11 17 6 6 10 12 16<br />
Martinique - - 1 - - 1 - 1 - - -<br />
Montserrat - 3 - - - - 1 - 1 4 2<br />
Netherlands Antilles 1 - 1 - - 1 - - - - -
21<br />
Table 6(continued)<br />
Permanent departures by region/country <strong>of</strong> future residence,<br />
1998-99 to 2008-09<br />
Financial Year<br />
Region/country<br />
<strong>of</strong> future residence<br />
1998-99 1999-00 2000-01 2001-02 2002-03 2003-04 2004-05 2005-06 2006-07 2007-08 2008-09<br />
The Caribbean (continued)<br />
St Kitts & Nevis - - 1 - - - - - - 3 4<br />
St Vincent & The Grenadines - - - - - - - - - 1 -<br />
Trinidad and Tobago 6 4 5 2 4 9 3 13 7 4 7<br />
Turks & Caicos Islands - - - - - - - 3 5 - 5<br />
Virgin Islands British 1 - - - - - - - 6 3 -<br />
Caribbean nfd - - - - - 1 - - - - -<br />
Total 36 29 36 38 32 62 50 83 99 122 103<br />
Total 329 338 270 335 291 405 418 542 546 629 692<br />
Sub-Saharan Africa<br />
Central and West Africa<br />
Cameroon - - 2 - 1 - - - - 3 -<br />
Cape Verde - - - - - - 1 - - - -<br />
Chad 5 - - - - - - 1 - - -<br />
Congo - - - 3 - 2 - 1 5 - 10<br />
Congo Dem Republic - - - - - 2 - - - 1 2<br />
Cote D'Ivoire - - - 1 - - - - - - 1<br />
Equatorial Guinea - - - - 2 5 3 2 2 - 2<br />
Gabon - - - - 1 1 3 - - 3 1<br />
Gambia - - - 2 - - - - - - 1<br />
Ghana 31 24 24 18 11 23 18 24 15 24 23<br />
Guinea 6 - - 6 1 1 2 3 3 5 5<br />
Liberia - - - - - - 1 2 2 1 2<br />
Mali 1 - 1 - 5 2 1 4 1 1 6<br />
Mauritania 1 1 2 1 1 - 4 2 3 2 1<br />
Niger 1 - 5 - - - - - - - 3<br />
Nigeria 8 6 14 11 7 31 30 44 37 27 33<br />
Senegal 1 1 - - 1 - - - - 3 4<br />
Sierra Leone - - - - 1 3 3 2 3 1 -<br />
Togo - - - - - 1 - - - - -<br />
Total 54 32 48 42 31 71 66 85 71 71 94<br />
Southern and East Africa<br />
Angola 1 3 1 4 13 11 12 15 11 8 24<br />
Botswana 7 7 2 10 5 13 19 9 16 7 12<br />
Burundi - - - - - 1 - - 1 - -<br />
Djibouti - - - - 2 - 2 - - - -<br />
Eritrea - - - - - 4 - - 1 - 2<br />
Ethiopia 1 6 3 5 3 2 6 - 5 4 11<br />
Kenya 20 20 22 13 15 25 28 31 32 38 48<br />
Lesotho - 3 - - - - - - - - -<br />
Madagascar 1 - - - 1 1 1 - - 4 1<br />
Malawi - 1 2 2 4 1 3 3 - 4 -
22<br />
Table 6(continued)<br />
Permanent departures by region/country <strong>of</strong> future residence,<br />
1998-99 to 2008-09<br />
Financial Year<br />
Region/country<br />
<strong>of</strong> future residence<br />
1998-99 1999-00 2000-01 2001-02 2002-03 2003-04 2004-05 2005-06 2006-07 2007-08 2008-09<br />
Southern and East Africa (continued)<br />
Mauritius 22 22 21 24 14 47 27 25 31 38 38<br />
Mozambique 7 5 4 4 2 4 8 2 1 16 13<br />
Namibia 1 - 4 5 - 7 2 8 15 6 11<br />
Reunion - - - - - - 1 1 2 1 -<br />
Rwanda - - - - - 1 - - - 2 1<br />
Seychelles 14 10 8 7 8 6 15 11 12 6 21<br />
Somalia 3 - 1 8 1 2 3 3 2 2 6<br />
South Africa 140 157 190 222 231 262 278 283 322 291 359<br />
Swaziland - - - - - 1 - - 1 - -<br />
Tanzania 17 17 17 19 14 29 25 18 28 18 19<br />
Uganda 1 1 3 1 2 6 3 6 3 7 11<br />
Zambia 5 7 10 12 4 16 7 9 31 19 19<br />
Zimbabwe 10 22 13 11 12 11 17 19 14 18 18<br />
Total 250 281 301 347 331 450 457 443 528 489 614<br />
Total 304 313 349 389 362 521 523 528 599 560 708<br />
Supplementar y codes (e)<br />
Oceania & Antarctica nfd - - - - - - - 1 - - -<br />
Europe & USSR nfd 10 3 7 15 6 4 7 13 12 9 5<br />
Fmr USSR 15 40 7 19 2 3 2 7 10 11 4<br />
Total<br />
25 43 14 34 8 7 9 21 22 20 9<br />
Not stated 6 11 245 18 14 8 6 11 4 5 12<br />
Total all countries 35 181 41 078 46 521 48 241 50 463 59 078 62 606 67 853 72 103 76 923 81 018<br />
(e) Supplementary codes which cannot be classified to any major region in the Standard Australian Classifications <strong>of</strong> Countries (SACC). This may<br />
lead to under reporting <strong>of</strong> their component countries in the rest <strong>of</strong> the table, care should be taken when interpreting the data.
23<br />
Table 7<br />
Permanent departures by region/country <strong>of</strong> birth and age,<br />
2008-09<br />
Age Group (years)<br />
Birthplace<br />
0-4 5-14 15-24 25-34 35-44 45-54 55-64 65+ Total<br />
Oceania<br />
Australia (incl ext terr) 3 676 3 959 2 956 12 793 10 089 5 058 2 180 538 41 249<br />
New Zealand 506 725 1 503 2 075 1 333 928 631 302 8 003<br />
Melanesia<br />
New Caledonia 1 3 3 5 5 1 - 1 19<br />
Papua New Guinea 4 6 6 58 88 31 12 - 205<br />
Solomon Islands - 2 2 7 5 3 2 - 21<br />
Vanuatu 1 2 5 1 4 5 - 1 19<br />
Total 6 13 16 71 102 40 14 2 264<br />
Micronesia<br />
Guam - 1 1 1 - - - - 3<br />
Kiribati - - - - - - 2 - 2<br />
Marshall Islands - - - 1 - - - - 1<br />
Micronesia Federated States 1 - - - - - - - 1<br />
Nauru - 1 - 1 4 1 - - 7<br />
Total 1 2 1 3 4 1 2 - 14<br />
Polynesia (excluding Hawaii)<br />
Cook Islands 7 4 13 9 8 11 2 5 59<br />
Fiji 9 18 23 80 54 44 22 21 271<br />
French Polynesia 1 - 2 5 - 1 1 - 10<br />
Niue 1 - - 1 1 1 - - 4<br />
Samoa 19 28 30 45 64 68 41 17 312<br />
Samoa American - - - 1 2 2 - - 5<br />
Tokelau 2 1 3 3 1 1 3 1 15<br />
Tonga 4 2 8 27 58 51 43 10 203<br />
Tuvalu - - - - - - 1 - 1<br />
Wallis & Futuna - - - - - 1 - - 1<br />
Polynesia (excl Hawaii) nec - - - - 1 - - - 1<br />
Total 43 53 79 171 189 180 113 54 882<br />
Total 4 232 4 752 4 555 15 113 11 717 6 207 2 940 896 50 412<br />
Europe<br />
United Kingdom & Ireland<br />
United Kingdom 440 603 382 970 1 581 1 129 634 421 6 160<br />
Ireland 25 30 20 100 133 74 50 18 450<br />
Total 465 633 402 1 070 1 714 1 203 684 439 6 610<br />
Western Europe<br />
Austria 5 10 4 8 26 5 4 6 68<br />
Belgium 6 5 3 14 2 6 3 1 40<br />
France 35 41 16 46 48 40 12 13 251<br />
Germany 34 53 30 67 106 81 65 43 479<br />
Monaco 2 1 2 - - - - - 5<br />
Netherlands 22 36 14 43 51 30 49 21 266<br />
Switzerland 32 35 17 33 41 32 7 13 210<br />
Total 136 181 86 211 274 194 140 97 1 319
24<br />
Table 7(continued)<br />
Permanent departures by region/country <strong>of</strong> birth and age,<br />
2008-09<br />
Age Group (years)<br />
Birthplace<br />
0-4 5-14 15-24 25-34 35-44 45-54 55-64 65+ Total<br />
Northern Europe<br />
Denmark 7 17 12 13 19 8 4 2 82<br />
Faroe Islands 1 - - - - - - - 1<br />
Finland 3 1 3 9 14 10 5 5 50<br />
Iceland - - - - 2 1 - - 3<br />
Norway 1 12 2 10 5 2 1 1 34<br />
Sweden 21 19 15 34 33 14 7 5 148<br />
Total 33 49 32 66 73 35 17 13 318<br />
Southern Europe<br />
Italy 14 22 16 34 35 37 42 39 239<br />
Malta 2 11 4 11 9 14 20 13 84<br />
Portugal 2 - 2 6 6 14 5 25 60<br />
San Marino - - - - - - - - -<br />
Spain 5 6 5 14 12 8 6 27 83<br />
Total 23 39 27 65 62 73 73 104 466<br />
South Eastern Europe<br />
Albania - - 3 6 - 3 1 1 14<br />
Bosnia and Herzegovina - - 3 19 7 16 9 12 66<br />
Bulgaria 1 1 - 6 1 3 - 3 15<br />
Croatia 5 3 8 14 20 16 30 37 133<br />
Cyprus 1 4 - 7 20 20 22 21 95<br />
Fmr Yugo Rep <strong>of</strong> Macedonia - 4 3 9 15 11 13 22 77<br />
Greece 10 12 12 21 32 48 51 113 299<br />
Moldova - - - 1 - - - - 1<br />
Romania - 2 1 4 11 7 11 6 42<br />
Serbia - - - - 1 1 1 1 4<br />
Fmr Serbia & Montenegro 2 2 9 21 35 43 32 78 222<br />
Slovenia - 1 1 - 2 1 3 2 10<br />
Total 19 29 40 108 144 169 173 296 978<br />
Eastern Europe<br />
Belarus (a) - - - - - 1 - 1 2<br />
Czech Republic (b) - 3 - 13 4 3 5 3 31<br />
Estonia (a) - - - 1 1 - - 1 3<br />
Former Czechoslovakia (b) - - 1 17 6 3 15 10 52<br />
Hungary - - 7 9 12 9 10 25 72<br />
Latvia (a) - - - 1 3 - 1 1 6<br />
Lithuania (a) - - - 1 2 - - 1 4<br />
Poland 1 2 8 54 28 36 25 37 191<br />
Russian Federation (a) 5 2 5 17 15 12 3 2 61<br />
Slovakia (b) 1 1 1 8 4 - - - 15<br />
Ukraine - 1 1 4 5 6 1 1 19<br />
Total 7 9 23 125 80 70 60 82 456<br />
Total 683 940 610 1 645 2 347 1 744 1 147 1 031 10 147<br />
(a) As reliable data are not available for the component countries <strong>of</strong> the former USSR and Baltic States prior to 1995-96, care should<br />
be taken when interpreting the data.<br />
(b) As reliable data are not available for the component countries <strong>of</strong> the former Czechoslovakia prior to 1995-96, care should be<br />
taken when interpreting the data.
25<br />
Table 7(continued)<br />
Permanent departures by region/country <strong>of</strong> birth and age,<br />
2008-09<br />
Age Group (years)<br />
Birthplace<br />
0-4 5-14 15-24 25-34 35-44 45-54 55-64 65+ Total<br />
North Africa & the Middle East<br />
North Africa<br />
Algeria - - - 2 3 1 1 1 8<br />
Egypt 6 7 7 22 23 26 30 16 137<br />
Libya - - - 1 3 3 - - 7<br />
Morocco - - - 2 1 2 1 2 8<br />
Sudan - 2 1 17 16 8 3 4 51<br />
Tunisia - 1 - - 2 1 - - 4<br />
Total 6 10 8 44 48 41 35 23 215<br />
Middle East<br />
Bahrain 8 4 3 2 3 4 - - 24<br />
Gaza Strip & West Bank - - - 1 - 2 2 - 5<br />
Iran 3 26 19 72 59 41 25 10 255<br />
Iraq 4 15 31 94 116 57 28 14 359<br />
Israel 24 40 23 38 31 14 8 6 184<br />
Jordan 3 1 6 13 9 10 1 1 44<br />
Kuwait 2 2 15 14 14 11 2 - 60<br />
Lebanon 10 14 30 108 125 65 50 50 452<br />
Oman 3 3 1 - - - - - 7<br />
Qatar 11 - - - - 2 - - 13<br />
Saudi Arabia 6 7 8 14 2 2 - 1 40<br />
Syria 2 6 4 11 6 14 5 6 54<br />
Turkey 3 8 10 28 57 26 17 34 183<br />
United Arab Emirates 64 17 8 15 - - 1 - 105<br />
Yemen - 3 1 - 1 2 - - 7<br />
Middle East nfd - - - 1 - 1 1 - 3<br />
Total 143 146 159 411 423 251 140 122 1 795<br />
Total<br />
149 156 167 455 471 292 175 145 2 010<br />
Southeast Asia<br />
Brunei 4 4 - 10 7 5 2 - 32<br />
Burma - - 2 9 12 10 15 5 53<br />
Cambodia 3 3 10 40 43 19 19 10 147<br />
East Timor 2 - - 16 7 10 3 - 38<br />
Indonesia 18 59 85 144 109 109 95 25 644<br />
Laos 1 - 2 6 16 21 7 3 56<br />
Malaysia 19 25 46 267 191 151 100 25 824<br />
Philippines 16 31 27 122 137 87 43 20 483<br />
Singapore 187 78 40 102 94 52 30 4 587<br />
Thailand 53 65 29 137 138 97 35 6 560<br />
Vietnam 16 23 70 353 309 238 134 77 1 220<br />
Total 319 288 311 1 206 1 063 799 483 175 4 644
26<br />
Table 7(continued)<br />
Permanent departures by region/country <strong>of</strong> birth and age,<br />
2008-09<br />
Age Group (years)<br />
Birthplace<br />
0-4 5-14 15-24 25-34 35-44 45-54 55-64 65+ Total<br />
Northeast Asia<br />
China (excl SARs & Taiwan) 130 198 547 906 1 035 1 446 432 305 4 999<br />
Hong Kong (SAR <strong>of</strong> China) 148 154 138 599 401 495 207 54 2 196<br />
Japan 75 51 22 104 125 55 18 9 459<br />
Korea 18 30 46 131 140 171 77 54 667<br />
Macau (SAR <strong>of</strong> China) 1 2 6 4 4 12 6 2 37<br />
Mongolia - - - 2 - - - - 2<br />
Taiwan 30 46 76 243 110 225 169 43 942<br />
Total 402 481 835 1 989 1 815 2 404 909 467 9 302<br />
Southern Asia<br />
Bangladesh - 7 4 13 11 4 3 4 46<br />
India 22 38 43 261 183 99 56 28 730<br />
Maldives - - - 1 - - - - 1<br />
Nepal - 1 - 5 4 - - - 10<br />
Pakistan 4 12 6 27 23 18 6 2 98<br />
Sri Lanka 1 9 8 58 53 49 22 8 208<br />
Total 27 67 61 365 274 170 87 42 1 093<br />
Central Asia<br />
Afghanistan - 3 18 33 21 7 9 3 94<br />
Armenia - - 1 - - 1 - - 2<br />
Azerbaijan - 1 - 1 - - - - 2<br />
Kazakhstan (a) - - - 1 2 1 - - 4<br />
Uzbekistan (a) - - 1 - - 1 - - 2<br />
Total - 4 20 35 23 10 9 3 104<br />
Northern America<br />
Bermuda 4 - 2 3 - - - - 9<br />
Canada 38 59 42 136 117 80 18 6 496<br />
USA 151 229 128 219 214 134 72 13 1 160<br />
Total 193 288 172 358 331 214 90 19 1 665<br />
South America, Central America & the Caribbean<br />
South America<br />
Argentina 3 2 - 13 28 11 6 8 71<br />
Bolivia - - - 1 - 3 1 - 5<br />
Brazil 1 7 10 26 21 10 - 2 77<br />
Chile 10 12 2 25 36 19 19 18 141<br />
Colombia 2 1 2 19 14 6 3 - 47<br />
Ecuador 1 - 1 1 7 - 1 1 12<br />
Paraguay - - - 1 - - 1 - 2<br />
Peru 1 1 3 12 9 6 2 1 35<br />
Uruguay - - 1 5 7 5 8 15 41<br />
Venezuela - 2 - 1 1 - - - 4<br />
Total 18 25 19 104 123 60 41 45 435<br />
(a) As reliable data are not available for the component countries <strong>of</strong> the former USSR and Baltic States prior to 1995-96, care should<br />
be taken when interpreting the data.
27<br />
Table 7(continued)<br />
Permanent departures by region/country <strong>of</strong> birth and age,<br />
2008-09<br />
Age Group (years)<br />
Birthplace<br />
0-4 5-14 15-24 25-34 35-44 45-54 55-64 65+ Total<br />
Central America<br />
Costa Rica - - - - 1 - - - 1<br />
El Salvador - 1 3 9 4 2 1 2 22<br />
Guatemala - - - - - 1 - - 1<br />
Honduras - - - - - 1 - - 1<br />
Mexico 1 4 2 3 3 3 - - 16<br />
Nicaragua - - - - 1 1 1 - 3<br />
Panama - - - - 1 - - - 1<br />
Total 1 5 5 12 10 8 2 2 45<br />
The Caribbean<br />
Bahamas 1 1 - 1 1 - - - 4<br />
Barbados 1 1 - 1 - - - 1 4<br />
Cayman Islands 2 1 - - - - - - 3<br />
Cuba - - - - 3 - - - 3<br />
Dominican Republic - - - - 1 1 - 1 3<br />
Guadeloupe - - - 1 - - - - 1<br />
Haiti - - - - - - 1 - 1<br />
Jamaica - - - 1 1 - - - 2<br />
Puerto Rico - - - - 2 - - - 2<br />
Trinidad and Tobago 1 2 3 4 - 5 - - 15<br />
Virgin Islands USA - - - 1 - - - - 1<br />
Total 5 5 3 9 8 6 1 2 39<br />
Total 24 35 27 125 141 74 44 49 519<br />
Sub-Saharan Africa<br />
Central and West Africa<br />
Cameroon - - - 1 - - - - 1<br />
Chad - - - 1 - - - - 1<br />
Congo - - 1 - 1 - - - 2<br />
Congo, Democratic Republic <strong>of</strong> - 1 1 - - - 1 - 3<br />
Equatorial Guinea - - - - - - 1 - 1<br />
Ghana 1 - 1 5 2 2 - - 11<br />
Liberia - - 3 - 1 - - - 4<br />
Mali 1 - - - - - - - 1<br />
Nigeria - - - 5 4 3 2 - 14<br />
Senegal - - - 1 - 1 - - 2<br />
Sierra Leone 2 - - - - - - - 2<br />
Togo - - - - 1 - - - 1<br />
Total 4 1 6 13 9 6 4 - 43<br />
Southern and East Africa<br />
Angola - 1 - 2 5 1 - - 9<br />
Botswana - 1 1 - - - - - 2<br />
Burundi - - 1 - 1 - - - 2<br />
Eritrea - - - 2 6 2 - - 10<br />
Ethiopia 1 4 10 5 10 2 - - 32<br />
Kenya 5 5 2 23 18 19 4 3 79<br />
Lesotho - - - - 1 - - - 1<br />
Malawi - - 1 1 - - - - 2
28<br />
Table 7(continued)<br />
Permanent departures by region/country <strong>of</strong> birth and age,<br />
2008-09<br />
Age Group (years)<br />
Birthplace<br />
0-4 5-14 15-24 25-34 35-44 45-54 55-64 65+ Total<br />
Southern and East Africa (continued)<br />
Mauritius 1 1 1 8 14 9 5 2 41<br />
Mozambique - - - - 2 - 2 - 4<br />
Namibia - 1 - - 1 1 - - 3<br />
Seychelles - - - 3 2 9 1 - 15<br />
Somalia 1 1 5 8 8 - 2 - 25<br />
South Africa 32 37 55 218 160 91 30 12 635<br />
Swaziland - - - 1 - - - - 1<br />
Tanzania - - - 2 5 2 2 1 12<br />
Uganda - - - 1 5 2 - 2 10<br />
Zambia 1 1 1 9 10 11 3 - 36<br />
Zimbabwe 4 4 3 37 33 25 14 1 121<br />
Total 45 56 80 320 281 174 63 21 1 040<br />
Total 49 57 86 333 290 180 67 21 1 083<br />
Supplementary codes (c)<br />
Fmr USSR - - 5 6 8 6 4 4 33<br />
Total<br />
- - 5 6 8 6 4 4 33<br />
Not stated - - - 2 - 1 2 1 6<br />
Total all countries 6 078 7 068 6 849 21 632 18 480 12 101 5 957 2 853 81 018<br />
(c) Supplementary codes which cannot be classified to any major region in the Standard Australian Classifications <strong>of</strong> Countries<br />
(SACC). This may lead to under reporting <strong>of</strong> their component countries in the rest <strong>of</strong> the table, care should be taken when<br />
interpreting the data.
29<br />
Table 8<br />
Overseas born permanent departures by region/country <strong>of</strong><br />
birth and period <strong>of</strong> residence, 2008-09<br />
Period <strong>of</strong> Residence<br />
< 2 years 2 to < 5 years 5 years + Total (a)<br />
Birthplace No. % No. % No. % No. %<br />
Oceania<br />
New Zealand 1 158 21.0 1 218 19.5 5 515 20.0 8 003 20.1<br />
Melanesia<br />
New Caledonia 1 - 1 - 17 0.1 19 -<br />
Papua New Guinea 7 0.1 15 0.2 181 0.7 205 0.5<br />
Solomon Islands - - 4 0.1 17 0.1 21 0.1<br />
Vanuatu - - 1 - 18 0.1 19 -<br />
Total 8 0.1 21 0.3 233 0.8 264 0.7<br />
Micronesia<br />
Guam - - 1 - 2 - 3 -<br />
Kiribati - - - - 2 - 2 -<br />
Marshall Islands - - - - 1 - 1 -<br />
Micronesia Federated States 1 - - - - - 1 -<br />
Nauru - - - - 7 - 7 -<br />
Total 1 - 1 - 12 - 14 -<br />
Polynesia (excluding Hawaii)<br />
Cook Islands 10 0.2 11 0.2 38 0.1 59 0.1<br />
Fiji 28 0.5 45 0.7 198 0.7 271 0.7<br />
French Polynesia 1 - - - 9 - 10 -<br />
Niue 2 - - - 1 - 4 -<br />
Samoa 45 0.8 57 0.9 207 0.8 312 0.8<br />
Samoa American 1 - - - 4 - 5 -<br />
Tokelau 4 0.1 4 0.1 5 - 15 -<br />
Tonga 14 0.3 24 0.4 164 0.6 203 0.5<br />
Tuvalu - - - - 1 - 1 -<br />
Wallis & Futuna - - - - 1 - 1 -<br />
Polynesia (excl Hawaii) nec - - - - 1 - 1 -<br />
Total 105 1.9 141 2.3 629 2.3 882 2.2<br />
Total 1 272 23.0 1 381 22.1 6 389 23.2 9 163 23.0<br />
Europe<br />
United Kingdom & Ireland<br />
United Kingdom 1 087 19.7 976 15.6 4 010 14.6 6 160 15.5<br />
Ireland 65 1.2 71 1.1 310 1.1 450 1.1<br />
Total 1 152 20.8 1 047 16.8 4 320 15.7 6 610 16.6<br />
Western Europe<br />
Austria 10 0.2 9 0.1 49 0.2 68 0.2<br />
Belgium 9 0.2 4 0.1 25 0.1 40 0.1<br />
France 45 0.8 39 0.6 155 0.6 251 0.6<br />
Germany 76 1.4 57 0.9 334 1.2 479 1.2<br />
Monaco 1 - 2 - 2 - 5 -<br />
Netherlands 43 0.8 35 0.6 181 0.7 266 0.7<br />
Switzerland 36 0.7 37 0.6 133 0.5 210 0.5<br />
Total 220 4.0 183 2.9 879 3.2 1 319 3.3<br />
(a) Includes not stated.
30<br />
Table 8(continued)<br />
Overseas born permanent departures by region/country <strong>of</strong><br />
birth and period <strong>of</strong> residence, 2008-09<br />
Period <strong>of</strong> Residence<br />
< 2 years 2 to < 5 years 5 years + Total (a)<br />
Birthplace No. % No. % No. % No. %<br />
Northern Europe<br />
Denmark 16 0.3 13 0.2 50 0.2 82 0.2<br />
Faroe Islands - - 1 - - - 1 -<br />
Finland 10 0.2 7 0.1 33 0.1 50 0.1<br />
Iceland - - - - 3 - 3 -<br />
Norway 6 0.1 1 - 27 0.1 34 0.1<br />
Sweden 30 0.5 26 0.4 91 0.3 148 0.4<br />
Total 62 1.1 48 0.8 204 0.7 318 0.8<br />
Southern Europe<br />
Italy 26 0.5 34 0.5 176 0.6 239 0.6<br />
Malta 15 0.3 12 0.2 56 0.2 84 0.2<br />
Portugal 4 0.1 6 0.1 50 0.2 60 0.2<br />
Spain 9 0.2 7 0.1 67 0.2 83 0.2<br />
Total 54 1.0 59 0.9 349 1.3 466 1.2<br />
South Eastern Europe<br />
Albania 2 - 2 - 10 - 14 -<br />
Bosnia and Herzegovina 2 - 5 0.1 59 0.2 66 0.2<br />
Bulgaria 4 0.1 - - 11 - 15 -<br />
Croatia 15 0.3 12 0.2 103 0.4 133 0.3<br />
Cyprus 9 0.2 4 0.1 82 0.3 95 0.2<br />
Fmr Yugo Rep <strong>of</strong> Macedonia 5 0.1 9 0.1 63 0.2 77 0.2<br />
Greece 31 0.6 19 0.3 248 0.9 299 0.8<br />
Moldova - - - - 1 - 1 -<br />
Romania 5 0.1 6 0.1 31 0.1 42 0.1<br />
Serbia 2 - - - 2 - 4 -<br />
Fmr Serbia & Montenegro 14 0.3 15 0.2 193 0.7 222 0.6<br />
Slovenia - - 1 - 9 - 10 -<br />
Total 89 1.6 73 1.2 812 3.0 978 2.5<br />
Eastern Europe<br />
Belarus (b) - - - - 2 - 2 -<br />
Czech Republic (c) 3 0.1 7 0.1 21 0.1 31 0.1<br />
Estonia (b) - - - - 3 - 3 -<br />
Former Czechoslovakia (c) 2 - 5 0.1 45 0.2 52 0.1<br />
Hungary 6 0.1 8 0.1 58 0.2 72 0.2<br />
Latvia (b) - - - - 6 - 6 -<br />
Lithuania (b) 1 - - - 3 - 4 -<br />
Poland 10 0.2 17 0.3 164 0.6 191 0.5<br />
Russian Federation (b) 11 0.2 16 0.3 33 0.1 61 0.2<br />
Slovakia (c) - - 5 0.1 10 - 15 -<br />
Ukraine 2 - 8 0.1 8 - 19 -<br />
Total 35 0.6 66 1.1 353 1.3 456 1.1<br />
Total 1 612 29.2 1 476 23.6 6 917 25.1 10 147 25.5<br />
(a) Includes not stated.<br />
(b) As reliable data are not available for the component countries <strong>of</strong> the former USSR and Baltic States prior to 1995-96, care should<br />
be taken when interpreting the data.<br />
(c) As reliable data are not available for the component countries <strong>of</strong> the former Czechoslovakia prior to 1995-96, care should be<br />
taken when interpreting the data.
31<br />
Table 8(continued)<br />
Overseas born permanent departures by region/country <strong>of</strong><br />
birth and period <strong>of</strong> residence, 2008-09<br />
Period <strong>of</strong> Residence<br />
< 2 years 2 to < 5 years 5 years + Total (a)<br />
Birthplace No. % No. % No. % No. %<br />
North Africa & the Middle East<br />
North Africa<br />
Algeria 2 - 1 - 5 - 8 -<br />
Egypt 14 0.3 20 0.3 100 0.4 137 0.3<br />
Libya - - - - 7 - 7 -<br />
Morocco 1 - 2 - 5 - 8 -<br />
Sudan 4 0.1 19 0.3 28 0.1 51 0.1<br />
Tunisia 2 - - - 2 - 4 -<br />
Total 23 0.4 42 0.7 147 0.5 215 0.5<br />
Middle East<br />
Bahrain 6 0.1 3 - 15 0.1 24 0.1<br />
Gaza Strip & West Bank - - - - 5 - 5 -<br />
Iran 42 0.8 44 0.7 158 0.6 255 0.6<br />
Iraq 42 0.8 60 1.0 254 0.9 359 0.9<br />
Israel 35 0.6 35 0.6 114 0.4 184 0.5<br />
Jordan 9 0.2 6 0.1 27 0.1 44 0.1<br />
Kuwait 6 0.1 19 0.3 35 0.1 60 0.2<br />
Lebanon 30 0.5 64 1.0 355 1.3 452 1.1<br />
Oman 1 - 4 0.1 2 - 7 -<br />
Qatar 7 0.1 4 0.1 2 - 13 -<br />
Saudi Arabia 11 0.2 5 0.1 24 0.1 40 0.1<br />
Syria 5 0.1 14 0.2 35 0.1 54 0.1<br />
Turkey 10 0.2 20 0.3 153 0.6 183 0.5<br />
United Arab Emirates 50 0.9 26 0.4 29 0.1 105 0.3<br />
Yemen - - 2 - 2 - 7 -<br />
Middle East nfd - - 1 - 2 - 3 -<br />
Total 254 4.6 307 4.9 1 212 4.4 1 795 4.5<br />
Total 277 5.0 349 5.6 1 359 4.9 2 010 5.1<br />
Southeast Asia<br />
Brunei 1 - 5 0.1 23 0.1 32 0.1<br />
Burma 4 0.1 8 0.1 41 0.1 53 0.1<br />
Cambodia 10 0.2 31 0.5 106 0.4 147 0.4<br />
East Timor - - 11 0.2 27 0.1 38 0.1<br />
Indonesia 45 0.8 106 1.7 483 1.8 644 1.6<br />
Laos 3 0.1 3 - 50 0.2 56 0.1<br />
Malaysia 64 1.2 99 1.6 659 2.4 824 2.1<br />
Philippines 41 0.7 76 1.2 354 1.3 483 1.2<br />
Singapore 147 2.7 106 1.7 333 1.2 587 1.5<br />
Thailand 75 1.4 123 2.0 358 1.3 560 1.4<br />
Vietnam 87 1.6 190 3.0 943 3.4 1 220 3.1<br />
Total 477 8.6 758 12.1 3 377 12.3 4 644 11.7<br />
(a) Includes not stated.
32<br />
Table 8(continued)<br />
Overseas born permanent departures by region/country <strong>of</strong><br />
birth and period <strong>of</strong> residence, 2008-09<br />
Period <strong>of</strong> Residence<br />
< 2 years 2 to < 5 years 5 years + Total (a)<br />
Birthplace No. % No. % No. % No. %<br />
Northeast Asia<br />
China (excl SARs) 663 12.0 1 111 17.8 3 187 11.6 4 999 12.6<br />
Hong Kong (SAR <strong>of</strong> China) 172 3.1 134 2.1 1 888 6.9 2 196 5.5<br />
Japan 82 1.5 54 0.9 303 1.1 459 1.2<br />
Korea 102 1.8 117 1.9 433 1.6 667 1.7<br />
Macau (SAR <strong>of</strong> China) 5 0.1 7 0.1 25 0.1 37 0.1<br />
Mongolia 1 - 1 - - - 2 -<br />
Taiwan 98 1.8 153 2.4 686 2.5 942 2.4<br />
Total 1 123 20.3 1 577 25.2 6 522 23.7 9 302 23.4<br />
Southern Asia<br />
Bangladesh 8 0.1 10 0.2 26 0.1 46 0.1<br />
India 160 2.9 118 1.9 445 1.6 730 1.8<br />
Maldives 1 - - - - - 1 -<br />
Nepal 2 - 5 0.1 3 - 10 -<br />
Pakistan 16 0.3 19 0.3 62 0.2 98 0.2<br />
Sri Lanka 27 0.5 16 0.3 165 0.6 208 0.5<br />
Total 214 3.9 168 2.7 701 2.5 1 093 2.7<br />
Central Asia<br />
Afghanistan 8 0.1 32 0.5 52 0.2 94 0.2<br />
Armenia (b) - - - - 2 - 2 -<br />
Azerbaijan (b) 1 - 1 - - - 2 -<br />
Georgia (b) - - - - - - - -<br />
Kazakhstan (b) 1 - - - 3 - 4 -<br />
Uzbekistan (b) 1 - - - 1 - 2 -<br />
Total 11 0.2 33 0.5 58 0.2 104 0.3<br />
Northern America<br />
Bermuda 4 0.1 1 - 4 - 9 -<br />
Canada 83 1.5 70 1.1 332 1.2 496 1.2<br />
USA 223 4.0 194 3.1 704 2.6 1 160 2.9<br />
Total 310 5.6 265 4.2 1 040 3.8 1 665 4.2<br />
South America, Central America & the Caribbean<br />
South America<br />
Argentina 9 0.2 6 0.1 55 0.2 71 0.2<br />
Bolivia - - - - 5 - 5 -<br />
Brazil 15 0.3 24 0.4 37 0.1 77 0.2<br />
Chile 24 0.4 14 0.2 101 0.4 141 0.4<br />
Colombia 5 0.1 9 0.1 32 0.1 47 0.1<br />
Ecuador 2 - - - 10 - 12 -<br />
Paraguay - - - - 2 - 2 -<br />
Peru 6 0.1 7 0.1 22 0.1 35 0.1<br />
Uruguay 1 - 6 0.1 34 0.1 41 0.1<br />
Venezuela 1 - - - 3 - 4 -<br />
Total 63 1.1 66 1.1 301 1.1 435 1.1<br />
(a) Includes not stated.<br />
(b) As reliable data are not available for the component countries <strong>of</strong> the former USSR and Baltic States prior to 1995-96, care should<br />
be taken when interpreting the data.
33<br />
Table 8(continued)<br />
Overseas born permanent departures by region/country <strong>of</strong><br />
birth and period <strong>of</strong> residence, 2008-09<br />
Period <strong>of</strong> Residence<br />
< 2 years 2 to < 5 years 5 years + Total (a)<br />
Birthplace No. % No. % No. % No. %<br />
Central America<br />
Costa Rica - - - - 1 - 1<br />
-<br />
El Salvador 2 - 2 - 18 0.1 22 0.1<br />
Guatemala - - - - 1 - 1<br />
-<br />
Honduras - - - - 1 - 1<br />
-<br />
Mexico 2 - 3 - 9 - 16<br />
-<br />
Nicaragua - - - - 3 - 3<br />
-<br />
Panama - - 1 - - - 1<br />
-<br />
Total 4 0.1 6 0.1 33 0.1 45 0.1<br />
The Caribbean<br />
Bahamas 1 - - - 3 - 4 -<br />
Barbados 3 0.1 - - 1 - 4<br />
-<br />
Cayman Islands 2 - - - 1 - 3 -<br />
Cuba - - 1 - 2 - 3 -<br />
Dominican Republic 1 - - - 2 - 3 -<br />
Guadeloupe - - - - 1 - 1<br />
-<br />
Haiti 1 - - - - - 1 -<br />
Jamaica - - 1 - 1 - 2 -<br />
Puerto Rico - - - - 2 - 2<br />
-<br />
Trinidad and Tobago 3 0.1 6 0.1 6 - 15 -<br />
Virgin Islands United States - - - - 1 - 1<br />
-<br />
Total 11 0.2 8 0.1 20 0.1 39 0.1<br />
Total 78 1.4 80 1.3 354 1.3 519 1.3<br />
Sub-Saharan Africa<br />
Central and West Africa<br />
Cameroon - - - - 1 - 1<br />
-<br />
Chad - - - - 1 - 1<br />
-<br />
Congo - - - - 2 - 2<br />
-<br />
Congo Dem Rep Of - - 2 - 1 - 3 -<br />
Equatorial Guinea - - - - 1 - 1<br />
-<br />
Ghana 3 0.1 2 - 6 - 11<br />
-<br />
Liberia - - 2 - 2 - 4 -<br />
Mali 1 - - - - - 1 -<br />
Nigeria 1 - - - 13 - 14 -<br />
Senegal - - - - 2 - 2<br />
-<br />
Sierra Leone 2 - - - - - 2 -<br />
Togo - - - - 1 - 1<br />
-<br />
Total 7 0.1 6 0.1 30 0.1 43 0.1<br />
Southern and East Africa<br />
Angola - - 1 - 8 - 9 -<br />
Botswana - - - - 2 - 2<br />
-<br />
Burundi - - 1 - 1 - 2 -<br />
Eritrea - - - - 10 - 10<br />
-<br />
Ethiopia 5 0.1 10 0.2 16 0.1 32 0.1<br />
Kenya 10 0.2 14 0.2 54 0.2 79 0.2<br />
Lesotho - - - - 1 - 1<br />
-<br />
Malawi - - 2 - - - 2<br />
(a) Includes not stated.<br />
-
34<br />
Table 8(continued)<br />
Overseas born permanent departures by region/country <strong>of</strong><br />
birth and period <strong>of</strong> residence, 2008-09<br />
Period <strong>of</strong> Residence<br />
< 2 years 2 to < 5 years 5 years + Total (a)<br />
Birthplace No. % No. % No. % No. %<br />
Southern and East Africa (continued)<br />
Mauritius 3 0.1 4 0.1 34 0.1 41 0.1<br />
Mozambique - - - - 4 - 4 -<br />
Namibia - - 1 - 2 - 3 -<br />
Seychelles - - - - 15 0.1 15 -<br />
Somalia 3 0.1 6 0.1 16 0.1 25 0.1<br />
South Africa 106 1.9 81 1.3 440 1.6 635 1.6<br />
Swaziland - - - - 1 - 1 -<br />
Tanzania - - 2 - 10 - 12 -<br />
Uganda - - - - 10 - 10 -<br />
Zambia 5 0.1 4 0.1 27 0.1 36 0.1<br />
Zimbabwe 9 0.2 20 0.3 91 0.3 121 0.3<br />
Total 141 2.6 146 2.3 742 2.7 1 040 2.6<br />
Total 148 2.7 152 2.4 772 2.8 1 083 2.7<br />
Supplementary codes (d)<br />
Fmr USSR 3 0.1 10 0.2 20 0.1 33 0.1<br />
Total 3 0.1 10 0.2 20 0.1 33 0.1<br />
Not stated 2 - - - 4 - 6 -<br />
Total all countries 5 527 100 6 249 100 27 513 100 39 769 100<br />
(a) Includes not stated.<br />
(d) Supplementary codes which cannot be classified to any major region in the Standard Australian Classifications <strong>of</strong> Countries (SACC). This may<br />
lead to under reporting <strong>of</strong> their component countries in the rest <strong>of</strong> the table, care should be taken when interpreting the data.
35<br />
Table 9<br />
Overseas born permanent departures by selected birthplaces<br />
and country <strong>of</strong> future residence, 2008-09<br />
Country <strong>of</strong> future residence<br />
Region/country Same as country <strong>of</strong> birth Not country <strong>of</strong> birth Total<br />
<strong>of</strong> birth No. % No. % No.<br />
Oceania<br />
Fiji 92 33.9 179 66.1 271<br />
New Zealand 6 472 80.9 1 531 19.1 8 003<br />
Papua New Guinea 41 20.0 164 80.0 205<br />
Samoa 79 25.3 233 74.7 312<br />
Europe<br />
France 129 51.4 122 48.6 251<br />
Germany 204 42.6 275 57.4 479<br />
Greece 211 70.6 88 29.4 299<br />
Ireland 245 54.4 205 45.6 450<br />
Italy 119 49.8 120 50.2 239<br />
Netherlands 118 44.4 148 55.6 266<br />
Switzerland 148 70.5 62 29.5 210<br />
United Kingdom 3 298 53.5 2 862 46.5 6 160<br />
North Africa & the Middle East<br />
Iran 82 32.2 173 67.8 255<br />
Iraq 48 13.4 311 86.6 359<br />
Israel 121 65.8 63 34.2 184<br />
Lebanon 269 59.5 183 40.5 452<br />
Southeast Asia<br />
Indonesia 460 71.4 184 28.6 644<br />
Malaysia 227 27.5 597 72.5 824<br />
Philippines 178 36.9 305 63.1 483<br />
Singapore 370 63.0 217 37.0 587<br />
Thailand 414 73.9 146 26.1 560<br />
Vietnam 716 58.7 504 41.3 1 220<br />
Northeast Asia<br />
China (excl SARs & Taiwan) 3 180 63.6 1 819 36.4 4 999<br />
Hong Kong (SAR <strong>of</strong> China) 1 747 79.6 449 20.4 2 196<br />
Japan 331 72.1 128 27.9 459<br />
Korea 478 71.7 189 28.3 667<br />
Taiwan 704 74.7 238 25.3 942<br />
Southern Asia<br />
India 204 27.9 526 72.1 730<br />
Sri Lanka 51 24.5 157 75.5 208<br />
Central Asia<br />
Afghanistan 11 11.7 83 88.3 94<br />
Northern America<br />
Canada 310 62.5 186 37.5 496<br />
USA 828 71.4 332 28.6 1 160<br />
South America, Central America & the Caribbean<br />
Chile 87 61.7 54 38.3 141<br />
Africa (Excluding North Africa)<br />
South Africa 128 20.2 507 79.8 635<br />
Total selected countries 22 100 62.4 13 340 37.6 35 440<br />
Total Overseas born 23 770 59.8 15 999 40.2 39 769
36<br />
Table 10<br />
Australia born permanent departures by region/country <strong>of</strong><br />
future residence, 1998-99 to 2008-09<br />
Financial Year<br />
Region/country<br />
<strong>of</strong> future residence<br />
1998-99 1999-00 2000-01 2001-02 2002-03 2003-04 2004-05 2005-06 2006-07 2007-08 2008-09<br />
Oceania<br />
Australian external Territories 98 161 169 150 188 208 195 154 187 172 165<br />
New Zealand 3 281 3 852 3 980 3 861 4 382 5 711 5 926 6 041 5 691 5 647 5 317<br />
Melanesia<br />
New Caledonia 13 7 18 21 33 22 31 30 44 49 47<br />
Papua New Guinea 313 323 352 331 328 244 263 222 260 284 395<br />
Solomon Islands 31 47 48 22 29 40 38 50 69 92 69<br />
Vanuatu 89 131 135 127 114 120 138 159 157 195 217<br />
Total 446 508 553 501 504 426 470 461 530 620 728<br />
Micronesia<br />
Guam 9 6 4 8 11 20 11 31 22 13 9<br />
Kiribati 8 2 3 30 11 5 1 2 - 6 5<br />
Marshall Islands 2 - - - 1 - 2 1 1 2 8<br />
Micronesia Federated States - 1 1 3 - 3 3 7 4 4 8<br />
Nauru 22 11 10 3 3 - - - 3 2 -<br />
Palau 2 2 - - 1 3 - - 5 1 -<br />
Micronesia Nfd 1 - - - - - - - 1 - 3<br />
Total 44 22 18 44 27 31 17 41 36 28 33<br />
Polynesia (excluding Hawaii)<br />
Cook Islands 8 12 12 13 10 12 17 16 23 16 27<br />
Fiji 98 126 90 105 114 140 195 215 235 219 255<br />
French Polynesia 2 6 4 5 8 7 3 4 8 6 5<br />
Niue - 10 2 - - - - - - 1 -<br />
Samoa 27 21 31 52 36 46 40 46 67 32 26<br />
Samoa American 1 - - - - 4 - - - - 1<br />
Tonga 23 40 30 32 18 25 38 35 36 31 31<br />
Tuvalu - - 1 - 3 4 - 2 1 1 1<br />
Total 159 215 170 207 189 238 293 318 370 306 346<br />
Total 4 028 4 758 4 890 4 763 5 290 6 614 6 901 7 015 6 814 6 773 6 589<br />
Europe<br />
United Kingdom & Ireland<br />
United Kingdom 3 810 4 191 4 778 5 099 5 245 5 961 6 690 7 531 8 268 8 615 8 810<br />
Ireland 191 224 300 294 309 345 383 443 566 510 511<br />
Total 4 001 4 415 5 078 5 393 5 554 6 306 7 073 7 974 8 834 9 125 9 321<br />
Western Europe<br />
Austria 34 36 58 101 54 66 79 92 82 85 90<br />
Belgium 29 48 34 49 52 62 69 60 50 66 53<br />
France 159 191 208 239 249 257 291 299 349 405 436<br />
Germany 192 233 245 308 292 310 313 289 339 356 460<br />
Liechtenstein - - 1 - - - 2 1 - - -<br />
Luxembourg 5 4 2 6 6 3 8 7 6 15 8<br />
Monaco - 1 1 8 5 9 4 7 2 9 16<br />
Netherlands 173 155 237 281 222 226 228 261 260 273 281<br />
Switzerland 167 189 229 279 244 299 251 303 333 421 454<br />
Total 759 857 1 015 1 271 1 124 1 232 1 245 1 319 1 421 1 630 1 798
37<br />
Table 10(continued)<br />
Australia born permanent departures by region/country <strong>of</strong><br />
future residence, 1998-99 to 2008-09<br />
Financial Year<br />
Region/country<br />
<strong>of</strong> future residence<br />
1998-99 1999-00 2000-01 2001-02 2002-03 2003-04 2004-05 2005-06 2006-07 2007-08 2008-09<br />
Northern Europe<br />
Denmark 46 50 56 50 56 74 68 86 85 75 101<br />
Faroe Islands 5 1 - - 1 - - 1 - 1 1<br />
Finland 20 10 23 17 25 28 18 44 29 40 37<br />
Iceland 2 2 5 3 1 7 4 9 1 5 1<br />
Norway 40 26 33 35 47 43 52 85 83 108 143<br />
Sweden 83 91 115 115 133 131 130 128 156 197 256<br />
Total 196 180 232 220 263 283 272 353 354 426 539<br />
Southern Europe<br />
Andorra 1 - 2 2 2 - - 2 1 2 -<br />
Gibraltar 1 - 2 - 1 1 6 20 6 1 1<br />
Italy 169 154 188 184 223 191 187 193 221 206 213<br />
Malta 32 44 35 36 25 34 20 35 23 32 47<br />
Portugal 26 31 35 26 23 24 18 15 9 15 15<br />
Spain 66 85 86 88 81 109 108 131 165 138 142<br />
Total 295 314 348 336 355 359 339 396 425 394 418<br />
South Eastern Europe<br />
Albania - 1 1 - 1 3 - - 3 2 4<br />
Bosnia and Herzegovina 3 6 3 9 5 4 3 13 8 2 7<br />
Bulgaria - 2 1 6 - 4 8 3 4 11 4<br />
Croatia 25 16 34 26 34 30 29 27 36 49 19<br />
Cyprus 29 37 25 33 37 53 32 50 42 46 45<br />
Fmr Yugo Rep <strong>of</strong> Macedonia 12 18 22 15 16 18 5 12 16 8 20<br />
Greece 151 124 158 115 148 149 131 144 157 136 144<br />
Montenegro - - - - - - - - 1 1 2<br />
Romania 9 3 1 - 2 7 4 16 14 6 7<br />
Serbia - - - - - - - - 2 1 3<br />
Fmr Serbia & Montenegro 8 4 11 11 19 27 23 24 11 20 17<br />
Slovenia 7 1 3 6 4 4 2 5 11 10 17<br />
Total 244 212 259 221 266 299 238 294 305 292 289<br />
Eastern Europe<br />
Belarus - - - 1 2 - - - - - -<br />
Czech Republic 11 5 3 2 4 3 3 9 7 5 23<br />
Estonia - - - 1 1 1 - 2 4 2 9<br />
Former Czechoslovakia 1 - 9 3 2 2 8 2 2 6 9<br />
Hungary 7 6 13 8 5 9 11 18 11 25 20<br />
Latvia 2 3 2 5 2 2 4 2 9 4 1<br />
Lithuania 2 - - 1 - - - - - - -<br />
Poland 8 16 8 25 8 5 9 14 24 36 29<br />
Russian Federation 13 3 22 15 13 21 21 39 66 57 59<br />
Slovakia 1 - 1 2 2 5 - 5 1 3 8<br />
Ukraine - 1 1 6 1 4 2 1 3 1 2<br />
Total 45 34 59 69 40 52 58 92 127 139 160<br />
Total 5 540 6 012 6 991 7 510 7 602 8 531 9 225 10 428 11 466 12 006 12 525
38<br />
Table 10(continued)<br />
Australia born permanent departures by region/country <strong>of</strong><br />
future residence, 1998-99 to 2008-09<br />
Financial Year<br />
Region/country<br />
<strong>of</strong> future residence<br />
1998-99 1999-00 2000-01 2001-02 2002-03 2003-04 2004-05 2005-06 2006-07 2007-08 2008-09<br />
North Africa & the Middle East<br />
North Africa<br />
Algeria 1 1 - 1 - - 1 6 2 2 1<br />
Egypt 25 27 24 27 24 21 24 24 38 48 40<br />
Libya 2 - 1 - - 6 11 29 16 21 12<br />
Morocco - 5 6 1 3 2 - 3 3 4 5<br />
Sudan - - - 2 - 2 3 9 10 7 9<br />
Tunisia - 3 - - 3 1 3 2 - 4 1<br />
Total 28 36 31 31 30 32 42 73 69 86 68<br />
Middle East<br />
Bahrain 56 96 80 57 95 128 151 140 112 102 140<br />
Gaza Strip and West Bank - - - - - - - - 2 - -<br />
Iran - - 4 4 4 9 8 24 12 24 23<br />
Iraq - - 2 - 4 40 30 12 20 24 26<br />
Israel 80 113 102 93 106 134 115 138 168 185 157<br />
Jordan 4 13 16 14 19 20 27 18 11 10 22<br />
Kuwait 27 17 28 20 38 28 21 32 35 48 57<br />
Lebanon 82 82 92 75 86 125 125 134 123 117 149<br />
Oman 36 31 18 25 28 39 35 53 56 84 66<br />
Qatar 18 15 23 62 91 75 101 182 179 230 250<br />
Saudi Arabia 87 95 109 127 125 101 107 99 90 125 162<br />
Syria 6 2 13 10 22 10 23 17 22 32 19<br />
Turkey 30 40 43 28 42 40 61 82 61 92 91<br />
United Arab Emirates 225 287 311 431 589 727 831 1 231 1 703 2 405 3 039<br />
Yemen 3 - - - 2 1 1 - 1 1 3<br />
Middle East nfd - - - - - - - 1 1 - -<br />
Total 654 791 841 946 1 251 1 477 1 636 2 163 2 596 3 479 4 204<br />
Total 682 827 872 977 1 281 1 509 1 678 2 236 2 665 3 565 4 272<br />
Southeast Asia<br />
Brunei 101 97 99 104 71 90 120 79 79 93 82<br />
Burma 2 11 8 2 10 5 8 8 5 3 3<br />
Cambodia 6 17 17 16 32 25 40 42 41 73 73<br />
East Timor - 6 26 29 26 16 27 19 24 32 50<br />
Indonesia 244 350 427 450 474 498 508 556 590 584 668<br />
Laos 6 8 10 5 13 7 14 38 40 56 54<br />
Malaysia 228 272 282 284 310 348 399 380 384 462 545<br />
Philippines 94 105 106 153 120 133 113 130 110 147 171<br />
Singapore 771 987 1 399 1 651 1 564 1 680 1 855 2 144 2 524 2 965 3 373<br />
Thailand 187 256 297 298 364 411 537 524 635 655 681<br />
Vietnam 91 105 104 129 132 218 254 270 289 353 364<br />
Total 1 730 2 214 2 775 3 121 3 116 3 431 3 875 4 190 4 721 5 423 6 064
39<br />
Table 10(continued)<br />
Australia born permanent departures by region/country <strong>of</strong><br />
future residence, 1998-99 to 2008-09<br />
Financial Year<br />
Region/country<br />
<strong>of</strong> future residence<br />
1998-99 1999-00 2000-01 2001-02 2002-03 2003-04 2004-05 2005-06 2006-07 2007-08 2008-09<br />
Northeast Asia<br />
China (excl SARs and Taiwan) 251 385 432 527 602 723 798 1 031 1 092 1 132 1 034<br />
Hong Kong (SAR <strong>of</strong> China) 822 988 1 230 1 320 1 652 1 538 1 684 1 925 2 048 2 069 2 218<br />
Japan 275 322 469 523 581 604 594 670 728 711 643<br />
Korea 28 60 65 82 85 152 128 103 136 149 131<br />
Macau (SAR <strong>of</strong> China) 6 16 19 27 27 34 25 59 158 227 206<br />
Mongolia 1 1 1 - 4 9 - 12 15 14 7<br />
Taiwan 50 81 84 96 107 130 120 90 94 115 105<br />
Total 1 433 1 853 2 300 2 575 3 058 3 190 3 349 3 890 4 271 4 417 4 344<br />
Southern Asia<br />
Bangladesh 1 4 1 1 1 1 4 15 16 10 9<br />
Bhutan - - - - - - - - 4 - 4<br />
India 35 37 50 43 60 71 75 121 147 167 215<br />
Maldives 7 9 5 8 17 8 15 10 17 11 16<br />
Nepal 4 4 - 3 1 3 3 2 2 1 12<br />
Pakistan 8 4 11 12 4 14 9 11 14 17 13<br />
Sri Lanka 16 13 15 16 15 15 16 13 13 18 16<br />
Total 71 71 82 83 98 112 122 172 213 224 285<br />
Central Asia<br />
Afghanistan 1 - - - 3 2 12 9 9 9 18<br />
Armenia - 1 - - - 1 - - 1 4 1<br />
Azerbaijan - - 1 3 3 6 9 8 8 4 8<br />
Georgia - - - 5 - 1 - 1 1 1 -<br />
Kazakhstan 7 1 6 8 6 8 14 8 9 12 3<br />
Kyrgyzstan - - - - - - - - - 2 6<br />
Tajikistan - - - 2 - - - - - - -<br />
Turkmenistan - - - - - - - - - - 1<br />
Uzbekistan - - - - 1 1 1 - - - -<br />
Total 8 2 7 18 13 19 36 26 28 32 37<br />
Northern America<br />
Bermuda 9 5 13 5 5 12 14 8 14 14 21<br />
Canada 516 590 669 736 667 844 931 942 1 033 1 131 1 257<br />
USA 2 916 3 615 4 145 3 975 4 158 4 390 4 456 4 850 5 033 4 953 5 174<br />
Total 3 441 4 210 4 827 4 716 4 830 5 246 5 401 5 800 6 080 6 098 6 452<br />
South America, Central America & the Caribbean<br />
South America<br />
Argentina 28 22 18 16 18 24 26 21 20 27 22<br />
Bolivia 2 1 - 1 1 4 3 6 4 - 4<br />
Brazil 13 19 11 18 16 18 15 33 48 40 64<br />
Chile 39 46 41 35 40 50 42 61 66 70 76<br />
Colombia 4 4 2 8 3 5 8 5 7 11 8<br />
Ecuador 4 2 3 3 3 2 - 2 6 3 1<br />
Falkland Islands - - - 1 1 - - - 5 1 1<br />
Guyana 1 - - - - - - 1 - - -<br />
Paraguay 1 - 3 2 1 - 1 - - 1 1<br />
Peru 7 6 12 26 12 10 17 9 14 17 20<br />
Uruguay 5 1 6 - 2 6 5 8 8 5 9<br />
Venezuela 1 2 3 2 3 4 4 7 6 1 1<br />
South America nfd - - - 1 - - - - - - -<br />
Total 105 103 99 113 100 123 121 153 184 176 207
40<br />
Table 10(continued)<br />
Australia born permanent departures by region/country <strong>of</strong><br />
future residence, 1998-99 to 2008-09<br />
Financial Year<br />
Region/country<br />
<strong>of</strong> future residence<br />
1998-99 1999-00 2000-01 2001-02 2002-03 2003-04 2004-05 2005-06 2006-07 2007-08 2008-09<br />
Central America<br />
Belize - - - - - - - - - 1 2<br />
Costa Rica 1 - 1 5 1 3 1 5 - 4 4<br />
El Salvador 2 1 - 1 - 2 - - - 1 -<br />
Guatemala 1 - - 2 - 1 - - 1 - -<br />
Honduras - - - 1 2 - - - 1 - -<br />
Mexico 7 14 15 17 12 9 17 14 19 24 36<br />
Nicaragua 1 - - 1 - - 2 - 4 3 3<br />
Panama - 1 - - - - 2 1 1 3 5<br />
Total 12 16 16 27 15 15 22 20 26 36 50<br />
The Caribbean<br />
Antigua and Barbuda - 2 - 1 1 1 9 8 1 - 3<br />
Aruba - - - - 1 5 1 3 6 2 4<br />
Bahamas 14 4 2 4 2 6 3 9 10 12 10<br />
Barbados 2 - 10 3 2 2 2 2 2 3 4<br />
Cayman Islands 1 5 2 9 6 16 22 21 37 50 26<br />
Dominica - - 1 1 - 1 - 2 1 - -<br />
Dominican Republic - - 1 - 1 - - 1 - 1 3<br />
Grenada - - - - - - - - - 1 1<br />
Haiti - - - - - - - - 1 - -<br />
Jamaica 3 4 3 10 7 7 4 4 7 9 14<br />
Martinique - - 1 - - - - 1 - - -<br />
Montserrat - 2 - - - - 1 - 1 - 2<br />
Netherlands Antilles - - 1 - - 1 - - - - -<br />
St Kitts & Nevis - - 1 - - - - - - 3 -<br />
St Vincent &the Grenadines - - - - - - - - - 1 -<br />
Trinidad and Tobago 3 1 - 2 2 3 1 9 4 2 1<br />
Turks & Caicos Islands - - - - - - - 2 5 - 5<br />
Virgin Islands British - - - - - - - - 5 - -<br />
Caribbean nfd - - - - - 1 - - - - -<br />
Total 23 18 22 30 22 43 43 62 80 84 73<br />
Total 140 137 137 170 137 181 186 235 290 296 330<br />
Sub-Saharan Africa<br />
Central and West Africa<br />
Cameroon - - 2 - 1 - - - - - -<br />
Chad 3 - - - - - - - - - -<br />
Congo - - - 1 - 2 - 1 4 - 2<br />
Congo Dem Republic - - - - - 1 - - - - 1<br />
Cote D'Ivoire - - - 1 - - - - - - 1<br />
Equatorial Guinea - - - - 2 3 1 2 - - 1<br />
Gabon - - - - 1 1 1 - - 1 1<br />
Ghana 25 14 15 12 7 19 12 12 6 19 15<br />
Guinea 5 - - 6 1 1 1 3 2 4 3<br />
Liberia - - - - - - - 2 2 1 2<br />
Mali - - - - 1 2 1 4 1 1 4<br />
Mauritania - 1 - - - - 1 - 1 2 -<br />
Niger 1 - 1 - - - - - - - 2<br />
Nigeria 3 4 4 3 7 19 13 31 22 18 17<br />
Senegal 1 - - - - - - - - 1 2<br />
Sierra Leone - - - - 1 3 3 2 3 1 -<br />
Total 38 19 22 23 21 51 33 57 41 48 51
41<br />
Table 10(continued)<br />
Australia born permanent departures by region/country <strong>of</strong><br />
future residence, 1998-99 to 2008-09<br />
Financial Year<br />
Region/country<br />
<strong>of</strong> future residence<br />
1998-99 1999-00 2000-01 2001-02 2002-03 2003-04 2004-05 2005-06 2006-07 2007-08 2008-09<br />
Southern and East Africa<br />
Angola - 2 1 3 8 4 10 10 6 7 12<br />
Botswana 5 3 1 5 5 10 12 6 9 3 7<br />
Burundi - - - - - 1 - - 1 - -<br />
Djibouti - - - - 1 - - - - - -<br />
Eritrea - - - - - 3 - - 1 - -<br />
Ethiopia - 2 3 1 2 1 2 - 1 2 6<br />
Kenya 9 11 16 6 7 19 14 12 18 22 19<br />
Madagascar - - - - 1 1 1 - - 4 -<br />
Malawi - - 2 2 2 1 1 1 - 3 -<br />
Mauritius 5 9 11 11 8 22 6 14 8 16 14<br />
Mozambique 6 5 2 3 2 3 4 1 1 8 13<br />
Namibia 1 - 3 2 - 3 2 4 8 4 10<br />
Rwanda - - - - - - - - - 1 1<br />
Seychelles 4 2 3 1 3 3 6 5 9 1 10<br />
Somalia - - - - - 1 1 - - 1 -<br />
South Africa 77 69 90 116 91 121 124 130 156 138 163<br />
Swaziland - - - - - 1 - - - - -<br />
Tanzania 13 6 14 15 8 27 18 12 24 11 11<br />
Uganda 1 - 2 1 1 6 1 2 3 5 5<br />
Zambia 4 5 7 8 4 14 5 4 20 13 10<br />
Zimbabwe 7 14 11 7 9 6 8 10 10 7 7<br />
Total 132 128 166 181 152 247 215 211 275 246 288<br />
Total 170 147 188 204 173 298 248 268 316 294 339<br />
Supplementary codes (a)<br />
Oceania & Antarctica nfd - - - - - - - 1 - - -<br />
Europe & USSR nfd 6 2 1 10 4 3 - 9 8 5 2<br />
Fmr USSR 10 28 3 12 2 1 1 5 8 8 2<br />
Total 16 30 4 22 6 4 1 15 16 13<br />
Not stated 5 4 44 11 8 5 5 9 2 3 8<br />
Total all countries 17 264 20 265 23 117 24 170 25 612 29 140 31 027 34 284 36 882 39 144 41 249<br />
(a) Supplementary codes which cannot be classified to any major region in the Standard Australian Classification <strong>of</strong> Countries (SACC). This may<br />
lead to under reporting <strong>of</strong> their component countries in the rest <strong>of</strong> the table, care should be taken when interpreting the data.<br />
4
42<br />
Table 11<br />
Overseas born permanent departures by region/country <strong>of</strong><br />
future residence, 1998-99 to 2008-09<br />
Financial Year<br />
Region/country<br />
<strong>of</strong> future residence<br />
1998-99 1999-00 2000-01 2001-02 2002-03 2003-04 2004-05 2005-06 2006-07 2007-08 2008-09<br />
Oceania<br />
Australian external Territories 17 30 35 25 29 34 25 27 29 26 29<br />
New Zealand 4 187 5 109 5 677 6 163 6 951 7 974 7 846 7 874 8 226 8 513 9 035<br />
Melanesia<br />
New Caledonia 12 23 36 33 35 31 26 33 39 27 48<br />
Papua New Guinea 109 122 149 132 134 99 99 113 115 129 166<br />
Solomon Islands 12 25 10 10 9 16 30 26 18 37 34<br />
Vanuatu 42 42 34 29 27 38 51 60 59 53 72<br />
Total 175 212 229 204 205 184 206 232 231 246 320<br />
Micronesia<br />
Guam 2 2 1 4 2 5 5 8 4 8 6<br />
Kiribati 3 - 3 7 7 - 2 1 1 2 1<br />
Marshall Islands - - 1 - - - 1 1 - - 1<br />
Micronesia Federated States - - - 2 - - 1 - 1 1 3<br />
Nauru 9 5 11 3 5 - 4 - 3 3 4<br />
Palau - - - - 1 - 3 - - - -<br />
Micronesia nfd 1 - - - - - - - - - -<br />
Total 15 7 16 16 15 5 16 10 9 14 15<br />
Polynesia (excluding Hawaii)<br />
Cook Islands 18 26 19 5 26 24 32 29 35 41 27<br />
Fiji 81 85 100 89 91 150 138 189 161 180 165<br />
French Polynesia 4 2 6 6 3 7 10 7 7 7 9<br />
Niue 1 1 1 1 - 1 1 1 - - 1<br />
Samoa 61 33 57 49 77 72 114 128 137 129 130<br />
Tokelau - 2 3 - - - - 1 - 6 2<br />
Tonga 31 52 33 38 39 74 76 82 101 97 93<br />
Tuvalu - - - - 2 - 1 - - - -<br />
Wallis and Futuna - - - - - - 1 - - - -<br />
Polynesia (excl Hawaii) nec - - - 2 - - - - 1 1 1<br />
Total 196 201 219 190 238 328 373 437 442 461 428<br />
Total 4 590 5 559 6 176 6 598 7 438 8 525 8 466 8 580 8 937 9 260 9 827<br />
EUROPE<br />
United Kingdom & Ireland<br />
United Kingdom 2 979 3 275 3 076 3 174 3 163 3 797 3 888 4 509 4 840 5 086 4 937<br />
Ireland 266 342 352 323 278 310 327 391 405 451 391<br />
Total 3 245 3 617 3 428 3 497 3 441 4 107 4 215 4 900 5 245 5 537 5 328
43<br />
Table 11(continued)<br />
Overseas born permanent departures by region/country <strong>of</strong><br />
future residence, 1998-99 to 2008-09<br />
Region/country<br />
<strong>of</strong> future residence<br />
1998-99 1999-00 2000-01 2001-02 2002-03 2003-04 2004-05 2005-06 2006-07 2007-08 2008-09<br />
Western Europe<br />
Austria 46 86 83 359 83 111 135 133 126 146 142<br />
Belgium 15 26 40 31 44 48 32 42 46 35 34<br />
France 137 150 174 154 192 182 238 293 263 286 274<br />
Germany 155 195 242 230 230 225 240 240 297 351 349<br />
Liechtenstein - - - - - - 4 2 - - -<br />
Luxembourg 2 4 7 4 2 2 3 7 8 11 7<br />
Monaco - 1 2 2 - 7 - 4 - 3 1<br />
Netherlands 141 119 147 155 154 150 127 157 166 167 211<br />
Switzerland 115 179 183 172 213 208 169 178 266 295 298<br />
Total 611 760 878 1 107 918 933 948 1 056 1 172 1 294 1 316<br />
Northern Europe<br />
Denmark 59 37 52 41 51 48 38 64 64 49 76<br />
Faroe Islands - - - - 2 - - - - - 2<br />
Finland 18 13 21 23 38 23 28 31 30 30 34<br />
Iceland 3 1 1 1 - 1 - 4 1 2 -<br />
Norway 32 15 18 22 34 31 49 39 54 53 53<br />
Sweden 50 70 57 95 77 77 83 93 111 123 139<br />
Total 162 136 149 182 202 180 198 231 260 257 304<br />
Southern Europe<br />
Andorra - 1 1 - - - - 1 - - 1<br />
Gibraltar - 1 2 - 1 - 3 3 - - 1<br />
Italy 184 208 184 169 178 164 160 202 174 195 166<br />
Malta 76 61 59 50 55 52 46 45 39 42 59<br />
Portugal 84 120 86 89 69 61 55 40 50 36 51<br />
Spain 117 133 120 107 107 123 126 118 155 136 118<br />
Total 461 524 452 415 410 400 390 409 418 409 396<br />
South Eastern Europe<br />
Albania - 3 3 2 3 8 3 8 7 5 9<br />
Bosnia and Herzegovina 16 20 27 25 36 31 29 36 35 35 34<br />
Bulgaria 2 2 3 5 2 14 5 4 9 9 7<br />
Croatia 140 114 105 104 124 130 131 128 131 152 106<br />
Cyprus 61 75 44 72 59 75 53 68 81 87 74<br />
Fmr Yugo Rep <strong>of</strong> Macedonia 41 85 67 47 82 71 68 53 67 44 64<br />
Greece 246 228 253 187 200 207 201 200 197 217 225<br />
Moldova 1 - 1 - - 4 - 1 - 1 -<br />
Montenegro - - - - - - - - 4 2 1<br />
Romania 20 9 6 13 23 9 8 14 14 20 17<br />
Serbia - - - - - - - - - 6 25<br />
Fmr Serbia & Montenegro 40 45 82 79 78 127 122 109 99 103 86<br />
Slovenia 15 5 14 16 23 15 11 13 7 26 16<br />
Total 582 586 605 550 630 691 631 634 651 707 664
44<br />
Table 11(continued)<br />
Overseas born permanent departures by region/country <strong>of</strong><br />
future residence, 1998-99 to 2008-09<br />
Region/country<br />
<strong>of</strong> future residence<br />
1998-99 1999-00 2000-01 2001-02 2002-03 2003-04 2004-05 2005-06 2006-07 2007-08 2008-09<br />
Eastern Europe<br />
Belarus 1 - - - 4 - 2 1 - 1 -<br />
Czech Republic 10 5 1 9 8 9 8 15 14 14 28<br />
Estonia 2 - 3 5 1 4 3 1 1 8 2<br />
Former Czechoslovakia 5 7 12 13 7 14 14 10 13 13 10<br />
Hungary 37 40 46 36 48 42 42 37 31 41 50<br />
Latvia 3 4 1 4 3 1 5 1 9 2 -<br />
Lithuania 2 3 - 4 1 3 2 - 4 4 3<br />
Poland 71 48 55 61 53 59 58 74 78 89 82<br />
Russian Federation 4 5 14 10 14 27 35 36 38 38 49<br />
Slovakia 2 2 2 2 5 9 8 8 5 9 11<br />
Ukraine 4 1 6 11 3 8 5 10 19 11 13<br />
Total 141 115 140 155 147 176 182 193 212 230 248<br />
Total 5 202 5 738 5 652 5 906 5 748 6 487 6 564 7 423 7 958 8 434 8 256<br />
North Africa & the Middle East<br />
North Africa<br />
Algeria - - 1 - - - - 8 4 3 3<br />
Egypt 37 72 59 45 36 51 43 62 66 64 90<br />
Libya 1 - 1 - - 7 12 11 5 2 4<br />
Morocco - 2 - 2 1 2 1 5 2 3 1<br />
Sudan 2 6 1 4 4 10 14 13 6 29 20<br />
Tunisia - 2 - - - - 2 1 2 - 1<br />
Western Sahara - - - - - - - - 1 - -<br />
Total 40 82 62 51 41 70 72 100 86 101 119<br />
Middle East<br />
Bahrain 19 19 20 35 31 56 87 107 72 43 79<br />
Gaza Strip & West Bank - - - 1 - - - - 1 - -<br />
Iran 15 7 26 26 37 46 53 75 71 75 108<br />
Iraq 7 16 2 6 7 71 36 34 31 31 61<br />
Israel 70 83 73 88 88 122 122 146 168 181 178<br />
Jordan 10 27 24 14 24 26 42 28 25 35 40<br />
Kuwait 12 4 24 11 9 22 28 32 43 33 60<br />
Lebanon 175 175 170 140 150 214 223 252 263 228 285<br />
Oman 13 20 13 30 17 24 10 27 24 22 34<br />
Qatar 12 14 18 17 42 17 47 65 63 83 103<br />
Saudi Arabia 50 36 86 68 54 52 39 46 54 78 67<br />
Syria 16 9 28 24 38 51 50 65 55 66 52<br />
Turkey 57 67 73 49 62 104 95 123 115 122 141<br />
United Arab Emirates 96 124 143 161 270 353 445 523 730 1 014 1 273<br />
Yemen - 1 - - 2 - - - 2 1 4<br />
Middle East nfd - - 1 1 1 2 - - - 1 1<br />
Total 552 602 701 671 832 1 160 1 277 1 523 1 717 2 013 2 486<br />
Total 592 684 763 722 873 1 230 1 349 1 623 1 803 2 114 2 605
45<br />
Table 11(continued)<br />
Overseas born permanent departures by region/country <strong>of</strong><br />
future residence, 1998-99 to 2008-09<br />
Region/country<br />
<strong>of</strong> future residence<br />
1998-99 1999-00 2000-01 2001-02 2002-03 2003-04 2004-05 2005-06 2006-07 2007-08 2008-09<br />
Southeast Asia<br />
Brunei 45 22 39 44 39 63 63 58 82 116 65<br />
Burma - 2 10 6 5 1 2 4 5 5 8<br />
Cambodia 22 25 29 31 26 63 48 64 50 76 78<br />
East Timor - 2 28 21 18 24 17 21 22 20 30<br />
Indonesia 364 492 523 608 619 794 779 645 659 632 704<br />
Laos 11 11 16 5 7 10 19 24 39 22 22<br />
Malaysia 185 211 260 250 277 444 426 419 382 472 562<br />
Philippines 115 139 151 123 151 178 211 208 171 246 259<br />
Singapore 482 574 926 1 158 967 1 196 1 367 1 456 1 611 1 936 2 058<br />
Thailand 202 224 243 294 320 424 500 493 616 709 793<br />
Vietnam 270 268 336 368 370 682 782 772 856 978 807<br />
Southeast Asia nfd - - - - - - - - - 1 -<br />
Total 1 696 1 970 2 561 2 908 2 799 3 879 4 214 4 164 4 493 5 213 5 386<br />
Northeast Asia<br />
China (excl SARs) 829 1 136 1 445 1 506 1 448 2 266 2 699 2 921 3 012 3 283 3 673<br />
Hong Kong (SAR <strong>of</strong> China) 2 023 2 358 2 712 2 508 2 582 2 882 3 166 3 454 3 387 3 474 3 680<br />
Japan 197 200 375 406 347 467 551 529 610 596 574<br />
Korea 185 181 238 293 297 390 502 440 545 537 554<br />
Macau (SAR <strong>of</strong> China) 9 14 19 23 30 34 31 27 51 170 192<br />
Mongolia - - - - 5 8 - 2 6 3 2<br />
Taiwan 503 643 645 669 708 874 850 867 831 868 797<br />
Northeast Asia nfd - - - 1 - - - - - - -<br />
Total 3 746 4 532 5 434 5 406 5 417 6 921 7 799 8 240 8 442 8 931 9 472<br />
Southern Asia<br />
Bangladesh 10 6 11 10 5 5 5 15 9 18 29<br />
Bhutan - - - - - - 1 1 - - -<br />
India 46 54 65 81 53 94 122 144 209 271 281<br />
Maldives 2 1 - 6 5 5 - 8 3 2 1<br />
Nepal - 2 - 1 1 - 1 - 4 3 9<br />
Pakistan 13 8 12 14 13 24 24 39 40 28 40<br />
Sri Lanka 19 42 21 24 18 39 37 31 40 38 55<br />
Total 90 113 109 136 95 167 190 238 305 360 415<br />
Central Asia<br />
Afghanistan - - - - 8 6 8 7 12 8 16<br />
Armenia - 1 - - 2 - 3 - 1 1 2<br />
Azerbaijan 1 - 2 - - 1 3 3 5 - 1<br />
Georgia - 1 - - - 1 1 - - 1 -<br />
Kazakhstan 5 - - 3 3 1 6 9 6 3 12<br />
Kyrgyzstan - - - - 1 - 1 - - 1 -<br />
Turkmenistan - - - - - - - - - 1 -<br />
Uzebekistan - - - - - - - - - - 1<br />
Total 6 2 2 3 14 9 22 19 24 15 32<br />
Northern America<br />
Bermuda 4 2 5 2 4 3 10 1 8 10 10<br />
Canada 329 363 378 470 439 518 565 569 559 627 700<br />
USA 1 329 1 463 1 819 1 551 1 673 1 746 1 884 2 137 2 145 2 207 2 326<br />
Total 1 662 1 828 2 202 2 023 2 116 2 267 2 459 2 707 2 712 2 844 3 036
46<br />
Table 11(continued)<br />
Overseas born permanent departures by region/country <strong>of</strong><br />
future residence, 1998-99 to 2008-09<br />
Region/country<br />
<strong>of</strong> future residence<br />
1998-99 1999-00 2000-01 2001-02 2002-03 2003-04 2004-05 2005-06 2006-07 2007-08 2008-09<br />
South America, Central America & the Caribbean<br />
South America<br />
Argentina 30 44 17 17 13 40 39 54 43 59 45<br />
Bolivia 1 4 2 1 1 3 2 1 1 3 -<br />
Brazil 26 23 16 30 34 22 34 34 39 32 53<br />
Chile 69 63 36 56 45 83 88 91 87 107 123<br />
Colombia 6 7 - 8 5 3 14 15 8 10 25<br />
Ecuador 3 - - 3 2 6 - 4 2 8 6<br />
Falkland Islands - 1 - - - - - - - - -<br />
Paraguay 2 1 - - - - - 2 - - -<br />
Peru 6 7 8 11 12 9 8 15 10 13 15<br />
Suriname - - 1 - - - - - - - 1<br />
Uruguay 20 20 22 8 14 22 19 38 23 26 32<br />
Venezuela - 4 2 1 4 - 1 5 4 4 3<br />
South America nfd - - - - 1 - - 1 1 - 1<br />
Total 163 174 104 135 131 188 205 260 218 262 304<br />
Central America<br />
Belize - - - - - - - - - - 2<br />
Costa Rica - - 1 4 1 3 1 7 1 3 -<br />
El Salvador 6 6 5 2 3 2 5 3 4 4 5<br />
Guatemala 2 1 1 - 2 - - - - 2 -<br />
Honduras - - - - - - - - - 1 1<br />
Mexico 3 9 7 12 7 12 11 11 12 20 19<br />
Nicaragua 1 - - 4 - - 2 3 1 1 -<br />
Panama 1 - 1 - - - 1 2 - 2 1<br />
Central America nfd - - - - - - - - 1 - -<br />
Total 13 16 15 22 13 17 20 26 19 33 28<br />
The Caribbean<br />
Antigua and Barbuda - - - - 1 - - - - - -<br />
Aruba - - - - - - - 1 - - -<br />
Bahamas - - 2 - 1 - - 1 2 6 3<br />
Barbados - 2 5 1 - - 1 4 2 2 -<br />
Cayman Islands 2 - - 5 2 2 1 6 8 15 13<br />
Dominica 1 1 - - - - - 1 - - -<br />
Dominican Republic - - - - - - - - - - 1<br />
Grenada - - - - - - 1 1 - 3 1<br />
Jamaica 5 4 2 2 4 10 2 - 3 3 2<br />
Martinique - - - - - 1 - - - - -<br />
Montserrat - 1 - - - - - 2 - 4 -<br />
Netherlands Antilles 1 - - - - - - - - - -
47<br />
Table 11(continued)<br />
Overseas born permanent departures by region/country <strong>of</strong><br />
future residence, 1998-99 to 2008-09<br />
Region/country<br />
<strong>of</strong> future residence<br />
1998-99 1999-00 2000-01 2001-02 2002-03 2003-04 2004-05 2005-06 2006-07 2007-08 2008-09<br />
The Caribbean (continued)<br />
St Kitts and Nevis - - - - - - - - - - 4<br />
Trinidad and Tobago 3 3 5 - 2 6 2 4 3 2 6<br />
Turks and Caicos Islands - - - - - - - 1 - - -<br />
Virgin Islands British 1 - - - - - - - 1 3 -<br />
Total 13 11 14 8 10 19 7 21 19 38 30<br />
Total 189 201 133 165 154 224 232 307 256 333 362<br />
Sub-Saharan Africa<br />
Central and West Africa<br />
Cameroon - - - - - - - - - 3 -<br />
Cape Verde - - - - - - 1 - - - -<br />
Chad 2 - - - - - - 1 - - -<br />
Congo - - - 2 - - - - 1 - 8<br />
Congo Dem Republic - - - - - 1 - - - 1 1<br />
Equatorial Guinea - - - - - 2 2 - 2 - 1<br />
Gabon - - - - - - 2 - - 2 -<br />
Gambia - - - 2 - - - - - - 1<br />
Ghana 6 10 9 6 4 4 6 12 9 5 8<br />
Guinea 1 - - - - - 1 - 1 1 2<br />
Liberia - - - - - - 1 - - - -<br />
Mali 1 - 1 - 4 - - - - - 2<br />
Mauritania 1 - 2 1 1 - 3 2 2 - 1<br />
Niger - - 4 - - - - - - - 1<br />
Nigeria 5 2 10 8 - 12 17 13 15 9 16<br />
Senegal - 1 - - 1 - - - - 2 2<br />
Togo - - - - - 1 - - - - -<br />
Total 16 13 26 19 10 20 33 28 30 23 43<br />
Southern and East Africa<br />
Angola 1 1 - 1 5 7 2 5 5 1 12<br />
Botswana 2 4 1 5 - 3 7 3 7 4 5<br />
Djibouti - - - - 1 - 2 - - - -<br />
Eritrea - - - - - 1 - - - - 2<br />
Ethiopia 1 4 - 4 1 1 4 - 4 2 5<br />
Kenya 11 9 6 7 8 6 14 19 14 16 29<br />
Lesotho - 3 - - - - - - - - -<br />
Madagascar 1 - - - - - - - - - 1<br />
Malawi - 1 - - 2 - 2 2 - 1 -
48<br />
Table 11(continued)<br />
Overseas born permanent departures by region/country <strong>of</strong><br />
future residence, 1998-99 to 2008-09<br />
Region/country<br />
<strong>of</strong> future residence<br />
1998-99 1999-00 2000-01 2001-02 2002-03 2003-04 2004-05 2005-06 2006-07 2007-08 2008-09<br />
Southern and East Africa (continued)<br />
Mauritius 17 13 10 13 6 25 21 11 23 22 24<br />
Mozambique 1 - 2 1 - 1 4 1 - 8 -<br />
Namibia - - 1 3 - 4 - 4 7 2 1<br />
Reunion - - - - - - 1 1 2 1 -<br />
Rwanda - - - - - 1 - - - 1 -<br />
Seychelles 10 8 5 6 5 3 9 6 3 5 11<br />
Somalia 3 - 1 8 1 1 2 3 2 1 6<br />
South Africa 63 88 100 106 140 141 154 153 166 153 196<br />
Swaziland - - - - - - - - 1 - -<br />
Tanzania 4 11 3 4 6 2 7 6 4 7 8<br />
Uganda - 1 1 - 1 - 2 4 - 2 6<br />
Zambia 1 2 3 4 - 2 2 5 11 6 9<br />
Zimbabwe 3 8 2 4 3 5 9 9 4 11 11<br />
Total 118 153 135 166 179 203 242 232 253 243 326<br />
Total 134 166 161 185 189 223 275 260 283 266 369<br />
Supplementary codes (a)<br />
Europe & USSR nfd 4 1 6 5 2 1 7 4 4 4 3<br />
Fmr USSR 5 12 4 7 - 2 1 2 2 3 2<br />
Total 9 13 10 12 2 3 8 6 6 7 5<br />
Not stated 1 7 201 7 6 3 1 2 2 2 4<br />
Total all countries 17 917 20 813 23 404 24 071 24 851 29 938 31 579 33 569 35 221 37 779 39 769<br />
(a) Supplementary codes which cannot be classified to any major region in the Standard Australian Classification <strong>of</strong> Countries (SACC). This may<br />
lead to under reporting <strong>of</strong> their component countries in the rest <strong>of</strong> the table, care should be taken when interpreting the data.
49<br />
Table 12 Permanent departures by occupation and sex, 2008-09<br />
Australia-Born Departures<br />
Male Female Persons<br />
No % No % No %<br />
Managers & Administrators 3 366 15.8 1 841 9.2 5 207 12.6<br />
Pr<strong>of</strong>essionals 6 631 31.2 5 759 28.8 12 390 30.0<br />
Associate Pr<strong>of</strong>essionals 1 658 7.8 1 075 5.4 2 733 6.6<br />
Tradespersons 1 120 5.3 254 1.3 1 374 3.3<br />
Advanced Clerical & Service 301 1.4 1 006 5.0 1 307 3.2<br />
Intermediate Clerical, Sales & Service 1 433 6.7 1 992 10.0 3 425 8.3<br />
Intermediate Production & Transport 258 1.2 23 0.1 281 0.7<br />
Elementary Clerical, Sales & Service 137 0.6 159 0.8 296 0.7<br />
Labourers & Related Workers 130 0.6 36 0.2 166 0.4<br />
Inadequately Described 1 126 5.3 957 4.8 2 083 5.0<br />
Sub-Total Employed 16 160 76.0 13 102 65.6 29 262 70.9<br />
Not in Employment 57 0.3 101 0.5 158 0.4<br />
Not in Labour Force 4 902 23.0 6 419 32.1 11 321 27.4<br />
Not Stated/Inadequately Described 155 0.7 353 1.8 508 1.2<br />
Total 21 274 100.0 19 975 100.0 41 249 100.0<br />
Overseas-Born Departures<br />
Male Female Persons<br />
No % No % No %<br />
Managers & Administrators 2 303 11.5 1 200 6.1 3 503 8.8<br />
Pr<strong>of</strong>essionals 4 591 22.9 3 875 19.7 8 466 21.3<br />
Associate Pr<strong>of</strong>essionals 2 145 10.7 1 185 6.0 3 330 8.4<br />
Tradespersons 1 427 7.1 296 1.5 1 723 4.3<br />
Advanced Clerical & Service 149 0.7 450 2.3 599 1.5<br />
Intermediate Clerical, Sales & Service 1 051 5.2 1 860 9.4 2 911 7.3<br />
Intermediate Production & Transport 666 3.3 64 0.3 730 1.8<br />
Elementary Clerical, Sales & Service 145 0.7 238 1.2 383 1.0<br />
Labourers & Related Workers 443 2.2 199 1.0 642 1.6<br />
Inadequately Described 1 275 6.4 1 035 5.3 2 310 5.8<br />
Sub-Total Employed 14 195 70.8 10 402 52.8 24 597 61.8<br />
Not in Employment 179 0.9 231 1.2 410 1.0<br />
Not in Labour Force 5 171 25.8 8 251 41.9 13 422 33.7<br />
Not Stated/Inadequately Described 513 2.6 827 4.2 1 340 3.4<br />
Total 20 058 100.0 19 711 100.0 39 769 100.0<br />
Total Departures<br />
Male Female Persons<br />
No % No % No %<br />
Managers & Administrators 5 669 13.7 3 041 7.7 8 710 10.8<br />
Pr<strong>of</strong>essionals 11 222 27.2 9 634 24.3 20 856 25.7<br />
Associate Pr<strong>of</strong>essionals 3 803 9.2 2 260 5.7 6 063 7.5<br />
Tradespersons 2 547 6.2 550 1.4 3 097 3.8<br />
Advanced Clerical & Service 450 1.1 1 456 3.7 1 906 2.4<br />
Intermediate Clerical, Sales & Service 2 484 6.0 3 852 9.7 6 336 7.8<br />
Intermediate Production & Transport 924 2.2 87 0.2 1 011 1.2<br />
Elementary Clerical, Sales & Service 282 0.7 397 1.0 679 0.8<br />
Labourers & Related Workers 573 1.4 235 0.6 808 1.0<br />
Inadequately Described 2 401 5.8 1 992 5.0 4 393 5.4<br />
Sub-Total Employed 30 355 73.4 23 504 59.2 53 859 66.5<br />
Not in Employment 236 0.6 332 0.8 568 0.7<br />
Not in Labour Force 10 073 24.4 14 670 37.0 24 743 30.5<br />
Not Stated/Inadequately Described 668 1.6 1 180 3.0 1 848 2.3<br />
Total 41 332 100.0 39 686 100.0 81 018 100.0
50<br />
Table 13 Long term departures by occupation and sex, 2008-09<br />
Long Term Resident Departures<br />
Male Female Persons<br />
No % No % No %<br />
Managers & Administrators 4 949 11.5 3 104 7.4 8 053 9.5<br />
Pr<strong>of</strong>essionals 14 732 34.3 14 641 34.9 29 373 34.6<br />
Associate Pr<strong>of</strong>essionals 3 455 8.1 2 192 5.2 5 647 6.7<br />
Tradespersons 2 880 6.7 473 1.1 3 353 4.0<br />
Advanced Clerical & Service 391 0.9 1 388 3.3 1 779 2.1<br />
Intermediate Clerical, Sales & Service 3 082 7.2 4 475 10.7 7 557 8.9<br />
Intermediate Production & Transport 618 1.4 45 0.1 663 0.8<br />
Elementary Clerical, Sales & Service 296 0.7 382 0.9 678 0.8<br />
Labourers & Related Workers 426 1.0 93 0.2 519 0.6<br />
Inadequately Described 2 231 5.2 1 978 4.7 4 209 5.0<br />
Sub-Total Employed 33 060 77.0 28 771 68.7 61 831 72.9<br />
Not in Employment 162 0.4 216 0.5 378 0.4<br />
Not in Labour Force 9 316 21.7 12 275 29.3 21 591 25.5<br />
Not Stated 370 0.9 640 1.5 1 010 1.2<br />
Total 42 908 100.0 41 902 100.0 84 810 100.0<br />
Long Term Visitor Departures<br />
Male Female Persons<br />
No % No % No %<br />
Managers & Administrators 2 824 3.2 2 647 3.7 5 471 3.4<br />
Pr<strong>of</strong>essionals 12 999 14.7 12 520 17.4 25 519 15.9<br />
Associate Pr<strong>of</strong>essionals 5 673 6.4 3 769 5.2 9 442 5.9<br />
Tradespersons 7 982 9.0 2 486 3.5 10 468 6.5<br />
Advanced Clerical & Service 188 0.2 552 0.8 740 0.5<br />
Intermediate Clerical, Sales & Service 2 361 2.7 4 219 5.9 6 580 4.1<br />
Intermediate Production & Transport 1 637 1.9 129 0.2 1 766 1.1<br />
Elementary Clerical, Sales & Service 496 0.6 653 0.9 1 149 0.7<br />
Labourers & Related Workers 1 273 1.4 546 0.8 1 819 1.1<br />
Inadequately Described 2 904 3.3 2 225 3.1 5 129 3.2<br />
Sub-Total Employed 38 337 43.4 29 746 41.3 68 083 42.5<br />
Not in Employment 523 0.6 545 0.8 1 068 0.7<br />
Not in Labour Force 45 280 51.3 37 745 52.4 83 025 51.8<br />
Not Stated 4 159 4.7 4 012 5.6 8 171 5.1<br />
Total 88 299 100.0 72 048 100.0 160 347 100.0<br />
Total Departures<br />
Male Female Persons<br />
No % No % No %<br />
Managers & Administrators 7 773 5.9 5 751 5.0 13 524 5.5<br />
Pr<strong>of</strong>essionals 27 731 21.1 27 161 23.8 54 892 22.4<br />
Associate Pr<strong>of</strong>essionals 9 128 7.0 5 961 5.2 15 089 6.2<br />
Tradespersons 10 862 8.3 2 959 2.6 13 821 5.6<br />
Advanced Clerical & Service 579 0.4 1 940 1.7 2 519 1.0<br />
Intermediate Clerical, Sales & Service 5 443 4.1 8 694 7.6 14 137 5.8<br />
Intermediate Production & Transport 2 255 1.7 174 0.2 2 429 1.0<br />
Elementary Clerical, Sales & Service 792 0.6 1 035 0.9 1 827 0.7<br />
Labourers & Related Workers 1 699 1.3 639 0.6 2 338 1.0<br />
Inadequately Described 5 135 3.9 4 203 3.7 9 338 3.8<br />
Sub-Total Employed 71 397 54.4 58 517 51.4 129 914 53.0<br />
Not in Employment 685 0.5 761 0.7 1 446 0.6<br />
Not in Labour Force 54 596 41.6 50 020 43.9 104 616 42.7<br />
Not Stated 4 529 3.5 4 652 4.1 9 181 3.7<br />
Total 131 207 100.0 113 950 100.0 245 157 100.0
51<br />
Table 14 Permanent departures by age and state <strong>of</strong> residence, 2008-09<br />
State <strong>of</strong> residence<br />
Age group<br />
(years)<br />
New<br />
South<br />
Wales Victoria Queensland<br />
South<br />
Australia<br />
Western<br />
Australia<br />
Tasmania<br />
Australia born departures<br />
Northern<br />
Territory<br />
Australian<br />
Capital<br />
Territory<br />
Australia<br />
(a)<br />
0-4 1 600 734 692 146 398 24 28 54 3 676<br />
5-14 1 663 855 769 147 400 26 34 65 3 959<br />
15-24 1 016 582 742 158 330 44 19 65 2 956<br />
25-34 4 842 3 037 2 528 695 1 224 170 50 246 12 793<br />
35-44 3 987 2 494 1 932 485 889 88 66 148 10 089<br />
45-54 1 848 1 204 1 066 270 508 63 20 79 5 058<br />
55-64 771 436 587 111 187 31 10 47 2 180<br />
65+ 202 92 157 26 41 8 4 8<br />
538<br />
Total 15 929 9 434 8 473 2 038 3 977 454 231 712 41 249<br />
Overseas born departures<br />
0-4 857 513 609 120 246 19 14 24 2 402<br />
5-14 1 088 613 800 152 370 30 20 36 3 109<br />
15-24 1 388 693 1 109 92 518 26 15 52 3 893<br />
25-34 3 861 1 939 1 675 243 954 36 31 99 8 839<br />
35-44 3 931 1 488 1 519 307 939 52 45 110 8 391<br />
45-54 3 395 1 252 1 260 212 767 36 27 94 7 043<br />
55-64 1 673 697 734 113 462 19 28 51 3 777<br />
65+ 985 447 502 101 230 16 9 25 2 315<br />
Total 17 178 7 642 8 208 1 340 4 486 234 189 491 39 769<br />
Total<br />
0-4 2 457 1 247 1 301 266 644 43 42 78 6 078<br />
5-14 2 751 1 468 1 569 299 770 56 54 101 7 068<br />
15-24 2 404 1 275 1 851 250 848 70 34 117 6 849<br />
25-34 8 703 4 976 4 203 938 2 178 206 81 345 21 632<br />
35-44 7 918 3 982 3 451 792 1 828 140 111 258 18 480<br />
45-54 5 243 2 456 2 326 482 1 275 99 47 173 12 101<br />
55-64 2 444 1 133 1 321 224 649 50 38 98 5 957<br />
65+ 1 187 539 659 127 271 24 13 33 2 853<br />
Total 33 107 17 076 16 681 3 378 8 463 688 420 1 203 81 018<br />
(a) Includes Not stated and external Territories.
52<br />
Table 15 Permanent departures by top 20 countries <strong>of</strong> birth 2008-09<br />
Financial Year<br />
Birthplace 2008-09<br />
Australia (includes external territories) 41 249<br />
New Zealand 8 003<br />
United Kingdom 6 160<br />
China (excludes SARs and Taiwan) 4 999<br />
Hong Kong (SAR <strong>of</strong> China) 2 196<br />
Vietnam 1 220<br />
United States <strong>of</strong> America 1 160<br />
Taiwan 942<br />
Malaysia 824<br />
India 730<br />
Korea 667<br />
Indonesia 644<br />
South Africa 635<br />
Singapore 587<br />
Thailand 560<br />
Canada 496<br />
Philippines 483<br />
Germany 479<br />
Japan 459<br />
Lebanon 452<br />
Other 8 073<br />
Total 81 018<br />
Table 16<br />
Permanent departures by top 20 countries <strong>of</strong> future residence<br />
2008-09<br />
Financial Year<br />
Country <strong>of</strong> future residence 2008-09<br />
New Zealand 14 352<br />
United Kingdom 13 747<br />
United States <strong>of</strong> America 7 500<br />
Hong Kong (SAR <strong>of</strong> China) 5 898<br />
Singapore 5 431<br />
China (excludes SARs and Taiwan) 4 707<br />
United Arab Emirates 4 312<br />
Canada 1 957<br />
Thailand 1 474<br />
Indonesia 1 372<br />
Japan 1 217<br />
Vietnam 1 171<br />
Malaysia 1 107<br />
Ireland 902<br />
Taiwan 902<br />
Germany 809<br />
Switzerland 752<br />
France 710<br />
Korea, Republic <strong>of</strong> (South) 685<br />
Papua New Guinea 561<br />
Other 11 452<br />
Total 81 018
53<br />
Explanatory notes<br />
Introduction<br />
This report presents an analysis <strong>of</strong> permanent<br />
departures from Australia. Statistics <strong>of</strong> persons<br />
departing from and arriving in Australia are based<br />
on information from Incoming and Outgoing<br />
Passenger cards supplied by passengers to the<br />
<strong>Department</strong> <strong>of</strong> <strong>Immigration</strong> and <strong>Citizenship</strong> (DIAC)<br />
on arrival in and departure from Australia and<br />
supplemented from passenger and visa<br />
information systems.<br />
Definitions<br />
Permanent departures - Residents departing<br />
permanently.<br />
Settlers/permanent arrivals - Persons arriving<br />
in Australia who hold migrant visas, regardless<br />
<strong>of</strong> stated intended period <strong>of</strong> stay, New Zealand<br />
citizens who indicate an intention to settle, and<br />
those who are otherwise eligible to settle (for<br />
example, overseas-born children <strong>of</strong> Australian<br />
citizens).<br />
Long term movement - Temporary visa<br />
holders arriving and residents departing<br />
temporarily with the intention to stay in<br />
Australia or abroad for twelve months or more,<br />
and the departure <strong>of</strong> temporary visa holders<br />
and the return <strong>of</strong> residents who had stayed in<br />
Australia or abroad for twelve months or more.<br />
Occupation<br />
This data item describes a traveller’s stated usual<br />
occupation prior to arrival in Australia and does<br />
not necessarily reflect occupation in Australia.<br />
Statistics showing settler arrivals by occupation<br />
have been classified using the Australian<br />
Standard Classification <strong>of</strong> Occupations (ASCO)<br />
Second Edition, which has replaced the First<br />
Edition from 1 July 1997.<br />
In the second edition, the number <strong>of</strong> major groups<br />
has increased from eight to nine. Because <strong>of</strong> this,<br />
comparisons between current and previous time<br />
periods cannot be shown.<br />
The major groups are:<br />
Managers and Administrators<br />
Pr<strong>of</strong>essionals<br />
Associate Pr<strong>of</strong>essionals<br />
Tradespersons and Related Workers<br />
Advanced Clerical and Service (Workers)<br />
Intermediate Clerical, Sales and Service<br />
Intermediate Production and Transport<br />
Elementary Clerical, Sales and Service<br />
Labourers and Related Workers<br />
The tables in this publication include a number <strong>of</strong><br />
categories which are not strictly ‘occupation<br />
groups’ for example 'Not in Employment', 'Not in<br />
the Labour Force', and 'Not Stated'. 'Not in<br />
Employment' refers to persons who have stated<br />
that they have been unemployed without providing<br />
an adequate occupation description. 'Not in the<br />
Labour Force' includes children, persons stating<br />
‘home duties’ as their occupation, students and<br />
retired persons. 'Not Stated' refers to those<br />
persons whose occupation description is not<br />
sufficiently specific to enable the allocation <strong>of</strong><br />
precise ASCO codes.<br />
For further information about ASCO, and for<br />
copies <strong>of</strong> the classification, please contact the<br />
Australian Bureau <strong>of</strong> Statistics.<br />
Classification <strong>of</strong> countries and regions<br />
Statistics in this publication are classified to<br />
regions and countries based on the ABS Standard<br />
Australian Classification <strong>of</strong> Countries (SACC). The<br />
classification is based on the concept <strong>of</strong><br />
geographic proximity. It groups neighbouring<br />
countries into broad geographic areas on the<br />
basis <strong>of</strong> their similarity in terms <strong>of</strong> social, cultural,<br />
economic and political characteristics.<br />
The country classification used in this report is<br />
listed on page 55. In the tables in this publication<br />
some minor groups have been combined due to<br />
space limitations. For further information about<br />
SACC and for copies <strong>of</strong> the classification please<br />
contact the ABS.<br />
Australia and External Territories<br />
Following amendments to Section 17(a) <strong>of</strong> the<br />
Acts Interpretation Act 1901 - 1973 effective 1 July<br />
1992, the territories <strong>of</strong> Christmas Island and<br />
Cocos (Keeling) Islands now form part <strong>of</strong><br />
geographic Australia. The Jervis Bay Territory has<br />
always been a territory in its own right, and<br />
following self-government for the ACT it is no<br />
longer included with the ACT for statistical<br />
purposes. These three territories are classified as<br />
the ninth state/territory <strong>of</strong> Australia.<br />
Australian External Territories comprises the<br />
statistical units <strong>of</strong> Norfolk Island and Other<br />
Australian External Territories.<br />
Former Yugoslavia<br />
Separate data for the federation <strong>of</strong> Serbia and<br />
Montenegro has been available since July 1998,
54<br />
Montenegro declared its independence on 3 June<br />
2006. Prior to July 1998 the Former Yugoslavia<br />
nfd component was a substantial proportion <strong>of</strong><br />
total Former Yugoslavia. Consequently the<br />
separate figures for the individual countries were<br />
likely to be significantly understated.<br />
Former USSR<br />
The separate figures for component countries<strong>of</strong><br />
the former USSR are likely to be understated and<br />
should be used with caution.<br />
Ethiopia and Eritrea<br />
Caution is also required when using data for<br />
Ethiopia. This figure may include arrivals born in<br />
Eritrea since settlers who reported Ethiopia as<br />
their country <strong>of</strong> birth were coded as such, despite<br />
the fact that they may have been born in what is<br />
now called Eritrea.<br />
Additional Data<br />
Upon request, the <strong>Department</strong> <strong>of</strong> <strong>Immigration</strong> and<br />
<strong>Citizenship</strong> <strong>of</strong>fers a range <strong>of</strong> tables not published<br />
in this report. Statistics on settler arrivals can be<br />
cross-tabulated with the following data items:<br />
−<br />
−<br />
−<br />
Country <strong>of</strong> birth<br />
Country <strong>of</strong> citizenship<br />
Country <strong>of</strong> last residence<br />
−<br />
−<br />
−<br />
−<br />
−<br />
−<br />
State/territory <strong>of</strong> intended residence<br />
Sex<br />
Age<br />
Migration category<br />
Occupation<br />
Applicant type (primary, secondary).<br />
More complex requests for data and requests for<br />
multiple years <strong>of</strong> data do incur a charge.<br />
Symbols and Abbreviations<br />
The following symbols or abbreviations are used<br />
throughout this publication:<br />
excl = excluding<br />
na = not available<br />
nec = not elsewhere classified<br />
nei = not elsewhere included<br />
nfd = not further defined<br />
nya = not yet available<br />
p = preliminary<br />
r = revised<br />
- = nil<br />
. . = not applicable<br />
Rounding<br />
Where figures have been rounded, discrepancies<br />
may occur between sums <strong>of</strong> the component items<br />
and totals.
55<br />
Country classification (based on SACC)<br />
OCEANIA AND ANTARCTICA<br />
Australia (includes External Territories)<br />
Australia<br />
Norfolk Island<br />
Australian External Territories, nec<br />
New Zealand<br />
New Zealand<br />
Melanesia<br />
New Caledonia<br />
Papua New Guinea<br />
Solomon Islands<br />
Vanuatu<br />
Micronesia<br />
Guam<br />
Kiribati<br />
Marshall Islands<br />
Micronesia, Federated States <strong>of</strong><br />
Nauru<br />
Northern Mariana Islands<br />
Palau<br />
Polynesia (excludes Hawaii)<br />
Cook Islands<br />
Fiji<br />
French Polynesia<br />
Niue<br />
Pitcairn Island<br />
Samoa<br />
Samoa, American<br />
Tokelau<br />
Tonga<br />
Tuvalu<br />
Wallis and Futuna<br />
Polynesia (excludes Hawaii), nec<br />
Antarctica<br />
Adélie Land (France)<br />
Argentinian Antarctic Territory<br />
Australian Antarctic Territory<br />
British Antarctic Territory<br />
Chilean Antarctic Territory<br />
Queen Maud Land (Norway)<br />
Ross Dependency (New Zealand)<br />
NORTH-WEST EUROPE<br />
United Kingdom<br />
Channel Islands<br />
England<br />
Isle <strong>of</strong> Man<br />
Northern Ireland<br />
Scotland<br />
Wales<br />
Ireland<br />
Ireland<br />
Western Europe<br />
Austria<br />
Belgium<br />
France<br />
Germany<br />
Liechtenstein<br />
Luxembourg<br />
Monaco<br />
Netherlands<br />
Switzerland<br />
Northern Europe<br />
Aland Islands<br />
Denmark<br />
Faroe Islands<br />
Finland<br />
Greenland<br />
Iceland<br />
Norway<br />
Sweden<br />
SOUTHERN AND EASTERN EUROPE<br />
Southern Europe<br />
Andorra<br />
Gibraltar<br />
Holy See<br />
Italy<br />
Malta<br />
Portugal<br />
San Marino<br />
Spain<br />
South Eastern Europe<br />
Albania<br />
Bosnia and Herzegovina<br />
Bulgaria<br />
Croatia<br />
Cyprus<br />
Former Serbia and Montenegro<br />
Former Yugoslav Republic <strong>of</strong> Macedonia<br />
Greece<br />
Kosovo<br />
Moldova<br />
Montenegro<br />
Romania<br />
Serbia<br />
Slovenia<br />
Yugoslavia, Federal Republic <strong>of</strong>
56<br />
Eastern Europe<br />
Belarus<br />
Czech Republic<br />
Estonia<br />
Hungary<br />
Latvia<br />
Lithuania<br />
Poland<br />
Russian Federation<br />
Slovakia<br />
Ukraine<br />
NORTH AFRICA AND THE MIDDLE EAST<br />
North Africa<br />
Algeria<br />
Egypt<br />
Libya<br />
Morocco<br />
Spanish North Africa<br />
Sudan<br />
Tunisia<br />
Western Sahara<br />
Middle East<br />
Bahrain<br />
Gaza Strip and West Bank<br />
Iran<br />
Iraq<br />
Israel<br />
Jordan<br />
Kuwait<br />
Lebanon<br />
Oman<br />
Qatar<br />
Saudi Arabia<br />
Syria<br />
Turkey<br />
United Arab Emirates<br />
Yemen<br />
SOUTH-EAST ASIA<br />
Mainland South-East Asia<br />
Burma (Myanmar)<br />
Cambodia<br />
Laos<br />
Thailand<br />
Viet Nam<br />
Maritime South-East Asia<br />
Brunei Darussalam<br />
Indonesia<br />
Malaysia<br />
Philippines<br />
Singapore<br />
NORTH-EAST ASIA<br />
China (excludes SARs and Taiwan)<br />
Hong Kong (SAR <strong>of</strong> China)<br />
Macau (SAR <strong>of</strong> China)<br />
Mongolia<br />
Taiwan<br />
Japan and the Koreas<br />
Japan<br />
Korea, Democratic People's Republic <strong>of</strong> (North)<br />
Korea, Republic <strong>of</strong> (South)<br />
SOUTHERN AND CENTRAL ASIA<br />
Southern Asia<br />
Bangladesh<br />
Bhutan<br />
India<br />
Maldives<br />
Nepal<br />
Pakistan<br />
Sri Lanka<br />
Central Asia<br />
Afghanistan<br />
Armenia<br />
Azerbaijan<br />
Georgia<br />
Kazakhstan<br />
Kyrgyz Republic<br />
Tajikistan<br />
Turkmenistan<br />
Uzbekistan<br />
AMERICAS<br />
Northern America<br />
Bermuda<br />
Canada<br />
St Pierre and Miquelon<br />
United States <strong>of</strong> America<br />
South America<br />
Argentina<br />
Bolivia<br />
Brazil<br />
Chile<br />
Colombia<br />
Ecuador<br />
Falkland Islands<br />
French Guiana<br />
Guyana<br />
Paraguay<br />
Peru<br />
Suriname<br />
Uruguay<br />
Venezuela<br />
South America, nec
57<br />
Central America<br />
Belize<br />
Costa Rica<br />
El Salvador<br />
Guatemala<br />
Honduras<br />
Mexico<br />
Nicaragua<br />
Panama<br />
Caribbean<br />
Anguilla<br />
Antigua and Barbuda<br />
Aruba<br />
Bahamas<br />
Barbados<br />
Cayman Islands<br />
Cuba<br />
Dominica<br />
Dominican Republic<br />
Grenada<br />
Guadeloupe<br />
Haiti<br />
Jamaica<br />
Martinique<br />
Montserrat<br />
Netherlands Antilles<br />
Puerto Rico<br />
St Barthelemy<br />
St Kitts and Nevis<br />
St Lucia<br />
St Martin (French part)<br />
St Vincent and the Grenadines<br />
Trinidad and Tobago<br />
Turks and Caicos Islands<br />
Virgin Islands, British<br />
Virgin Islands, United States<br />
SUB-SAHARAN AFRICA<br />
Central and West Africa<br />
Benin<br />
Burkina Faso<br />
Cameroon<br />
Cape Verde<br />
Central African Republic<br />
Chad<br />
Congo<br />
Congo, Democratic Republic <strong>of</strong><br />
Côte d'Ivoire<br />
Equatorial Guinea<br />
Gabon<br />
Gambia<br />
Ghana<br />
Guinea<br />
Guinea-Bissau<br />
Liberia<br />
Mali<br />
Mauritania<br />
Niger<br />
Nigeria<br />
Sao Tomé and Principe<br />
Senegal<br />
Sierra Leone<br />
Togo<br />
Southern and East Africa<br />
Angola<br />
Botswana<br />
Burundi<br />
Comoros<br />
Djibouti<br />
Eritrea<br />
Ethiopia<br />
Kenya<br />
Lesotho<br />
Madagascar<br />
Malawi<br />
Mauritius<br />
Mayotte<br />
Mozambique<br />
Namibia<br />
Réunion<br />
Rwanda<br />
St Helena<br />
Seychelles<br />
Somalia<br />
South Africa<br />
Swaziland<br />
Tanzania<br />
Uganda<br />
Zambia<br />
Zimbabwe<br />
Southern and East Africa, nec
58<br />
Statistical publications<br />
The <strong>Department</strong> <strong>of</strong> <strong>Immigration</strong> and <strong>Citizenship</strong> produces a number <strong>of</strong> regular and special publications<br />
providing statistics which are relevant to the formulation and assessment <strong>of</strong> immigration policies and<br />
procedures. Some <strong>of</strong> the publications referred to below, are available from the department’s website<br />
http://www.immi.gov.au/media/statistics, along with other migration information.<br />
Migrant data can also be obtained from the Australian Bureau <strong>of</strong> Statistics (ABS). See the ABS website<br />
http://www.abs.gov.au<br />
Regular publications<br />
<strong>Immigration</strong> update (produced biannually)<br />
Settler arrivals (produced annually)<br />
<strong>Emigration</strong> (re-commenced 2005-2006)<br />
Population flows – <strong>Immigration</strong> aspects (produced annually)